Territorial Urban Metabolism — results across scales (ECLECTIC)
Material flows and domestic material consumption of Italy, Portugal and Sweden, from nation to municipality, calculated with the Urban Metabolism Analyst (UMAn).
Method · Italy · Portugal · Sweden · Comparison · About
Draft. The findings below were written from the generated tables (base parameters, 2019 unless stated) and need review by the case leads.
This report brings together the UMAN results for the three ECLECTIC countries at every scale for which they could be calculated: Sweden from the nation down to the municipality of Göteborg (five levels), Italy and the Autonomous Province of Bolzano, and Portugal, Centro and Região de Coimbra. Seven "rest-of" territories (each parent minus its child) complete the picture. Every territory follows the same template, so material use can be compared across scales.
Main messages (2019):
- National levels differ by a factor of three: Sweden 21.9 t of DMC per capita, Portugal 10.9, Italy 7.6. The ranking follows domestic extraction per capita (21.5, 7.8 and 4.4 t).
- In Sweden, DMC per capita hardly depends on scale (19.1–23.0 t/cap from nation to municipality). What changes with scale is openness: the share of material inputs that come from outside the territory rises from 28% (Sweden) to 47% (Södra Sverige), about 60% (Västsverige, Västra Götaland) and 84% (Göteborg).
- Regions can differ strongly from their country: Bolzano consumes 20.8 t/cap against 7.5 t/cap in the rest of Italy; Centro 12.8 against 10.3 in the rest of Portugal. Both are extraction regions (wood and fruit; stone).
- Non-metallic minerals dominate DMC almost everywhere (35–67%), mainly crushed and building stone; biomass comes second. Bolzano is the exception (biomass 52%). Fossil fuels weigh most where refineries and energy imports are (Italy 30%, Göteborg 23%, rest of Portugal 21%).
- Uncertainty grows as the territory shrinks. The unbalanced share is 2% for Sweden and 19% for Göteborg, and the smallest rest-of territories carry negative cells of up to 14% of their DMC.
Generated by analysis/full_report/05_write_report.R
on 2026-11-02. Instructions and decisions:
docs/16_full_report_brief.md (UMAN repository). Rebuild:
run analysis/full_report/00–05 in order. Text
between NOTES markers is hand-written and kept on
rebuild.
Method
Method · Italy · Portugal · Sweden · Comparison · About
What the Urban Metabolism Analyst does
Cities depend on a continuous supply of materials. Resources enter a territory, are transformed and consumed, circulate between activities, accumulate in buildings and infrastructure, and leave as products, emissions or waste. Material Flow Analysis (MFA) measures these flows; the Urban Metabolism Analyst (UMAn), developed by Rosado and colleagues, follows them product by product and links them to the economic activities that use and transform them. This makes it possible to tell which products and activities drive the material use of a territory, which is what circular-economy actions target.
A product-level metabolism needs more than imports minus exports: products can be transformed several times inside the territory before they are consumed or leave it. UMAn reconstructs these transformations in eight steps (ECLECTIC deliverable D1.3, Monitoring scheme for Circular Economy action plans in cities):
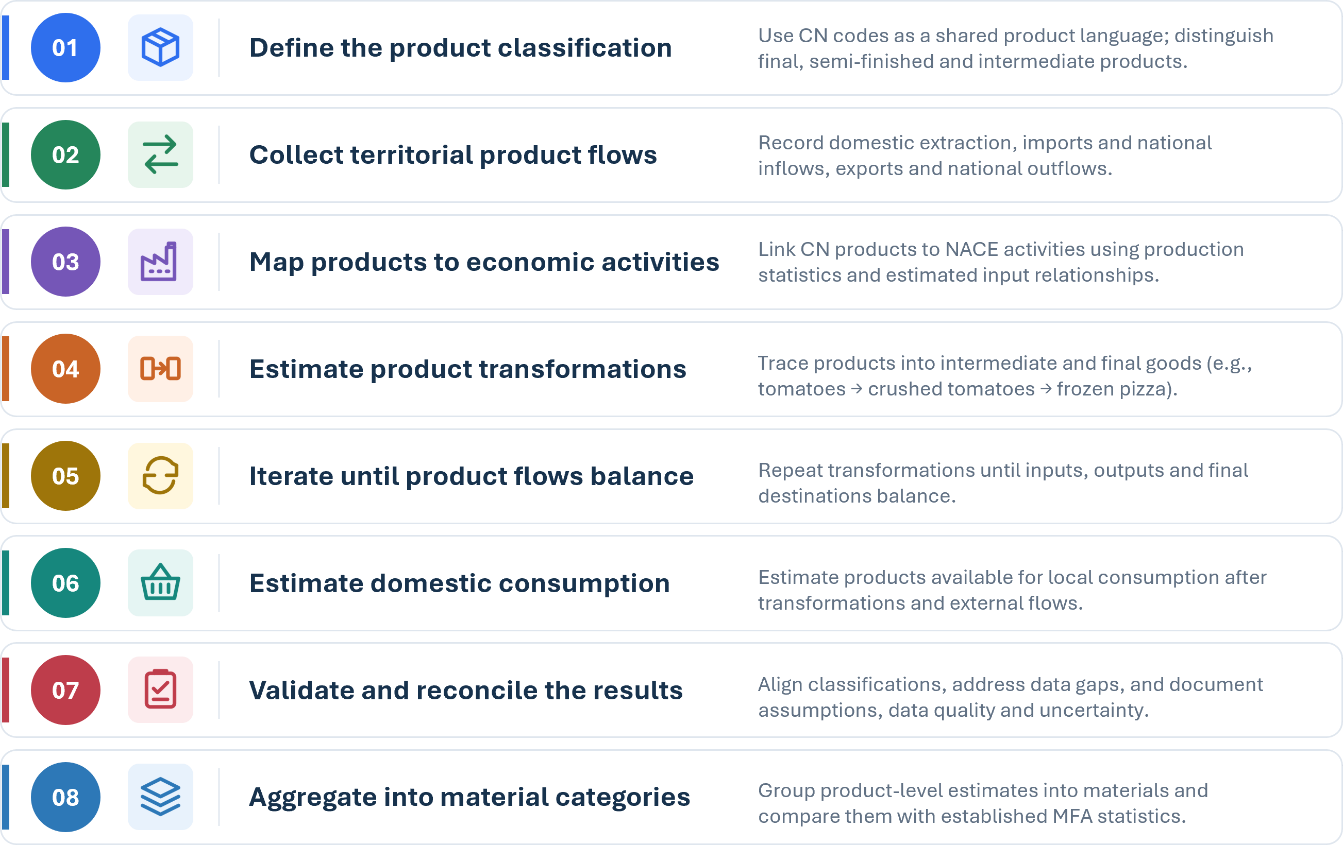
- Product classification. All flows are expressed in the Combined Nomenclature (CN, about 10 000 products, 1 000 headings, 100 chapters), distinguishing final, semi-finished and intermediate products.
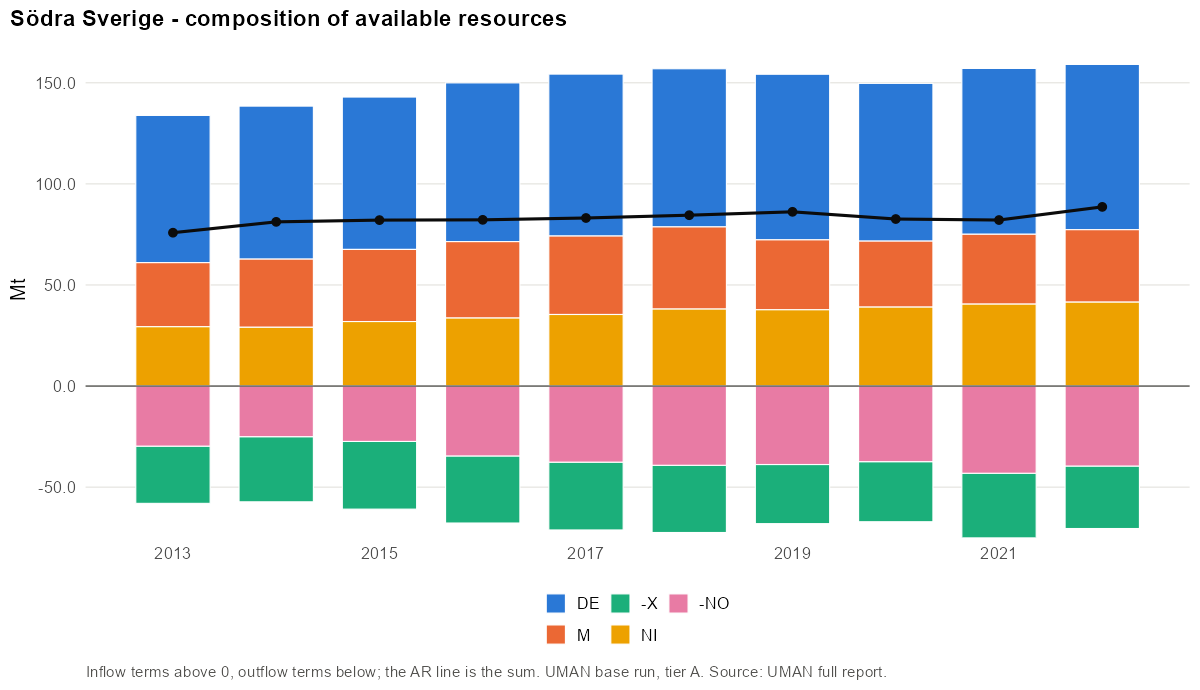
- Territorial flows. Domestic extraction (DE), international imports (M) and exports (X), and domestic inflows (NI) and outflows (NO) from and to the rest of the country. Their balance is the available resources: AR = DE + M − X + NI − NO.
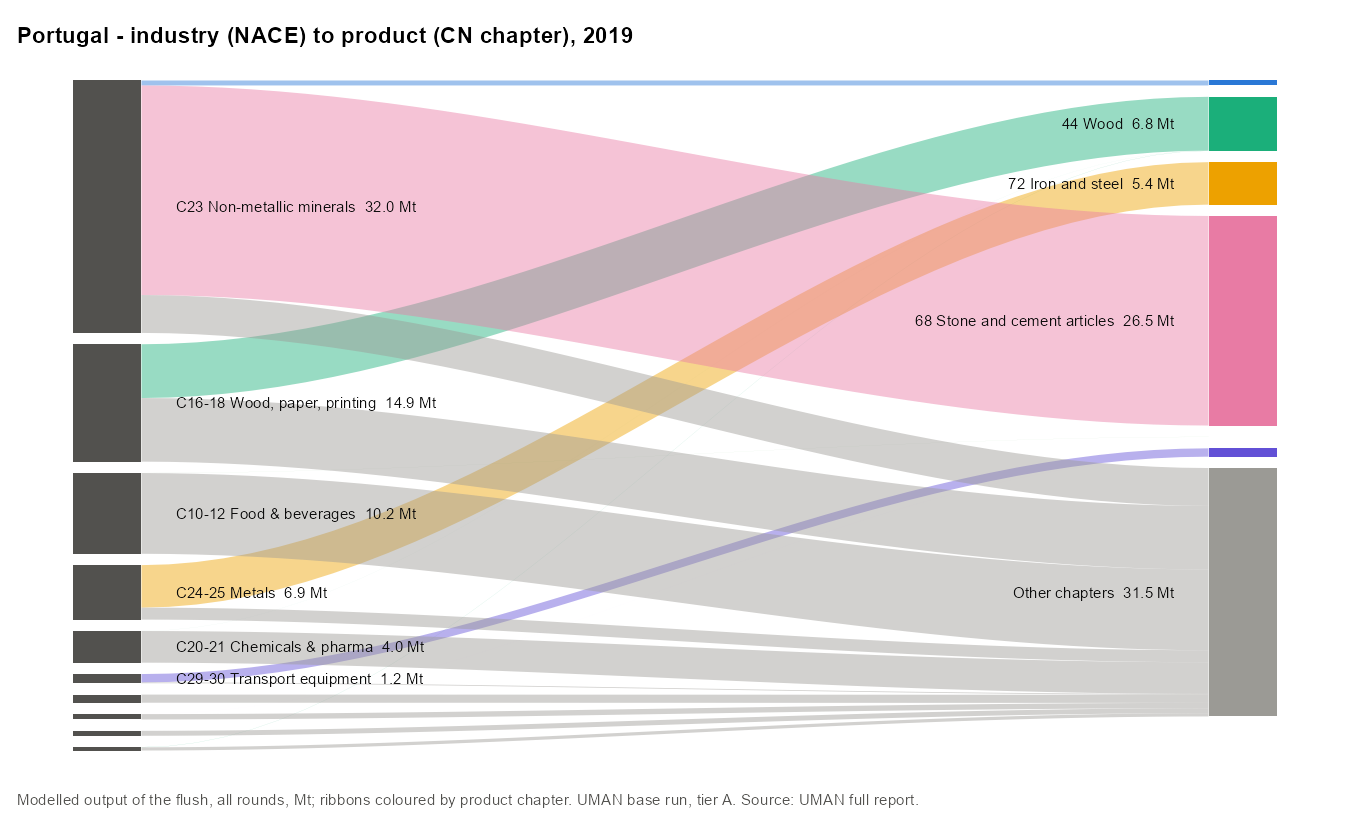
- Products to activities. CN products are linked to NACE activities: production statistics tell which industries make which products; detailed trade data tell which industries use which inputs.
- Product transformations. Products are followed through successive production steps, e.g. fresh tomatoes (CN 0702) → crushed tomatoes (CN 2002, NACE 10.39) → frozen pizza (CN 1905, NACE 10.85).
- Iterate until flows balance. The transformation is repeated (the flush) until every tonne is consumed locally, transformed, kept in stock, exported or sent to the rest of the country.
- Product-level consumption. The result is the domestic material consumption (DMC) by product: what is actually consumed in the territory rather than the gross quantities entering it.
- Validate and reconcile. Classifications are aligned, gaps filled with documented assumptions (jobs, firms, relationships observed elsewhere) and uncertainty reported.
- Material categories. Products are converted into material groups (biomass, metals, non-metallic minerals, fossil, chemicals) and compared with economy-wide MFA statistics.
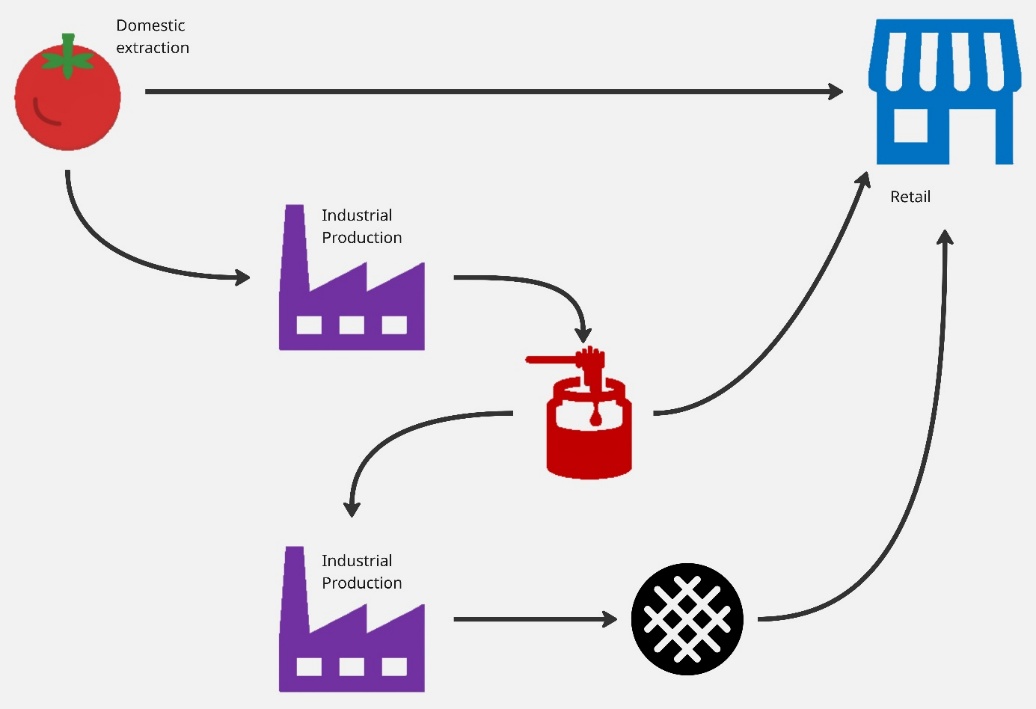
Products can reach final use directly or after one or more industrial transformations (D1.3). Linking CN products to NACE activities avoids counting the same tomato twice.
How the steps are implemented in this report
- Accounts (steps 1–2). For every CN code (CN8; CN4 for Italy) and year: DE, M, X, NI, NO and, where ports matter, transit (MT/XT). AR = DE + M − X + NI − NO + MT − XT.
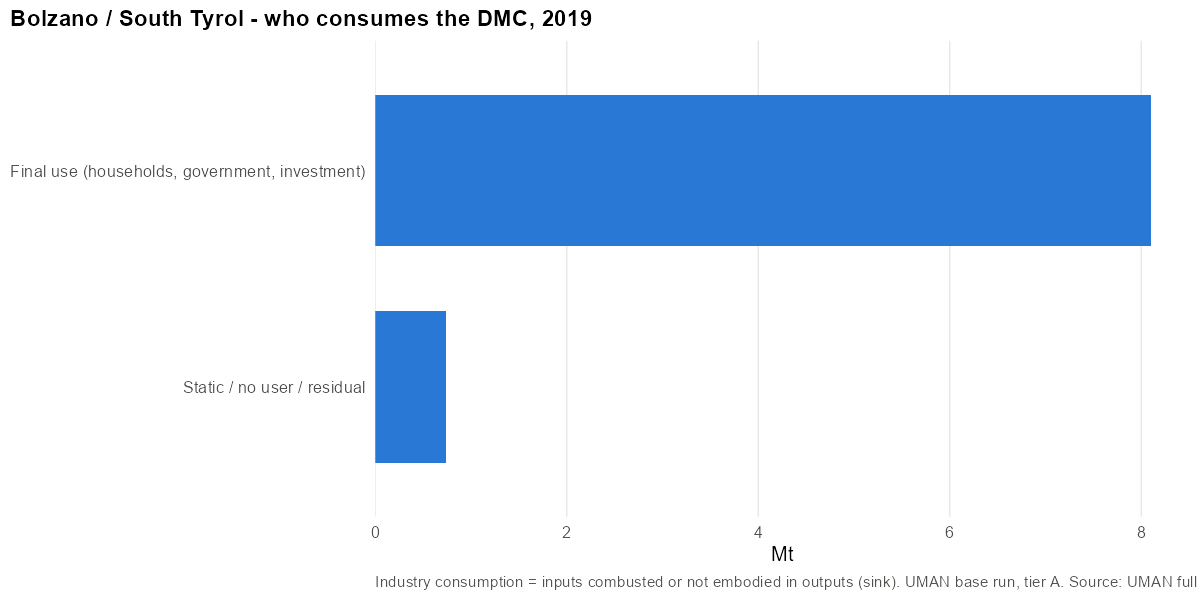
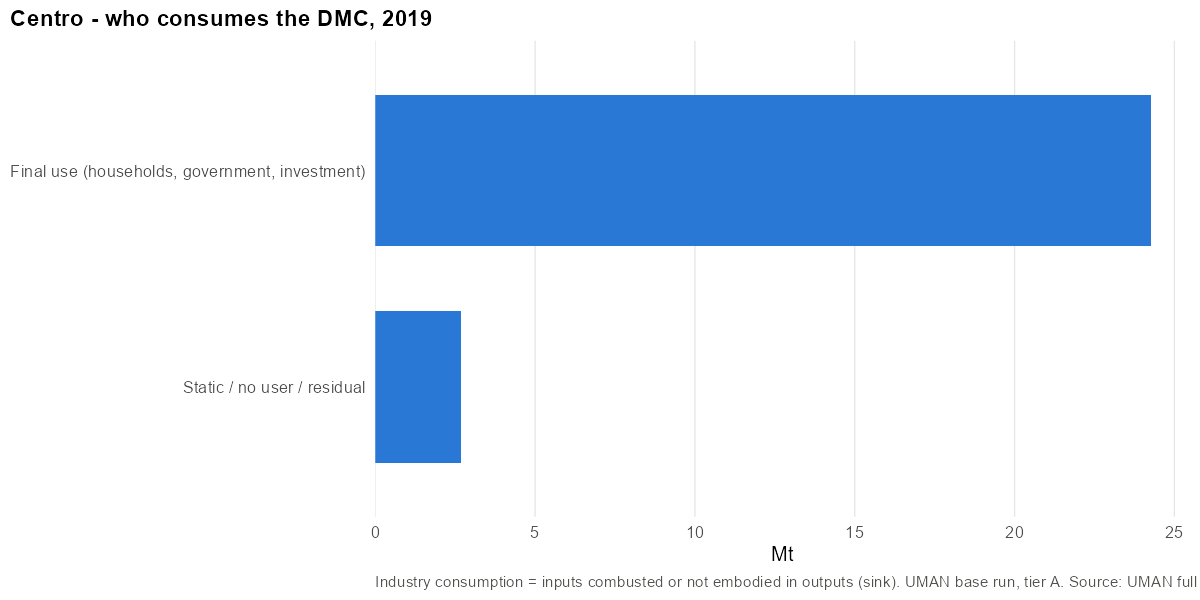
- Flush (steps 3–5). In each round, part of each product goes to final use (households, government, investment) and part to industries. Industries consume it (sink: energy, combustion), keep it (static: same CN4 in and out) or transform it into other products, which enter the next round. Exports exceeding what entered (negative AR) are matched against what industries make (netted). Whatever cannot be matched is unbalanced: DMC = AR + unbalanced.
- Structure. Who uses which product comes from firm imports by industry; what industries make from PRODCOM or industry–product pairs; local industry size from jobs. A known limitation (D1.3): inputs are estimated from imports, so locally sourced inputs (e.g. grapes for local wine) can be underestimated.
- Tiers. A own accounts;
B inputs downscaled from the parent by jobs;
C the parent's DMC downscaled by consumer. Full method:
01_standard_model.md; data requirements:13_data_requirements.md. - Rest-of territories are parent − child for every CN code and year (no new runs).
Data sources
| Component | Italy | Portugal | Sweden |
|---|---|---|---|
| DE | observed IT, Bolzano | observed PT, Centro | observed SE, VGR; downscaled by jobs elsewhere |
| Trade | Comext CN4; Bolzano ISTAT € → t | observed CN8 (PT, Centro) | firm microdata × workplaces (CN8, t) |
| Domestic flows | Bolzano road, NST macro-groups (no rail) | Centro road + rail (NST); Coimbra: tier C | road O–D survey (national), sea by port, rail (VGR), port transit |
| Use (who uses imports) | Portuguese structure (proxy) | firm imports by CAE | firm imports × workplace NACE |
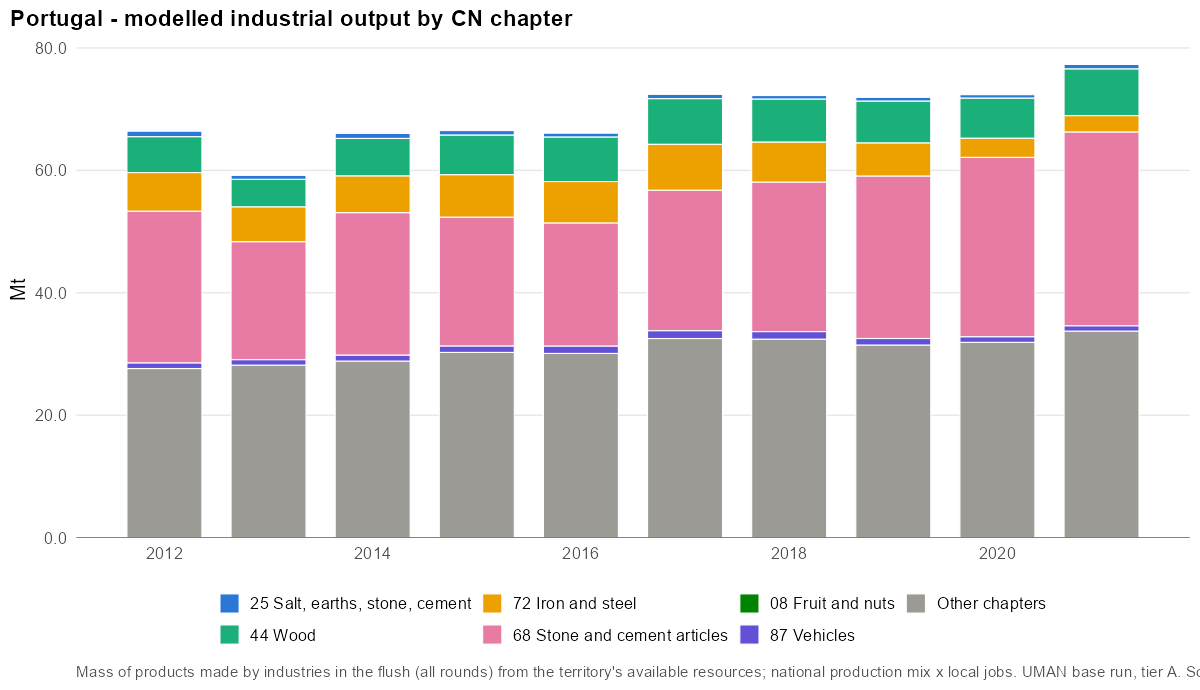
| Production mix | ISTAT industry–product pairs | PRODCOM | PRODCOM tonnes |
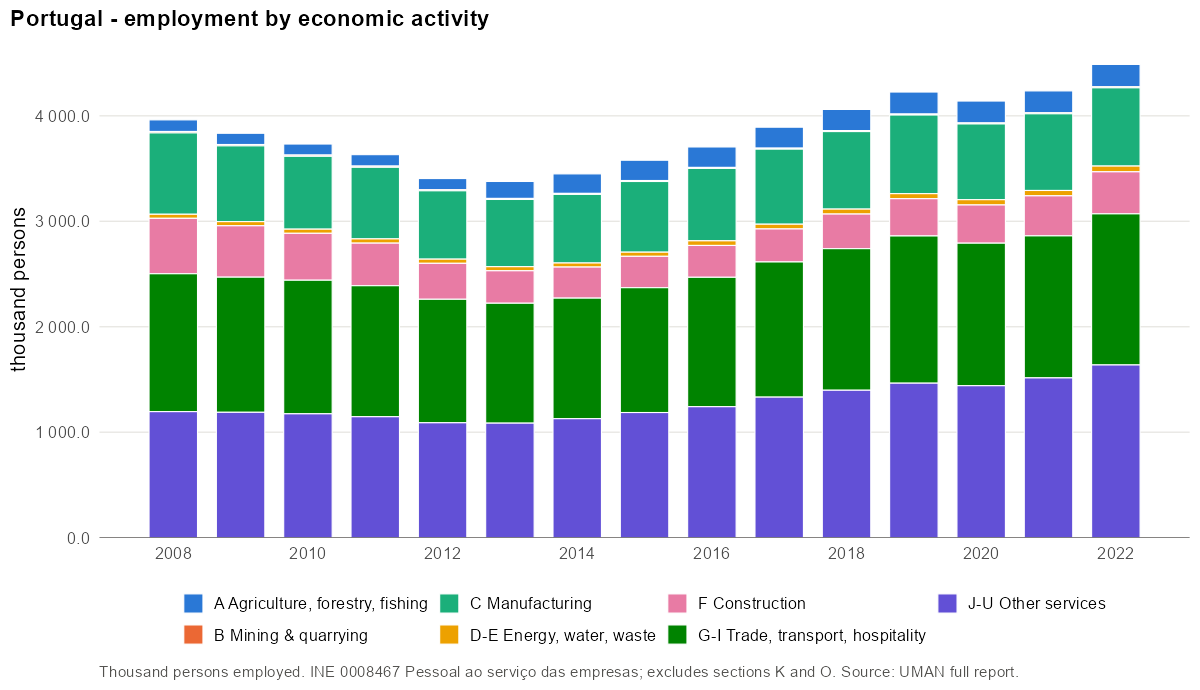
| Employment | ISTAT ASIA, 2012–2021 (no section A) | INE 0008467, 2008–2022 (no K, O) | SCB firm register, NACE4, 2010–2023 |
| Population | Eurostat | INE workbook | SCB |
Case details: 10_portugal.md, 11_italy.md,
15_sweden.md.
Indicators
| Indicator | Definition |
|---|---|
| DMC, DMC/cap | domestic material consumption (t, t per capita) |
| AR, AR/cap | available resources |
| DE/cap | domestic extraction per capita |
| Import dependency | (M + NI + MT) / (DE + M + NI + MT): share of inputs from outside the territory |
| International import dependency | M / (DE + M): comparable for every territory incl. rest-of |
| Self-sufficiency | DE / DMC |
| Export intensity | (X + NO + XT) / (DE + M + NI + MT) |
| Unbalanced share | unbalanced / gross positive AR (as in the UMAN core and the case documents) |
Territories and scales
| Country | Code | Level | Territory | Tier | Years |
|---|---|---|---|---|---|
| Italy | IT | NUTS 0 | Italy | A | 2013–2021 |
| Italy | ITH10 | NUTS 2 = NUTS 3 | Bolzano / South Tyrol | A | 2013–2021 |
| Italy | IT-ITH10 | rest-of | Rest of Italy (IT - ITH10) | rest (IT - ITH10) | 2013–2021 |
| Portugal | PT | NUTS 0 | Portugal | A | 2012–2021 |
| Portugal | PT16 | NUTS 2 | Centro | A | 2015–2021 |
| Portugal | PT16E | NUTS 3 | Região de Coimbra | C | 2015–2021 |
| Portugal | PT-PT16 | rest-of | Rest of Portugal (PT - PT16) | rest (PT - PT16) | 2015–2021 |
| Portugal | PT16-PT16E | rest-of | Rest of Centro (PT16 - PT16E) | rest (PT16 - PT16E) | 2015–2021 |
| Sweden | SE | NUTS 0 | Sweden | A | 2013–2022 |
| Sweden | SE2 | NUTS 1 | Södra Sverige | A | 2013–2022 |
| Sweden | SE23 | NUTS 2 | Västsverige | A | 2013–2022 |
| Sweden | SE232 | NUTS 3 | Västra Götalands län | A | 2013–2022 |
| Sweden | 1480 | LAU | Göteborgs kommun | A | 2013–2022 |
| Sweden | SE-SE2 | rest-of | Rest of Sweden (SE - SE2) | rest (SE - SE2) | 2013–2022 |
| Sweden | SE2-SE23 | rest-of | Rest of Södra Sverige (SE2 - SE23) | rest (SE2 - SE23) | 2013–2022 |
| Sweden | SE23-SE232 | rest-of | Rest of Västsverige (SE23 - SE232) | rest (SE23 - SE232) | 2013–2022 |
| Sweden | SE232-1480 | rest-of | Rest of Västra Götaland (SE232 - 1480) | rest (SE232 - GBG) | 2013–2022 |
- ITH1 = ITH10: NUTS 2 and NUTS 3 are the same territory.
- SE2 Södra Sverige was calculated for this report
(
analysis/full_report/00_se2_pipeline.R): DE downscaled by jobs outside VGR, rail observed only for VGR, southern ports added. - Coimbra (PT16E) is tier C: Centro's DMC downscaled by consumer jobs; its population is 489 761 in the source workbook vs 439 542 in Eurostat (2019).
- Rest-of territories are differences parent − child for every year and CN code (no new runs). Negative cells are kept and reported.
- Comparisons across territories use 2019, the only year every context has.
- Rest-of territories are calculated as parent minus child for every CN code and year. They inherit the methods (and errors) of both runs. Their DMC is not the result of a flush of their own, so production and product transformation cannot be shown for them.
- Unbalanced share is expressed, as in the case documents, relative to the gross positive available resources (the mass entering round 1 of the flush).
- Per capita values use the population of each case's source (SCB, Eurostat, INE workbook). For Coimbra, the workbook population is about 11% higher than Eurostat's (see Região de Coimbra).
Italy
Method · Italy · Portugal · Sweden · Comparison · About
In this chapter: Italy · Bolzano / South Tyrol · Rest of Italy (IT - ITH10)
Italy (IT)
Italy · NUTS 0 · code IT · tier A · years 2013–2021
Findings
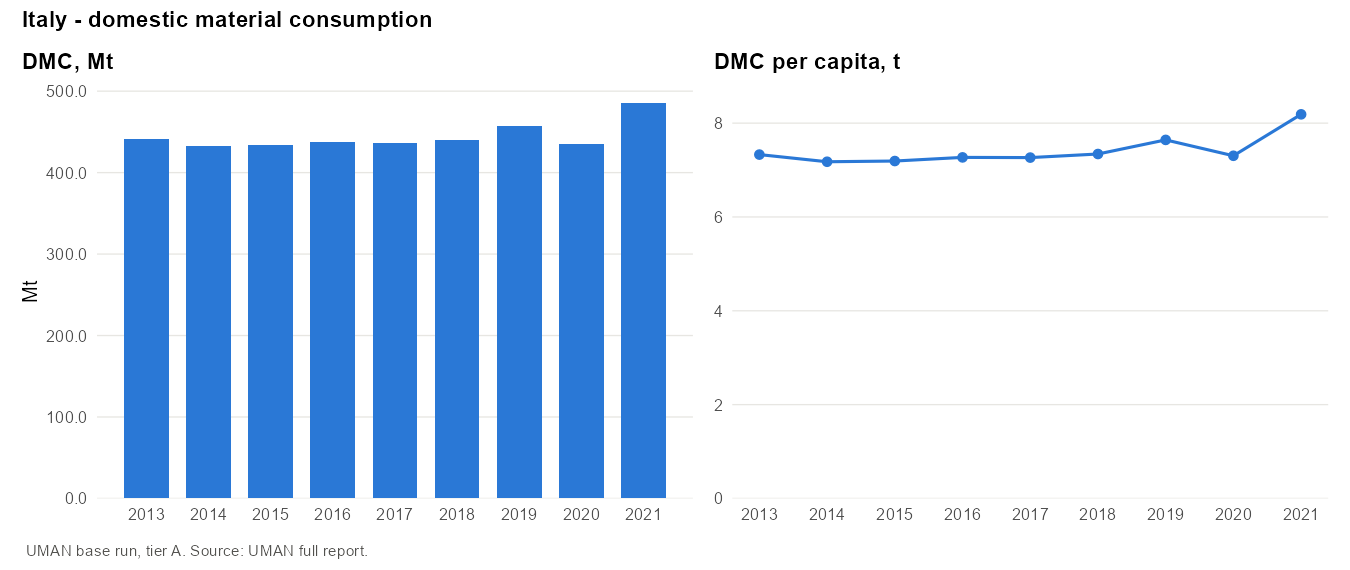
- DMC is 457.2 Mt or 7.6 t/cap in 2019, the lowest per capita value in the report. It ranges from 7.2 to 8.2 t/cap over 2013–2021 and is highest in 2021.
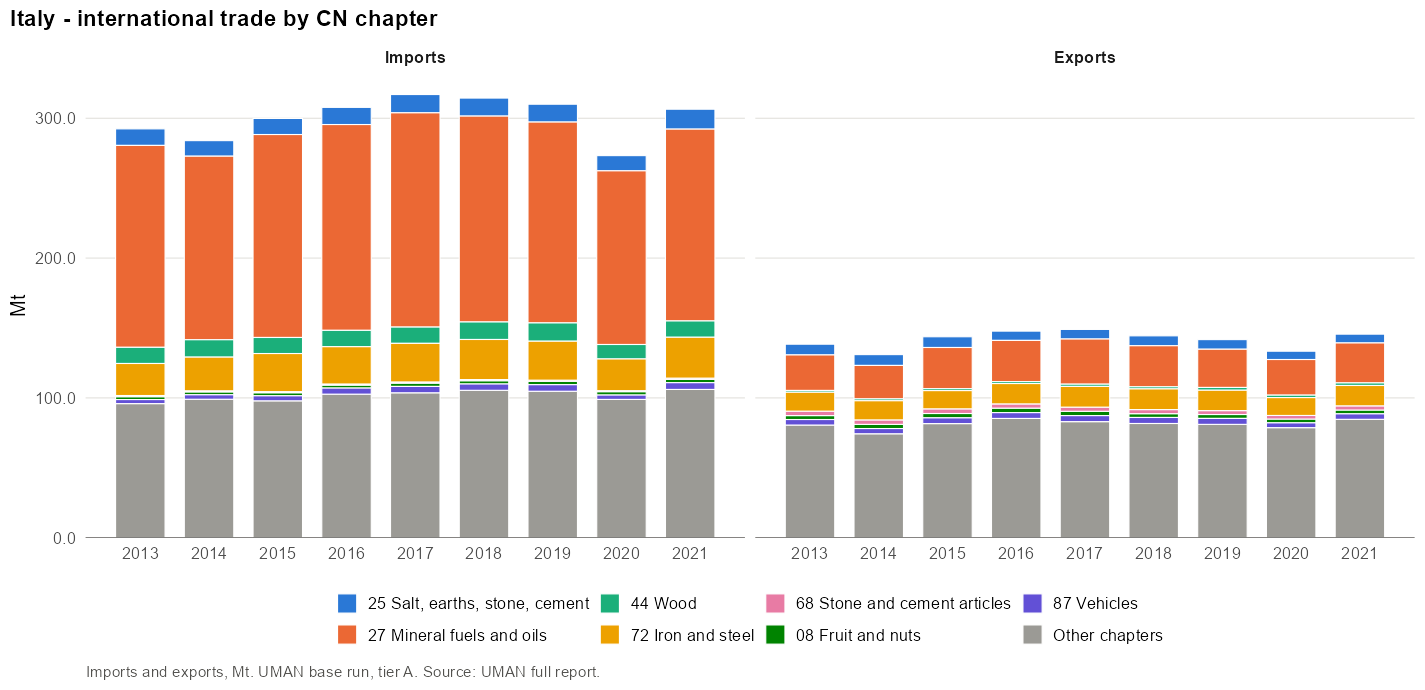
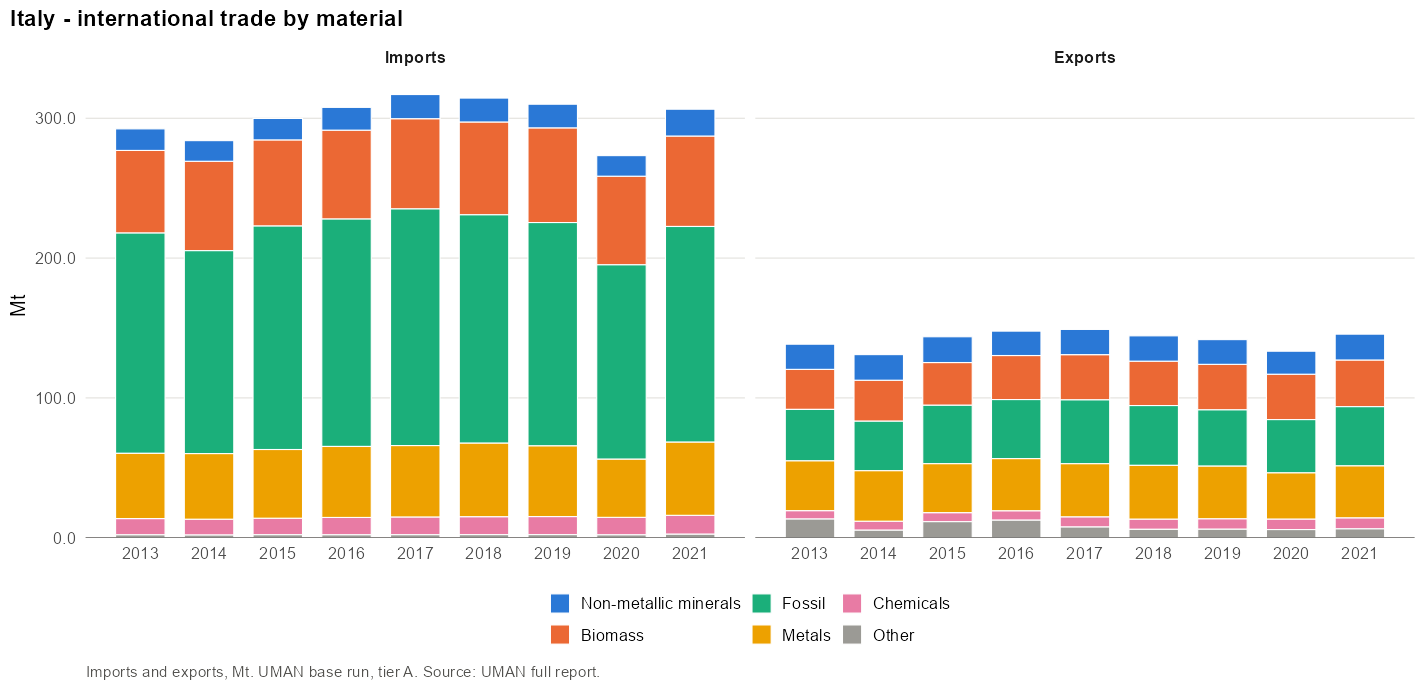
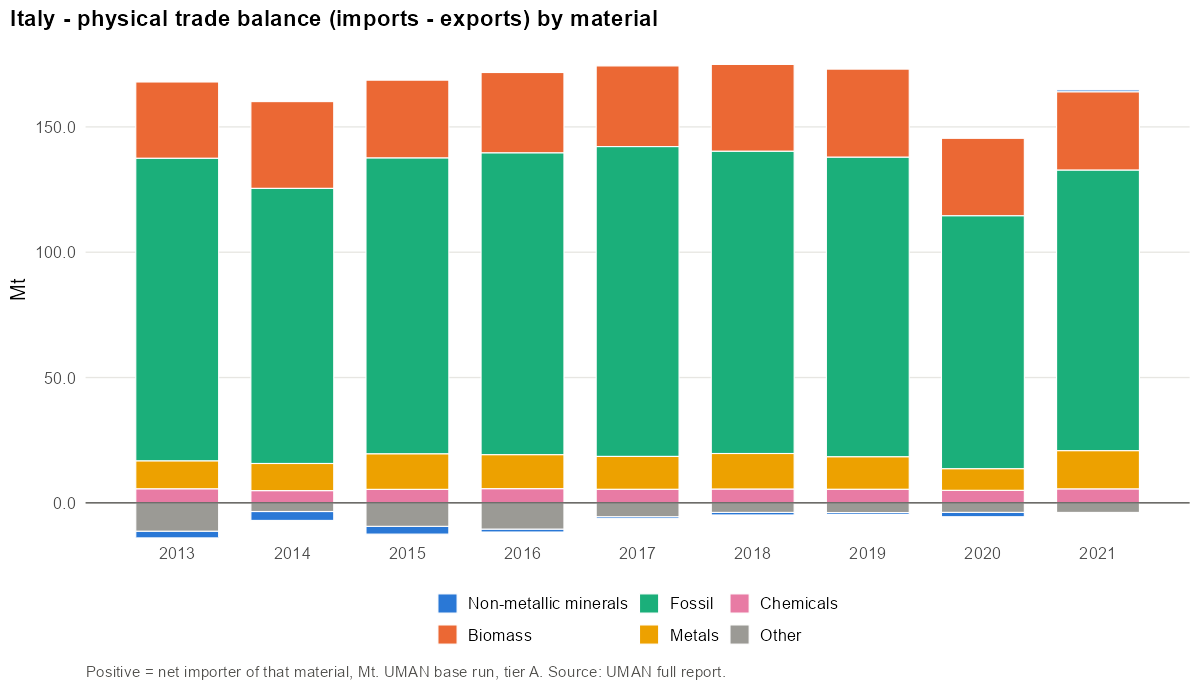
- Italy depends on imports: imports (310.1 Mt) exceed domestic extraction (263.3 Mt). Import dependency is 54% and self-sufficiency 0.58. Crude oil (20%) and natural gas (17%) lead imports.
- DE is 4.4 t/cap, 49% crushed stone, plus granite and kaolin.
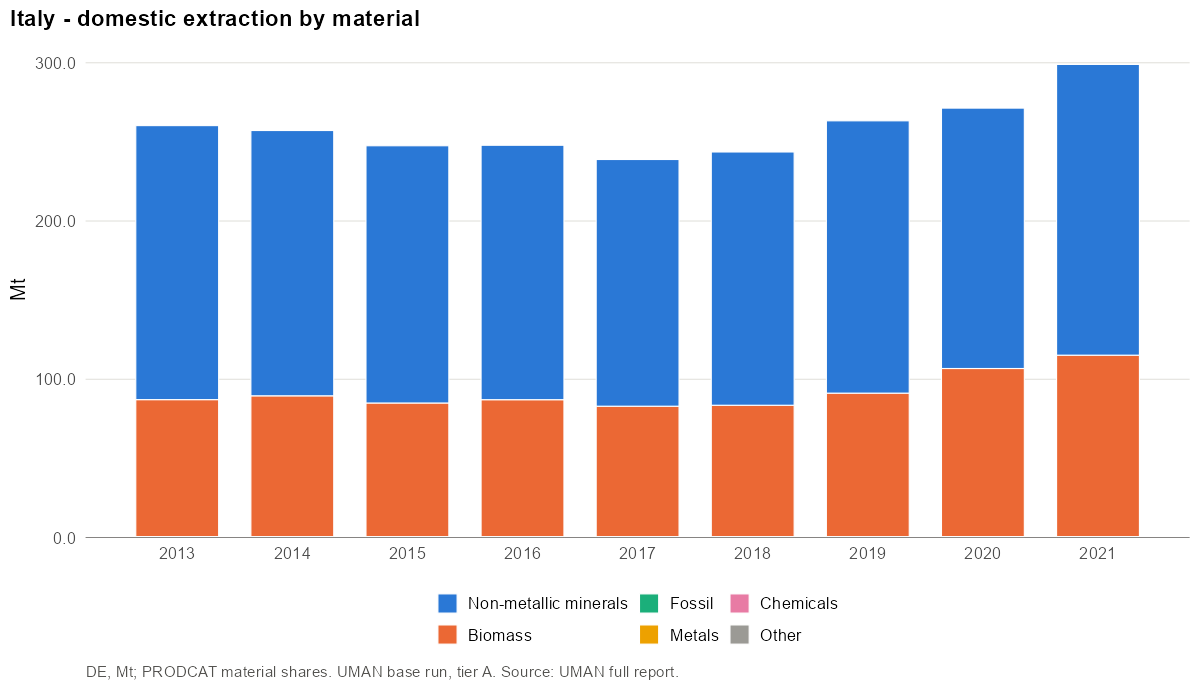
- DMC is the most balanced mix in the report: 35% non-metallic minerals, 30% fossil, 27% biomass. It is also the most diversified: 40 CN4 codes make up 80% of DMC.
- Energy use shows in the flush: industry consumes 168 Mt as sink, by far the largest fate of transformed inputs.
- Caveats: the use structure (who uses imports) is borrowed from Portugal; employment (ASIA) covers enterprises in sections B–S only. The unbalanced share is 5.2%.
Overview
| 2013 | 2019 | 2021 | |
|---|---|---|---|
| Population | 60 277 309 | 59 816 673 | 59 236 213 |
| DE (Mt) | 260.3 | 263.3 | 298.9 |
| Imports M (Mt) | 292.4 | 310.1 | 306.5 |
| Exports X (Mt) | 138.4 | 141.7 | 145.6 |
| Domestic in NI (Mt) | 0.0 | 0.0 | 0.0 |
| Domestic out NO (Mt) | 0.0 | 0.0 | 0.0 |
| AR (Mt) | 414.3 | 431.7 | 459.8 |
| DMC (Mt) | 441.8 | 457.2 | 485.0 |
| DMC (t/cap) | 7.3 | 7.6 | 8.2 |
| Unbalanced (% of gross AR) | 5.8% | 5.2% | 4.8% |
Domestic extraction
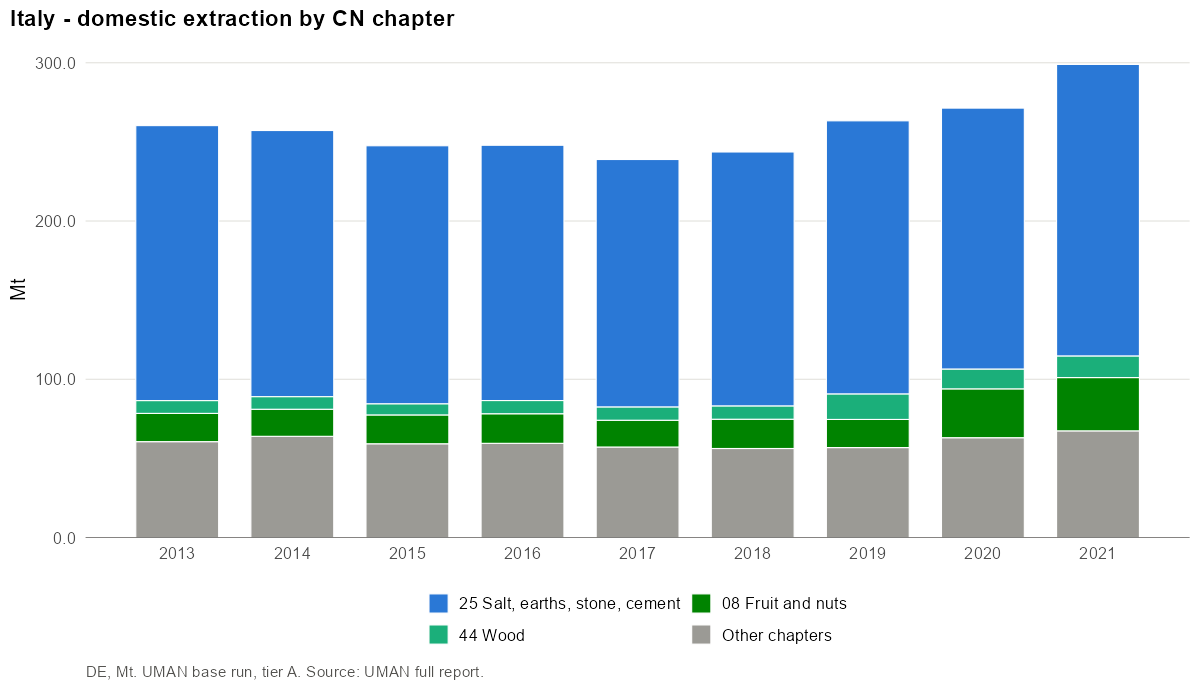
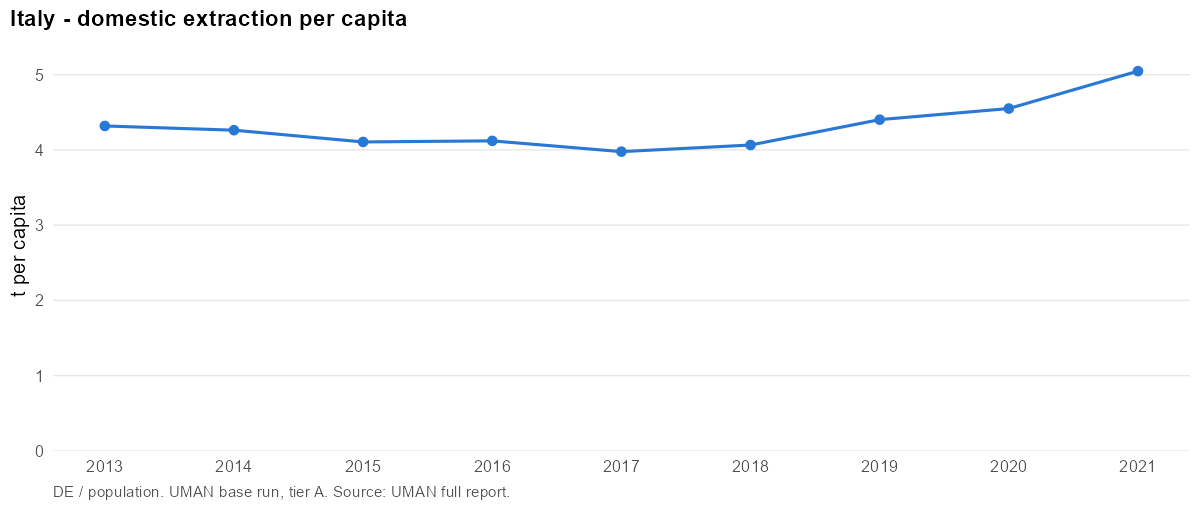
- Main CN4 codes (2019): 2517 Pebbles, gravel, broken or crushed stone, for concrete… (49%); 2516 Granite, porphyry, basalt, sandstone and other monumental… (7%); 2507 Kaolin and other kaolinic clays, whether or not calcined (6%); 1007 Grain sorghum (5%); 4403 Wood in the rough, whether or not stripped of bark or… (4%).
- Main materials: Stone (43%); Agriculture biomass (22%); Other non-metallic minerals (15%).
International trade
Imports:
- Main CN4 codes (2019): 2709 Petroleum oils and oils obtained from bituminous minerals… (20%); 2711 Petroleum gas and other gaseous hydrocarbons (17%); 2710 Petroleum oils and oils obtained from bituminous minerals… (5%); 2701 Coal; briquettes, ovoids and similar solid fuels… (3%); 1001 Wheat and meslin (2%).
- Main materials: Fuels (18%); Iron, steel and ferro-alloys (14%); Plastics and rubbers (13%).
Exports:
- Main CN4 codes (2019): 2710 Petroleum oils and oils obtained from bituminous minerals… (17%); 6907 Ceramic flags and paving, hearth or wall tiles; ceramic… (4%); 7306 Tubes, pipes and hollow profiles ""e.g., open seam or… (2%); 7208 Flat-rolled products of iron or non-alloy steel, of a width… (2%); 1902 Pasta, whether or not cooked or stuffed with meat or other… (2%).
- Main materials: Iron, steel and ferro-alloys (23%); Agriculture biomass (10%); Fuels (10%).
Domestic movement of goods
National territory: no domestic border, NI = NO = 0.
Available resources
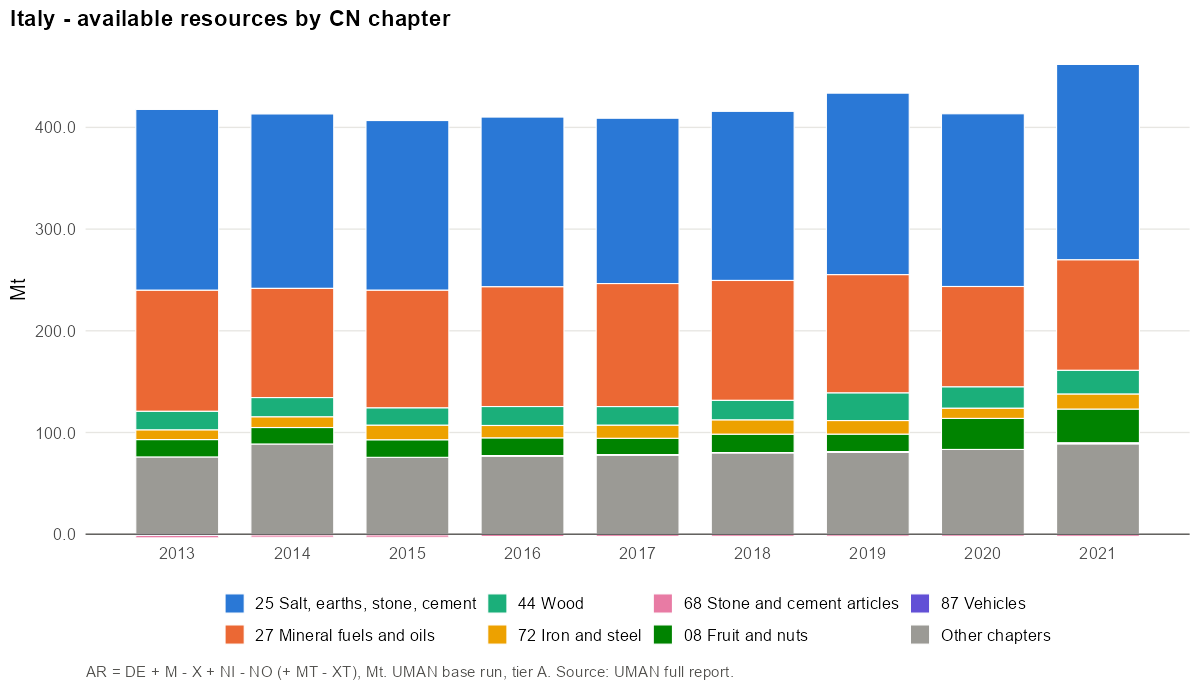
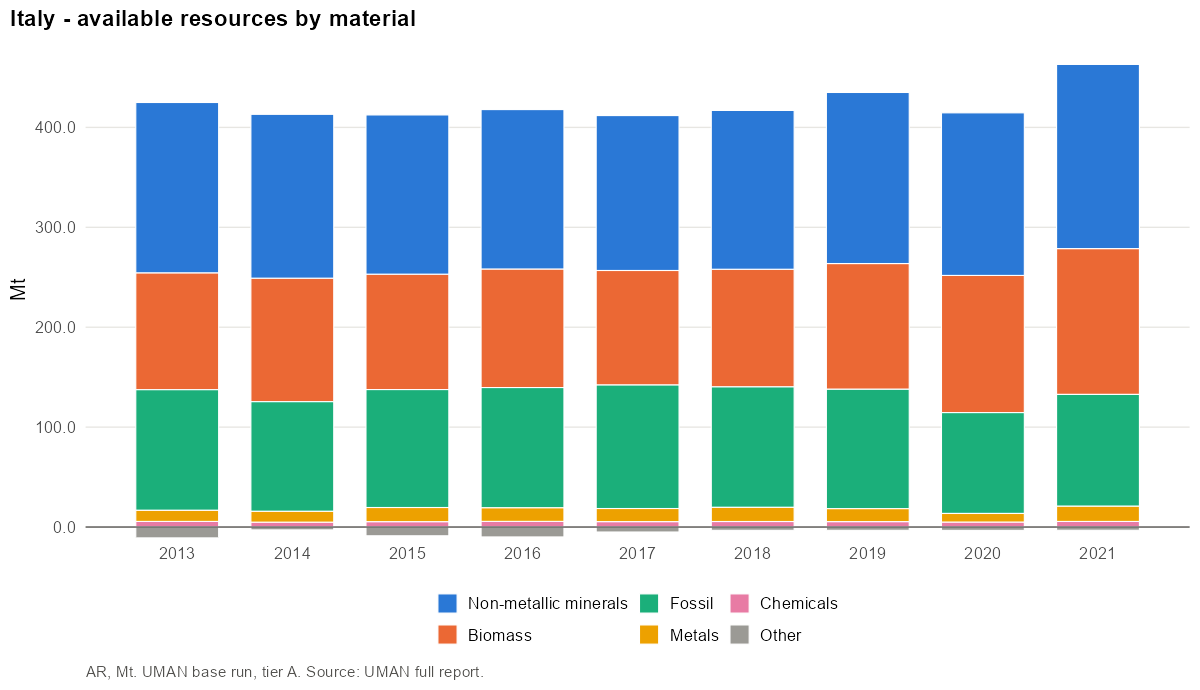
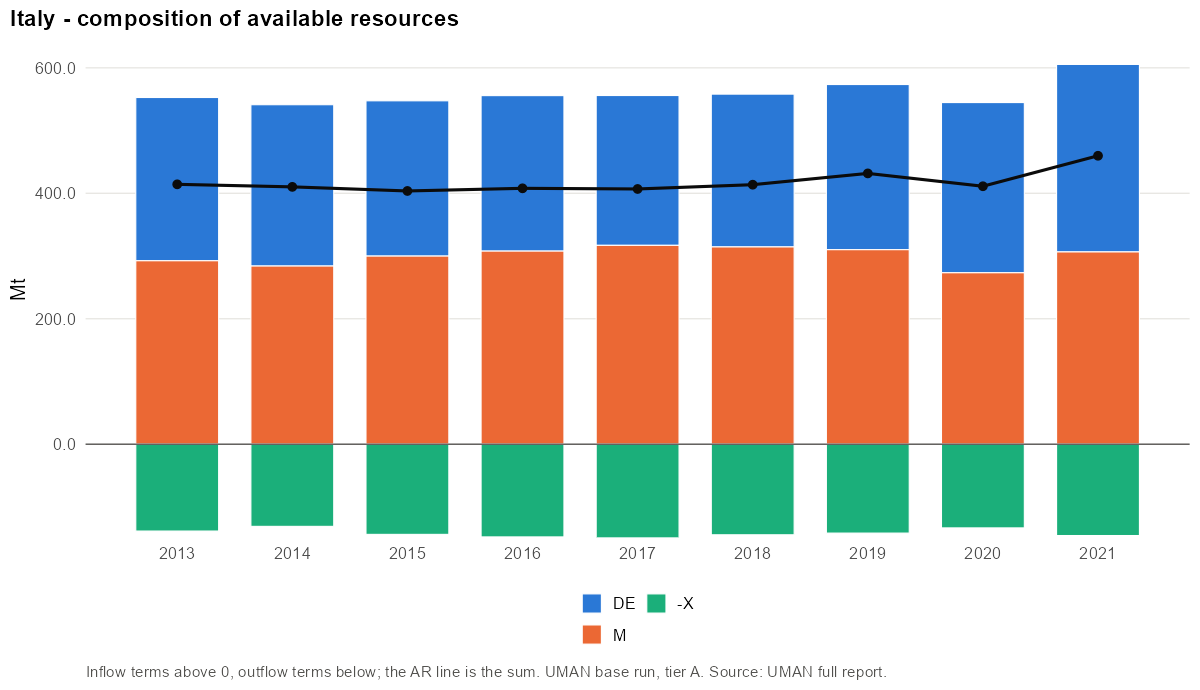
- Main CN4 codes (2019): 2517 Pebbles, gravel, broken or crushed stone, for concrete… (30%); 2709 Petroleum oils and oils obtained from bituminous minerals… (14%); 2711 Petroleum gas and other gaseous hydrocarbons (12%); 2516 Granite, porphyry, basalt, sandstone and other monumental… (4%); 2507 Kaolin and other kaolinic clays, whether or not calcined (4%).
- Main materials: Stone (25%); Agriculture biomass (16%); Other non-metallic minerals (10%).
Industrial production
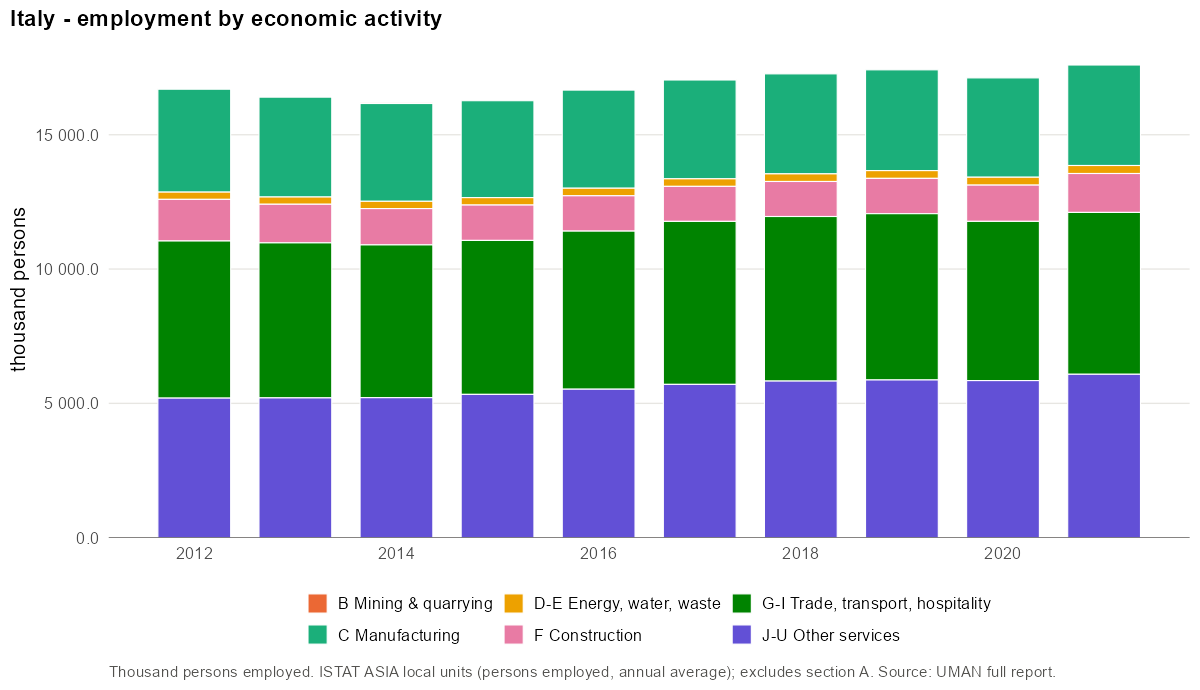
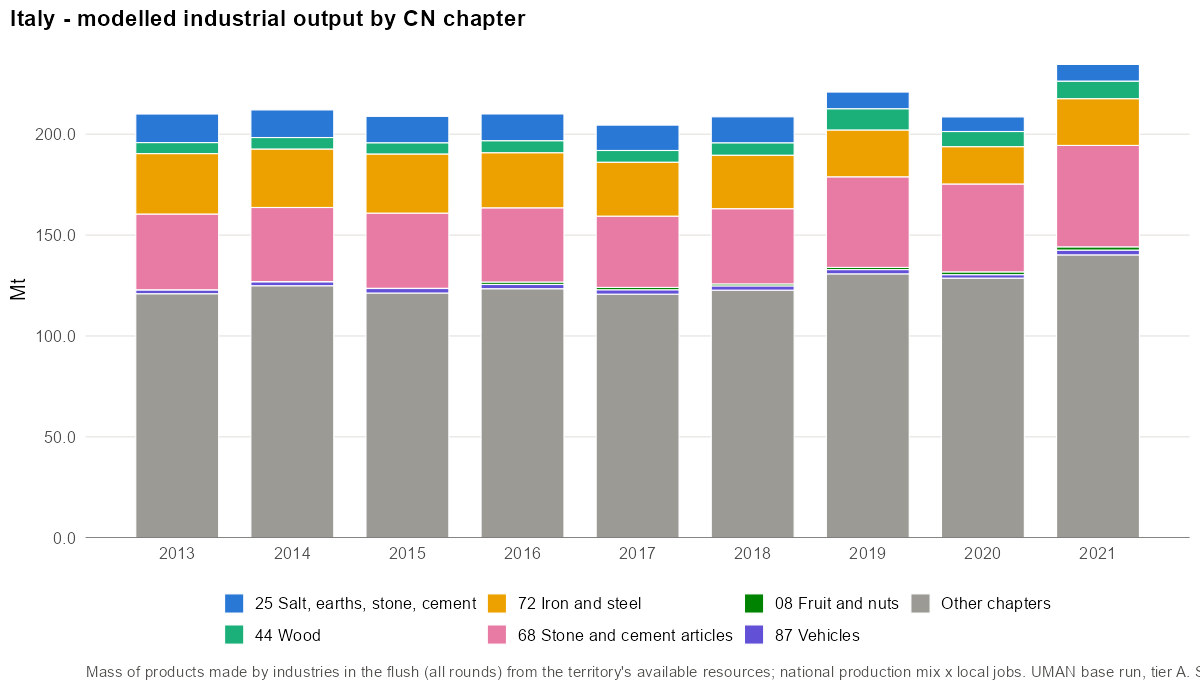
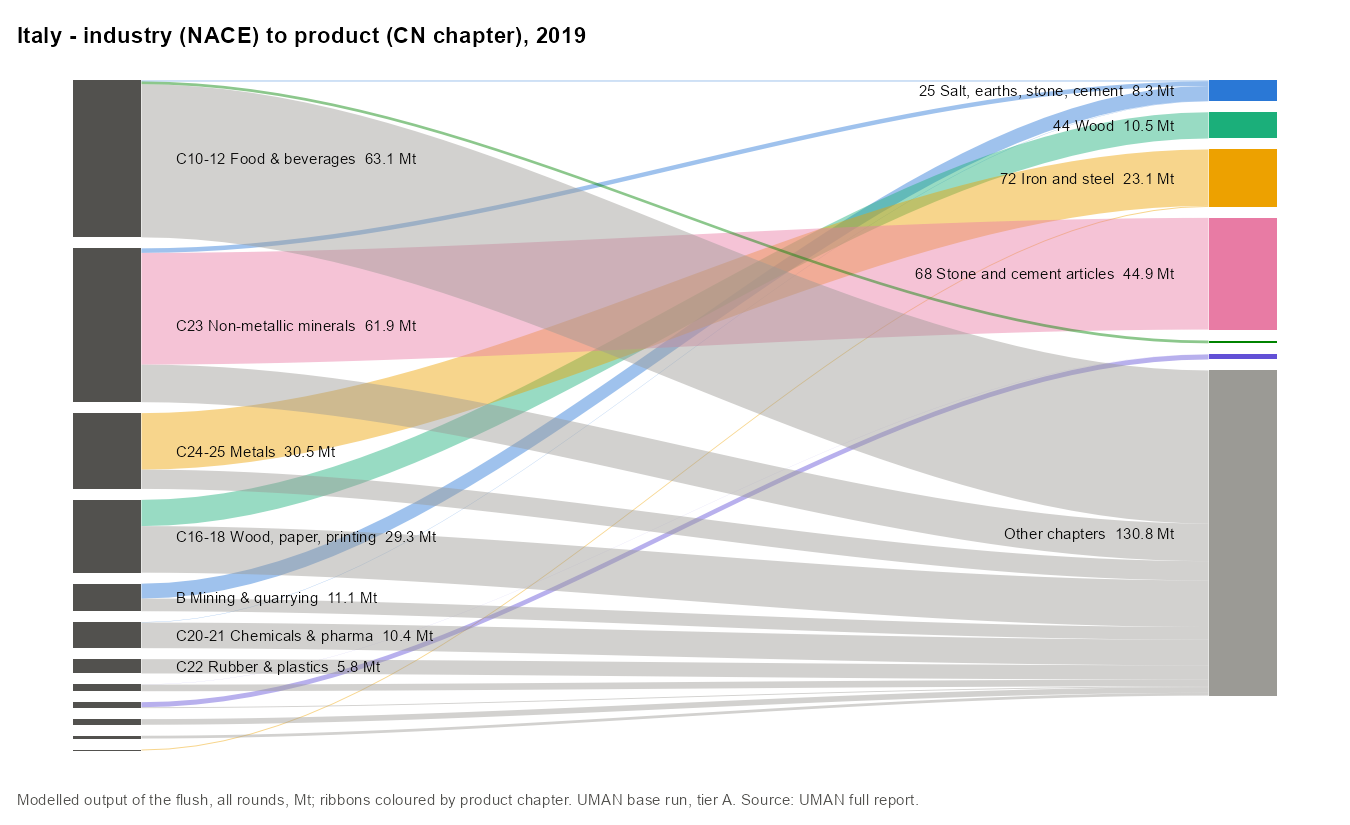
Largest employers (NACE divisions):
| NACE | Activity | Persons | Share |
|---|---|---|---|
| 47 | Retail trade, except of motor vehicles and motorcycles | 1 912 438 | 11.0% |
| 56 | Food and beverage service activities | 1 293 340 | 7.4% |
| 46 | Wholesale trade, except of motor vehicles and motorcycles | 1 144 021 | 6.6% |
| 43 | Specialised construction activities | 934 842 | 5.4% |
| 86 | Human health activities | 560 768 | 3.2% |
| 49 | Land transport and transport via pipelines | 551 633 | 3.2% |
| 25 | Manufacture of fabricated metal products, except machinery and equipment | 551 145 | 3.2% |
| 81 | Services to buildings and landscape activities | 533 727 | 3.1% |
Product transformation
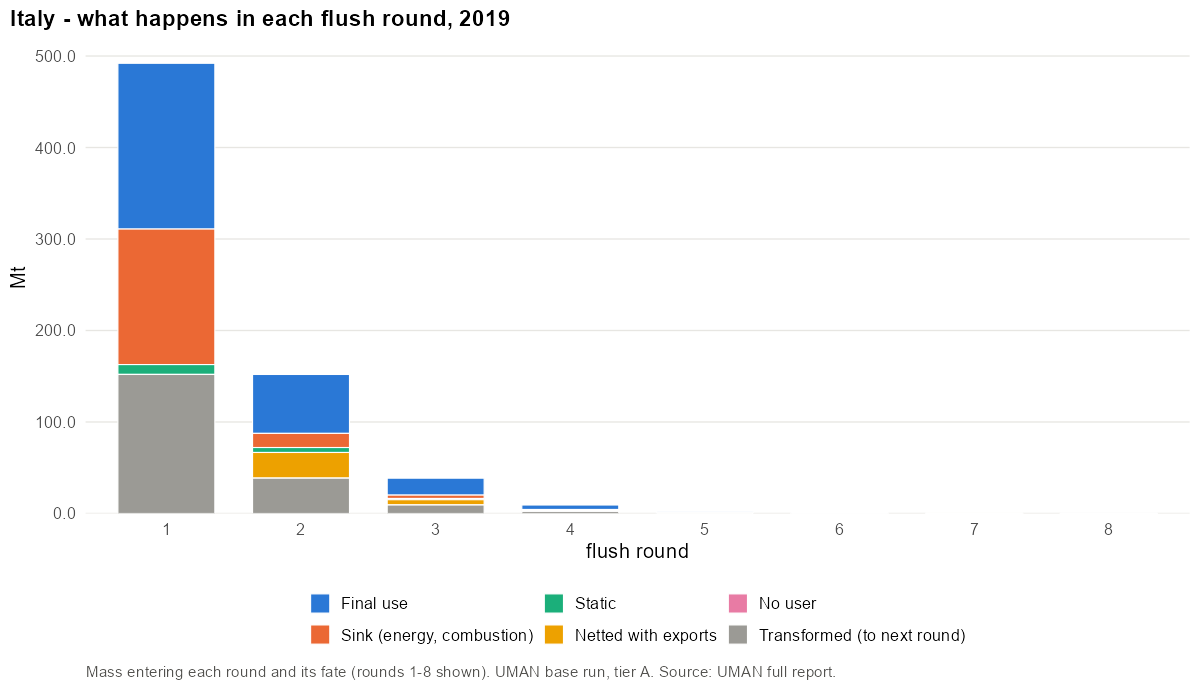
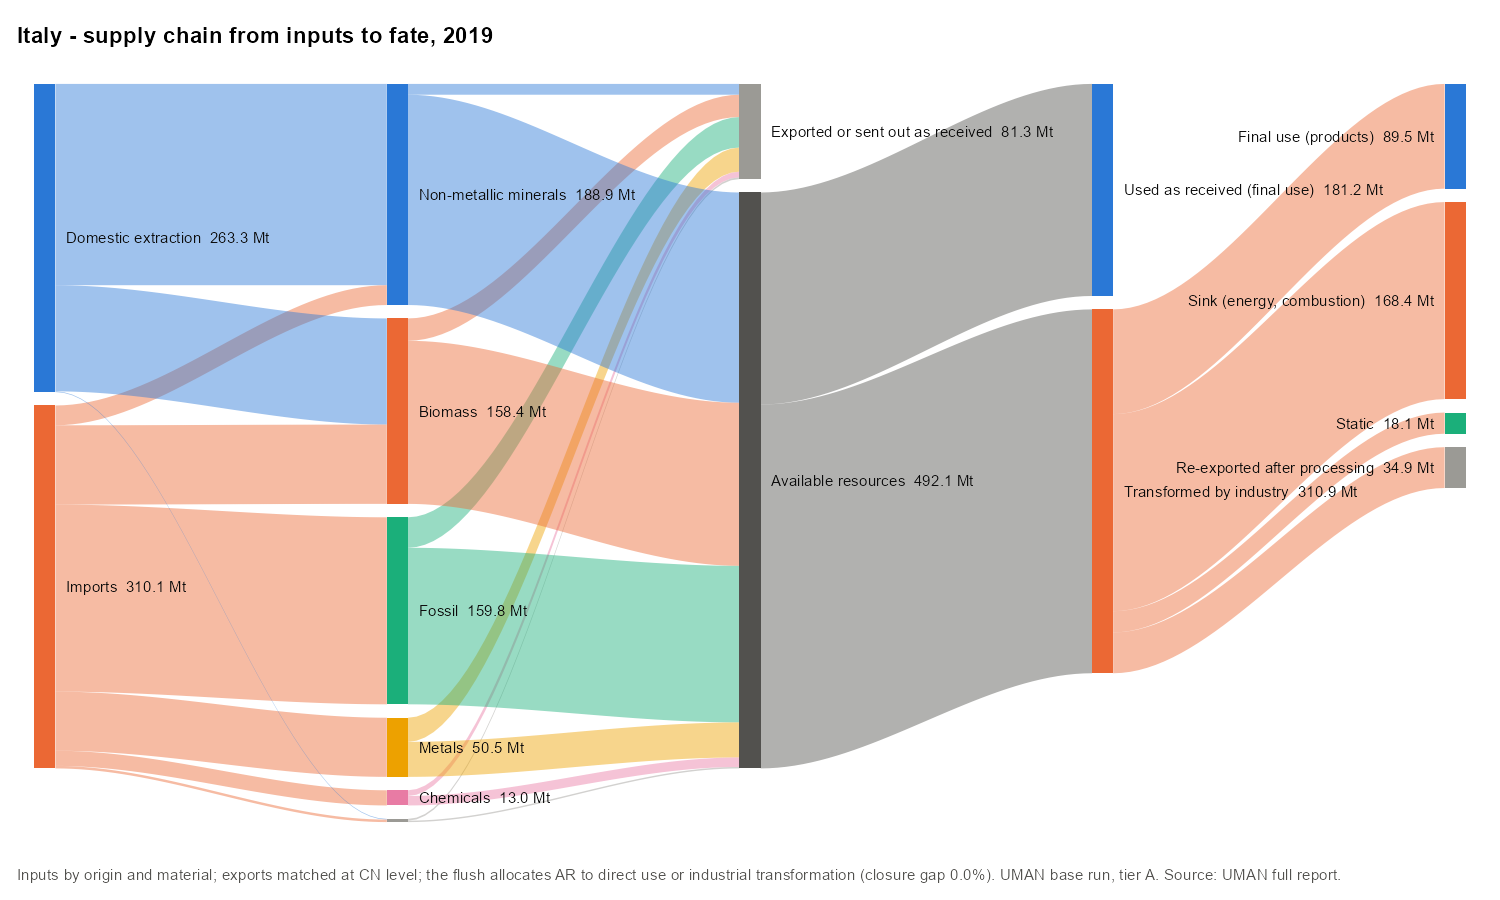
The flush needed 10 rounds. Round 1 handled 492.1 Mt; 31% of it was transformed into other products and re-entered round 2.
Domestic material consumption
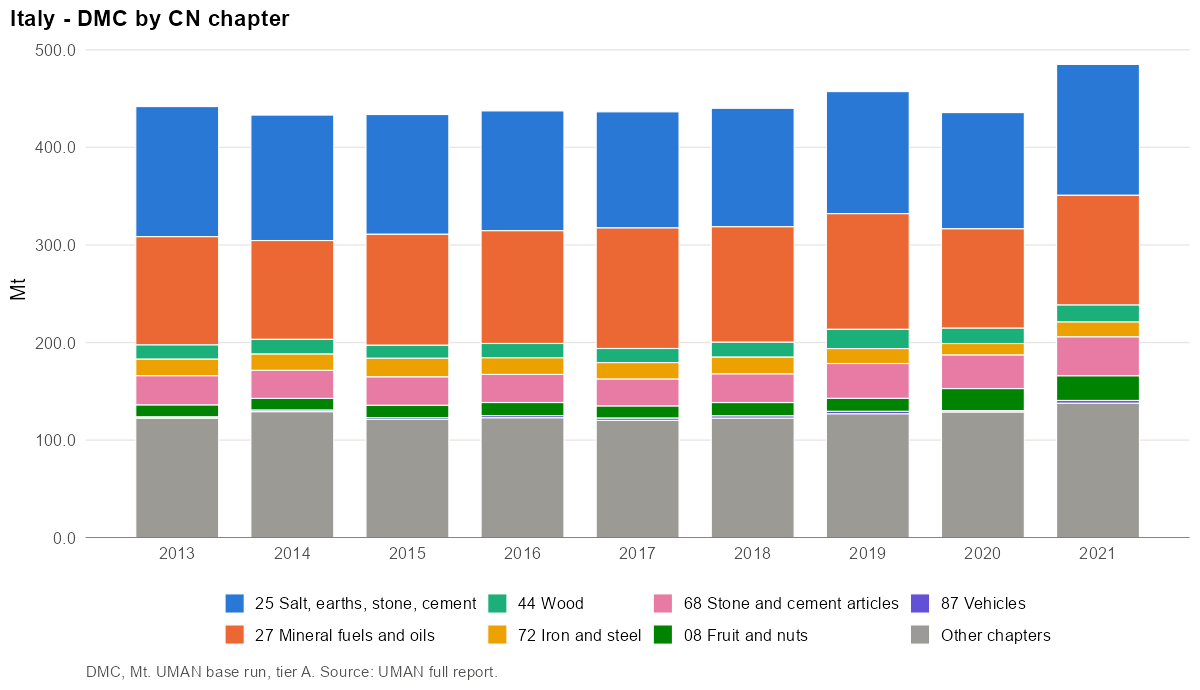
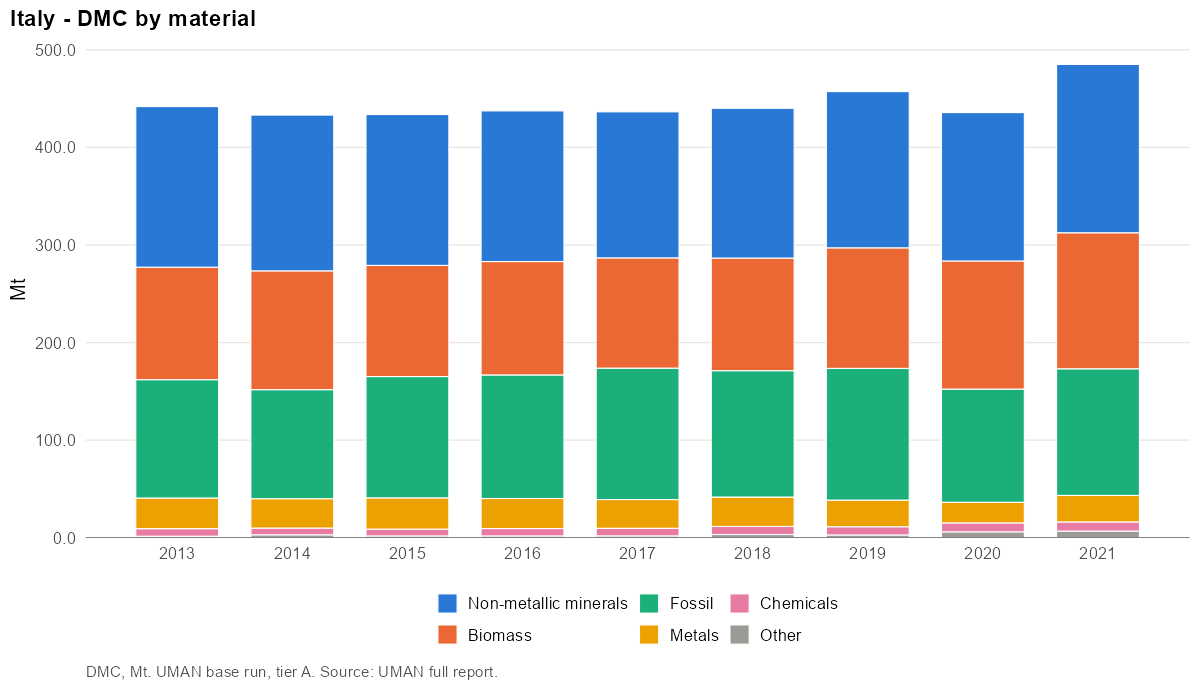
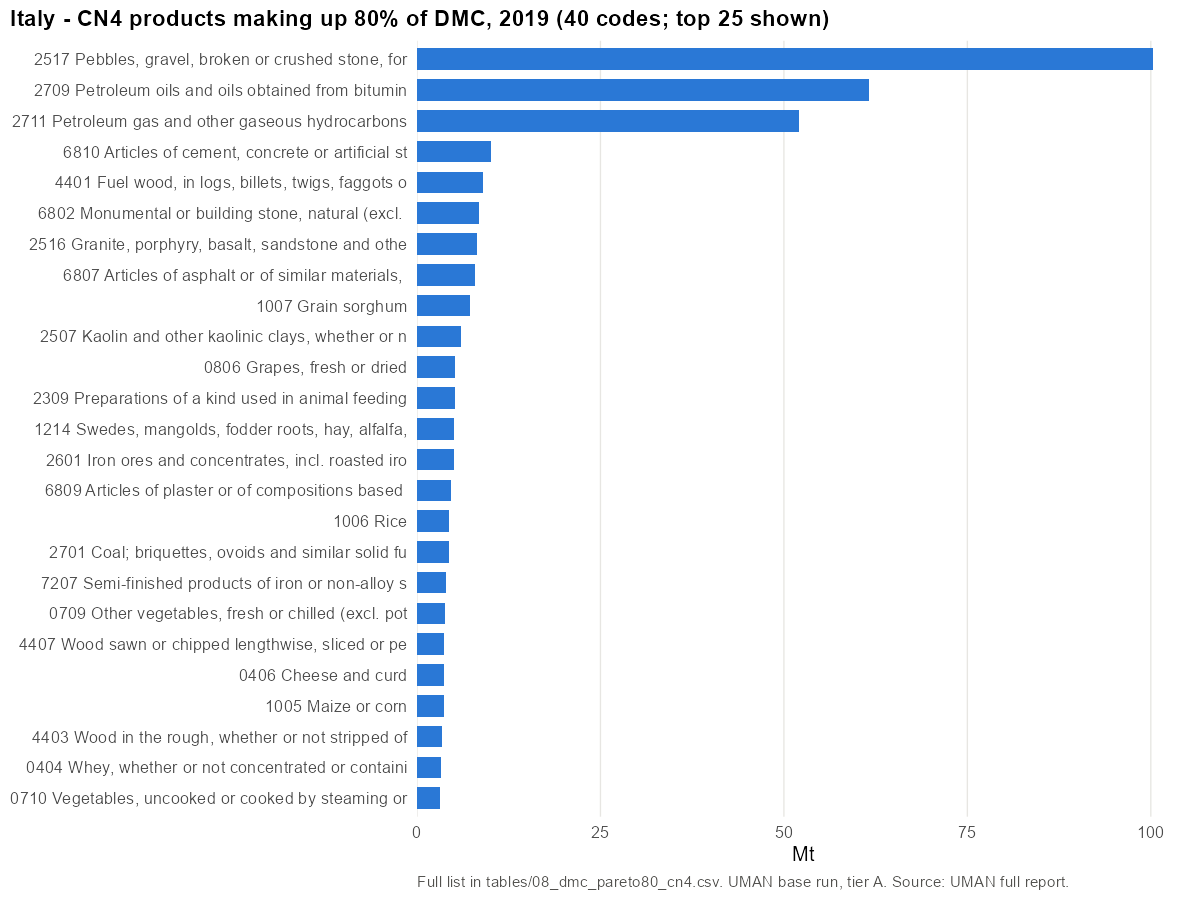
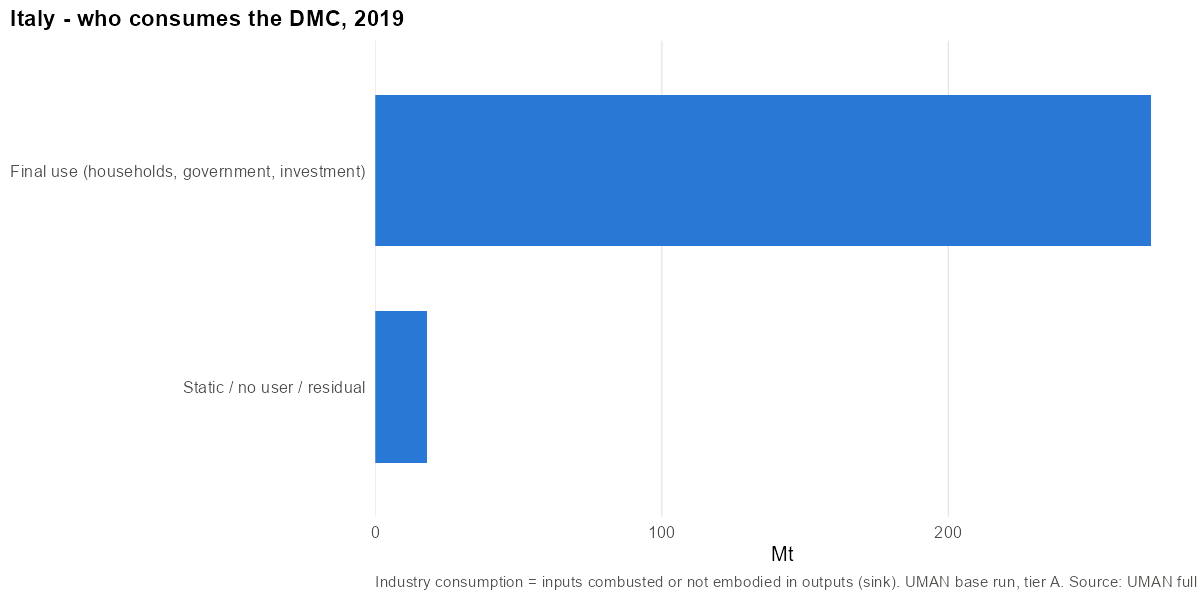
- Main CN4 codes (2019): 2517 Pebbles, gravel, broken or crushed stone, for concrete… (22%); 2709 Petroleum oils and oils obtained from bituminous minerals… (13%); 2711 Petroleum gas and other gaseous hydrocarbons (11%); 6810 Articles of cement, concrete or artificial stone, whether… (2%); 4401 Fuel wood, in logs, billets, twigs, faggots or similar… (2%).
- Main materials: Stone (22%); Agriculture biomass (14%); Fuels (9%).
40 CN4 codes make up 80% of DMC in 2019. Top 10:
| Rank | CN4 | Product | Mt | Share | Cumulative |
|---|---|---|---|---|---|
| 1 | 2517 | Pebbles, gravel, broken or crushed stone, for concrete… | 100.28 | 21.9% | 22% |
| 2 | 2709 | Petroleum oils and oils obtained from bituminous minerals… | 61.66 | 13.5% | 35% |
| 3 | 2711 | Petroleum gas and other gaseous hydrocarbons | 52.08 | 11.4% | 47% |
| 4 | 6810 | Articles of cement, concrete or artificial stone, whether… | 10.14 | 2.2% | 49% |
| 5 | 4401 | Fuel wood, in logs, billets, twigs, faggots or similar… | 9.04 | 2.0% | 51% |
| 6 | 6802 | Monumental or building stone, natural (excl. slate)… | 8.46 | 1.9% | 53% |
| 7 | 2516 | Granite, porphyry, basalt, sandstone and other monumental… | 8.23 | 1.8% | 55% |
| 8 | 6807 | Articles of asphalt or of similar materials, e.g. petroleum… | 7.94 | 1.7% | 56% |
| 9 | 1007 | Grain sorghum | 7.18 | 1.6% | 58% |
| 10 | 2507 | Kaolin and other kaolinic clays, whether or not calcined | 5.95 | 1.3% | 59% |
Metrics
| Year | DMC/cap | AR/cap | DE/cap | Import dep. | Intl import dep. | Self-suff. | Export int. |
|---|---|---|---|---|---|---|---|
| 2013 | 7.3 | 6.9 | 4.3 | 53% | 53% | 59% | 25% |
| 2014 | 7.2 | 6.8 | 4.3 | 52% | 52% | 59% | 24% |
| 2015 | 7.2 | 6.7 | 4.1 | 55% | 55% | 57% | 26% |
| 2016 | 7.3 | 6.8 | 4.1 | 55% | 55% | 57% | 27% |
| 2017 | 7.3 | 6.8 | 4.0 | 57% | 57% | 55% | 27% |
| 2018 | 7.3 | 6.9 | 4.1 | 56% | 56% | 55% | 26% |
| 2019 | 7.6 | 7.2 | 4.4 | 54% | 54% | 58% | 25% |
| 2020 | 7.3 | 6.9 | 4.5 | 50% | 50% | 62% | 24% |
| 2021 | 8.2 | 7.8 | 5.0 | 51% | 51% | 62% | 24% |
Bolzano / South Tyrol (ITH10)
Italy · NUTS 2 = NUTS 3 · code ITH10 · tier A · years 2013–2021
Findings
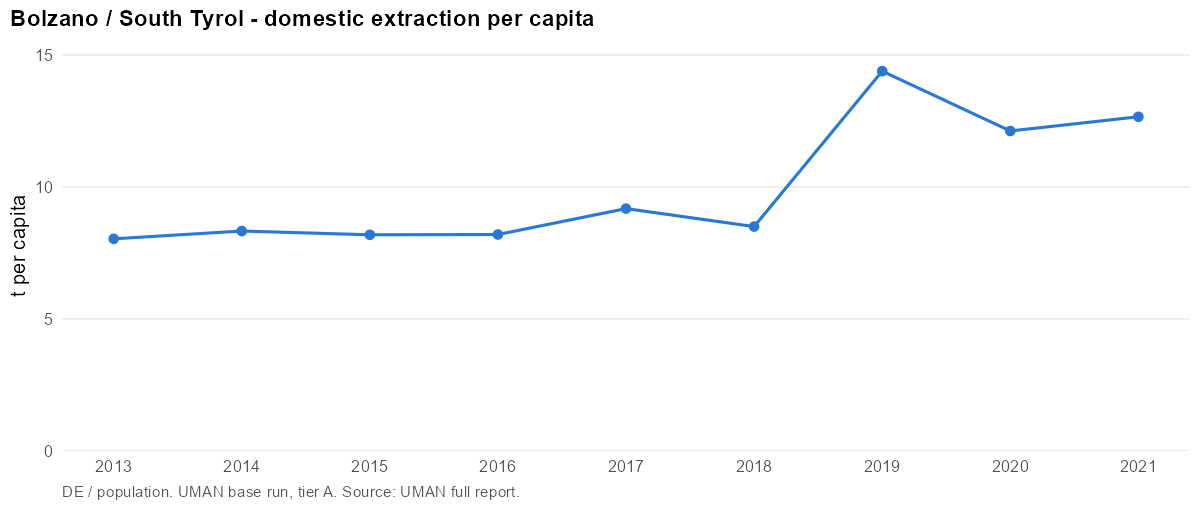
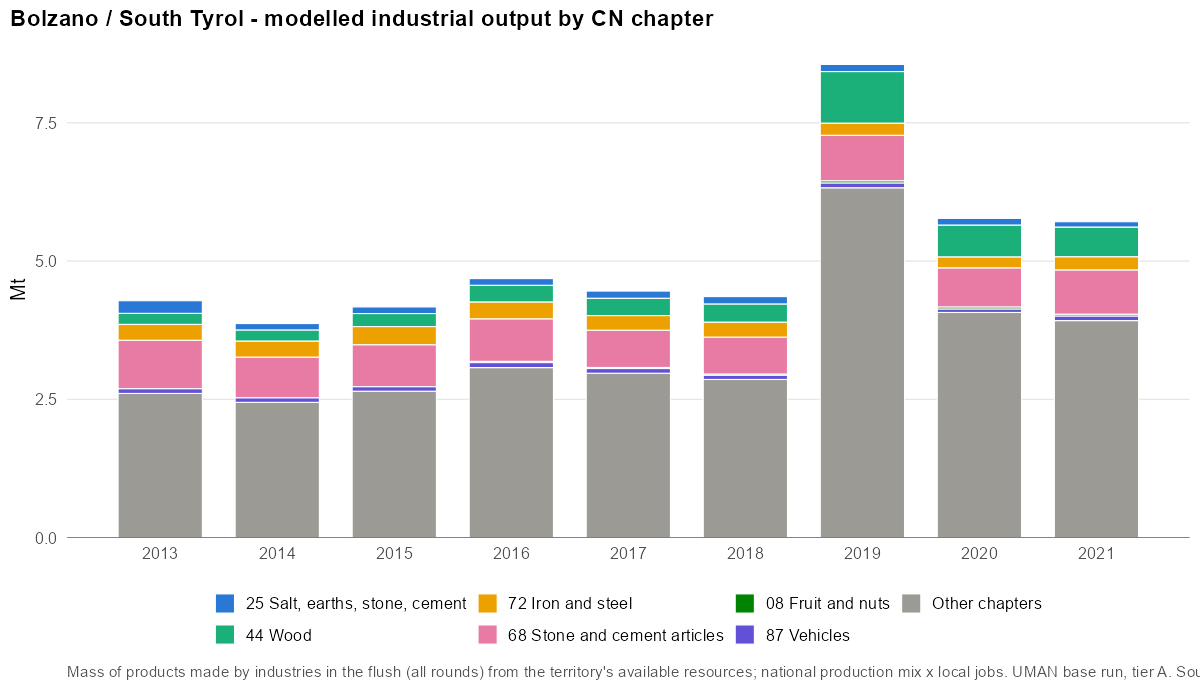
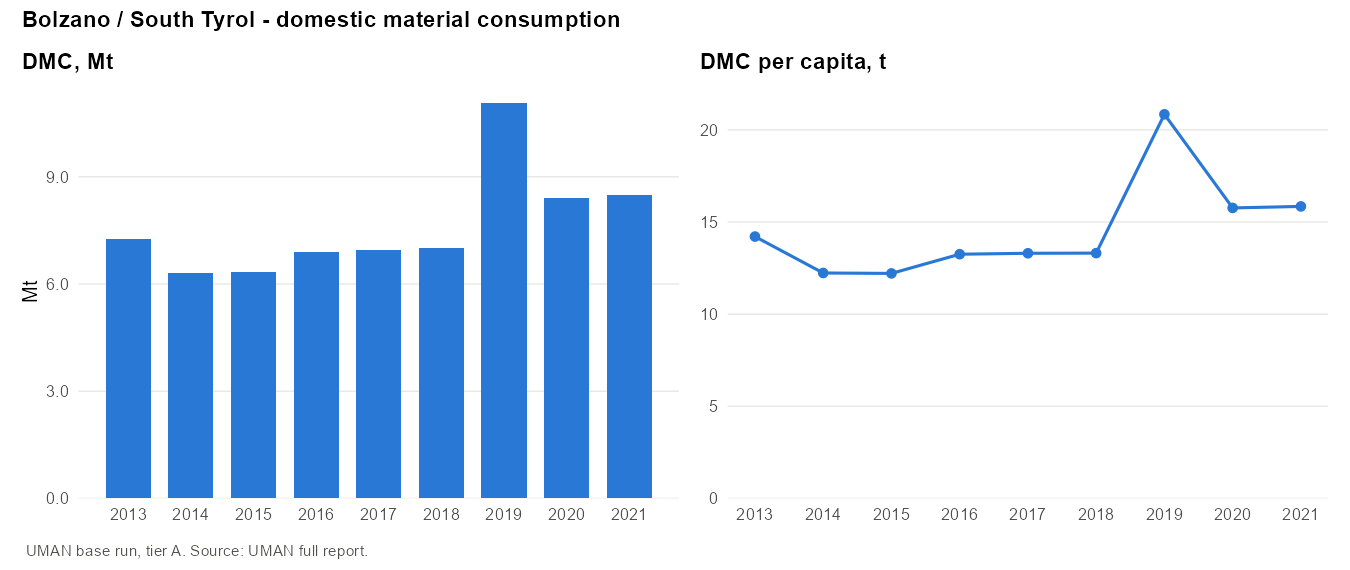
- DMC is 11.1 Mt or 20.8 t/cap in 2019, 2.7 times the Italian level. 2019 is the peak of the series (12.2–15.8 t/cap in other years). It is driven by the Vaia storm windthrow, which added about 3 Mt of roundwood to DE.
- Bolzano is a biomass economy: biomass is 52% of DMC, the only territory where it leads. DE is 7.6 Mt: roundwood 31%, apples 26%, crushed stone 23%.
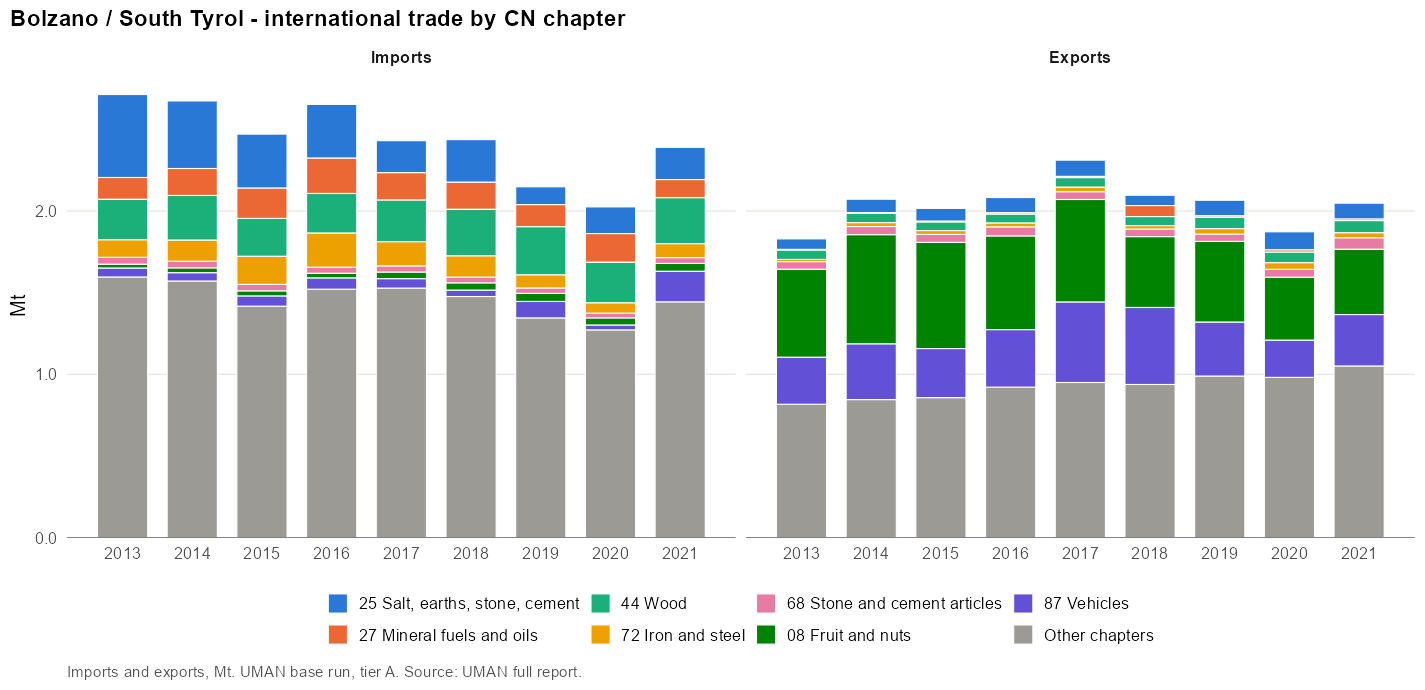
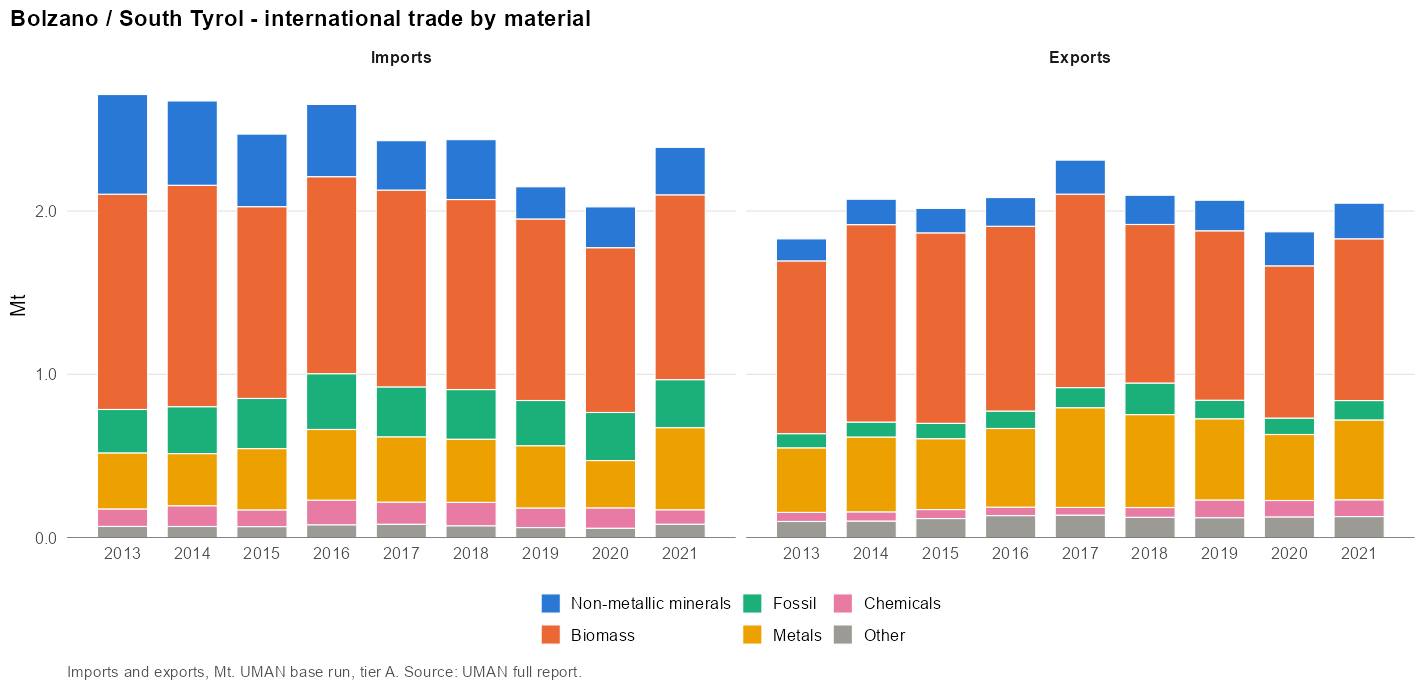
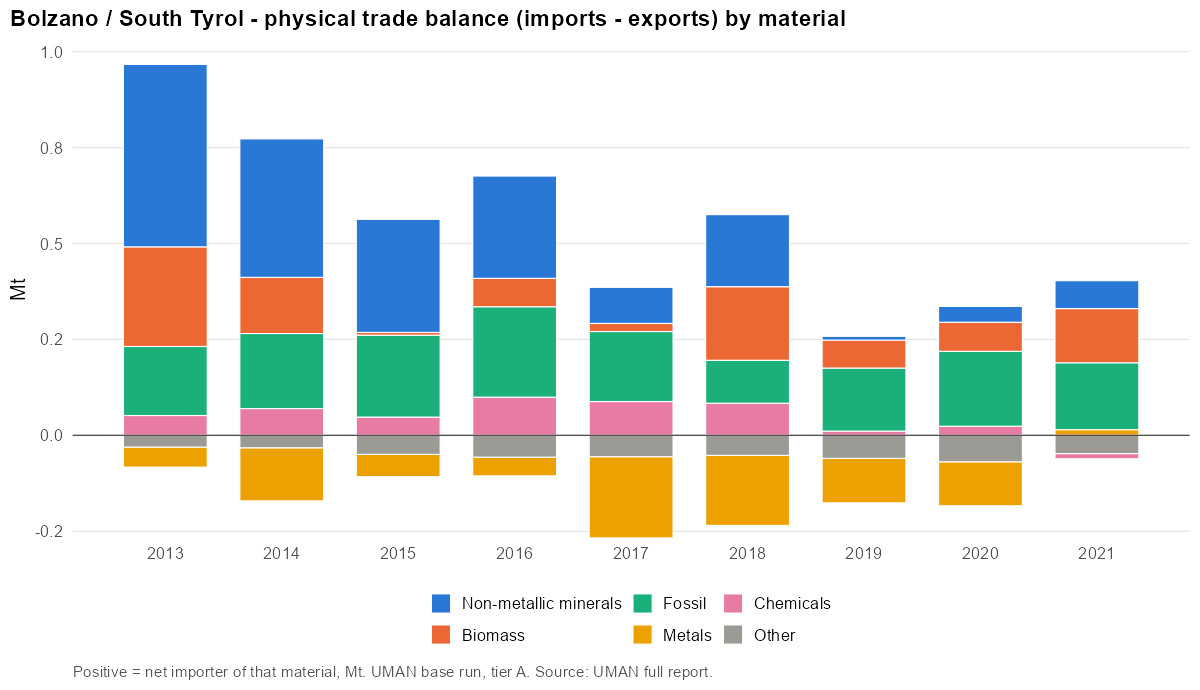
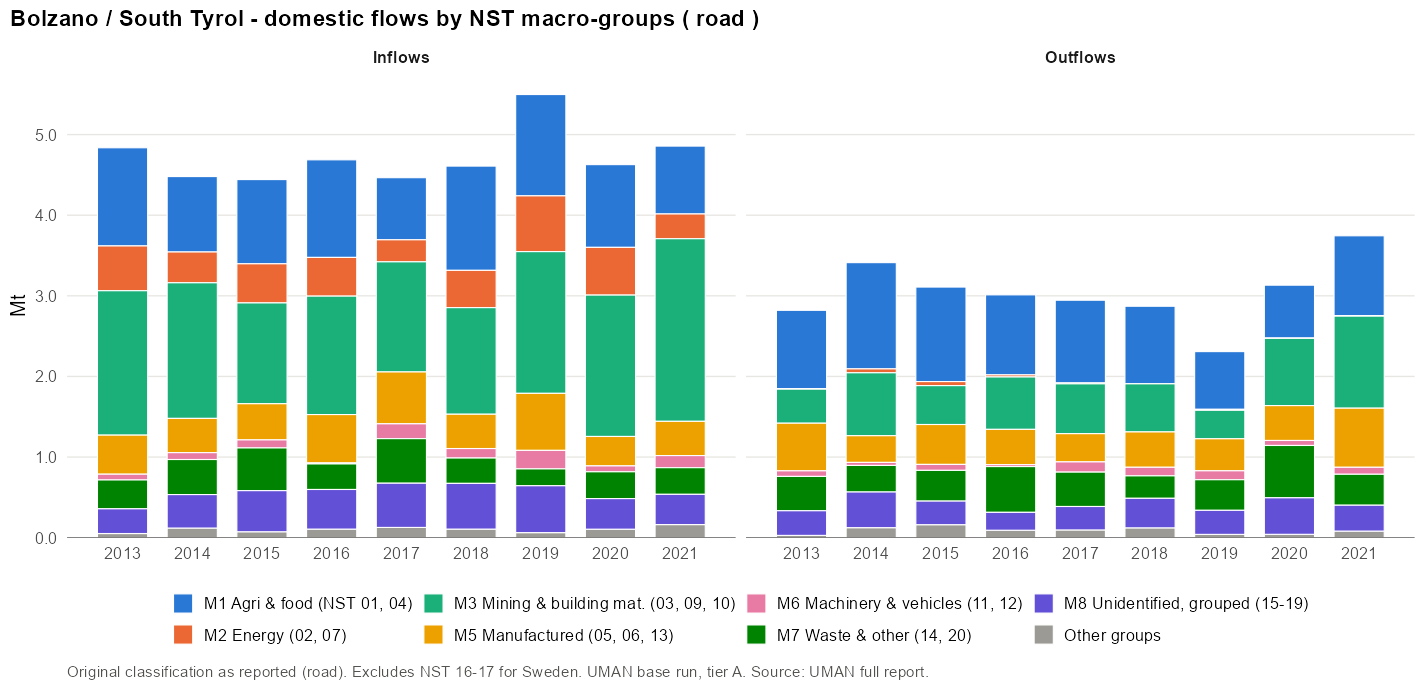
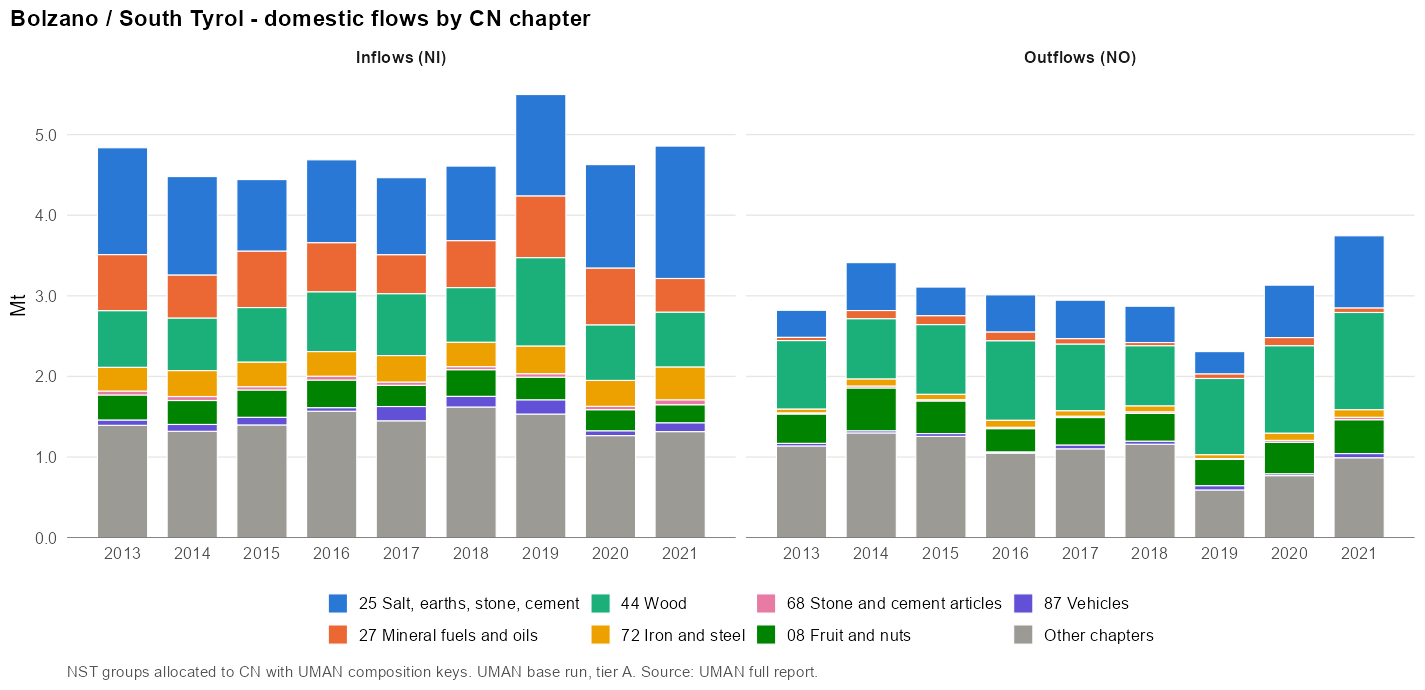
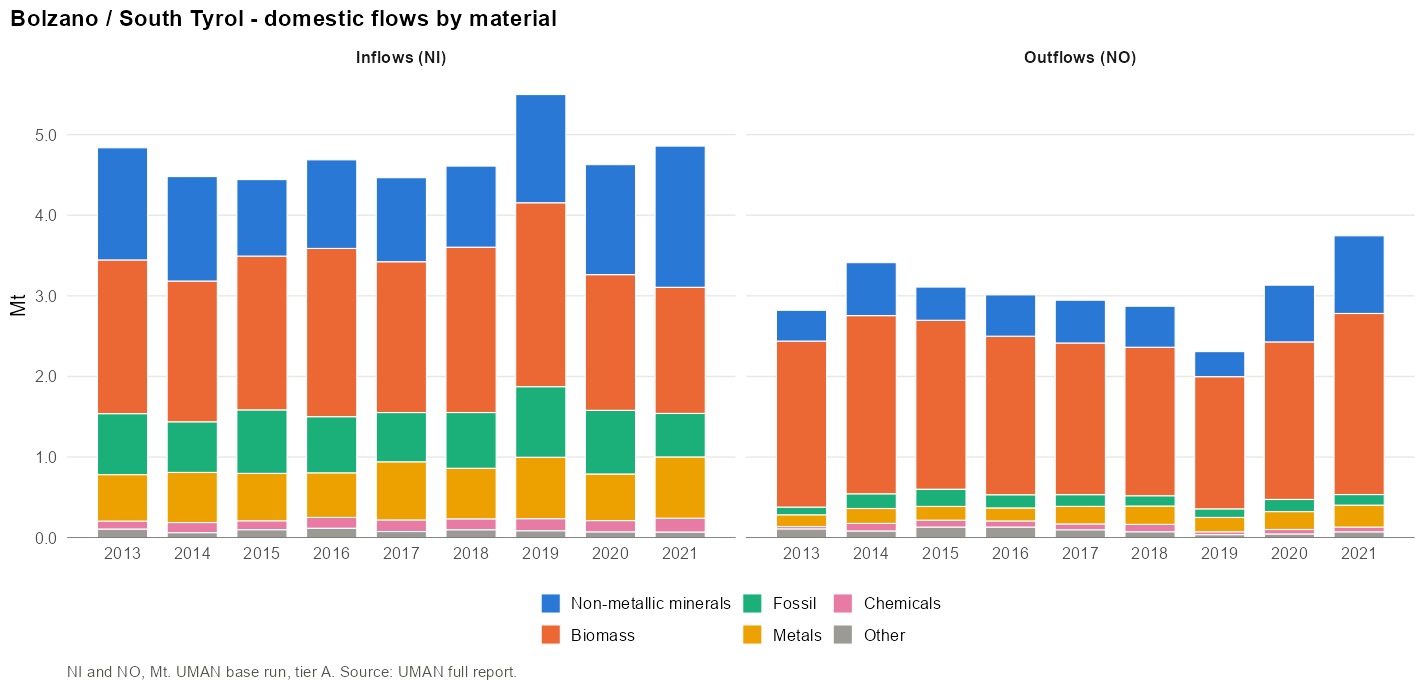
- Domestic flows matter more than international trade: 5.5 Mt arrive from the rest of Italy (crushed stone, roundwood, gas) and 2.3 Mt leave (roundwood, fuel wood, apples). International trade is small and balanced (2.1 Mt each way); apples (20%) and vehicle parts (12%) lead exports. International import dependency is 22%.
- DMC is spread over many products: 36 CN4 codes make up 80%. Crushed stone (18%) and apples (12%) lead.
- Employment points to tourism: accommodation is the largest NACE division (13% of persons employed).
- Caveats: trade tonnes are estimated from € values; the use structure is borrowed from Portugal; rail on the Brenner corridor is missing. The unbalanced share is low (1.3%).
Overview
| 2013 | 2019 | 2021 | |
|---|---|---|---|
| Population | 511 619 | 530 313 | 534 912 |
| DE (Mt) | 4.1 | 7.6 | 6.8 |
| Imports M (Mt) | 2.7 | 2.1 | 2.4 |
| Exports X (Mt) | 1.8 | 2.1 | 2.0 |
| Domestic in NI (Mt) | 4.8 | 5.5 | 4.9 |
| Domestic out NO (Mt) | 2.8 | 2.3 | 3.7 |
| AR (Mt) | 7.0 | 10.9 | 8.2 |
| DMC (Mt) | 7.3 | 11.1 | 8.5 |
| DMC (t/cap) | 14.2 | 20.8 | 15.8 |
| Unbalanced (% of gross AR) | 3.3% | 1.3% | 2.8% |
Domestic extraction
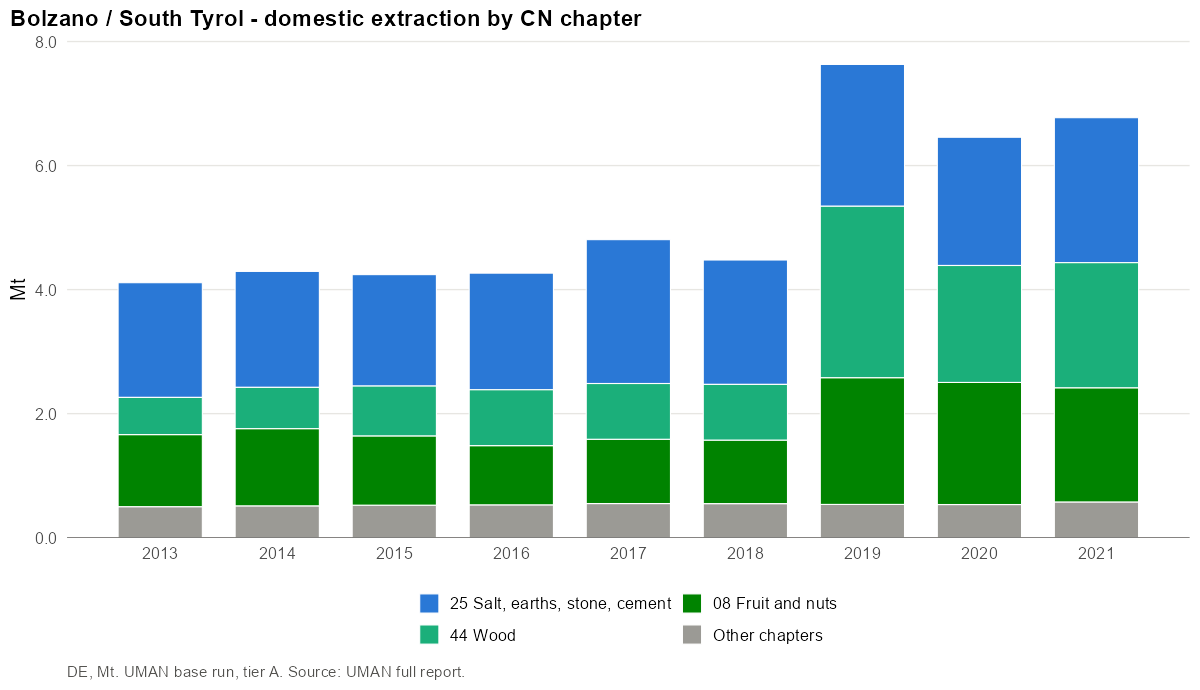
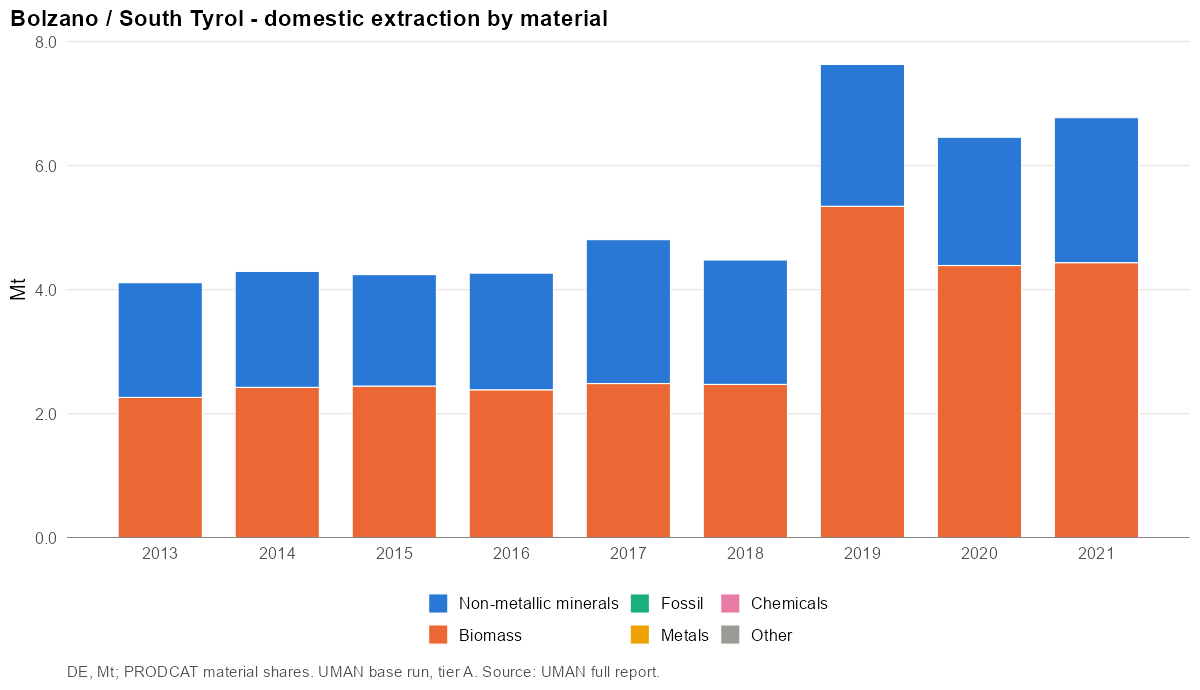
- Main CN4 codes (2019): 4403 Wood in the rough, whether or not stripped of bark or… (31%); 0808 Apples, pears and quinces, fresh (26%); 2517 Pebbles, gravel, broken or crushed stone, for concrete… (23%); 0401 Milk and cream, not concentrated nor containing added sugar… (6%); 4401 Fuel wood, in logs, billets, twigs, faggots or similar… (5%).
- Main materials: Wood and wood fuels (36%); Agriculture biomass (27%); Stone (23%).
International trade
Imports:
- Main CN4 codes (2019): 1701 Cane or beet sugar and chemically pure sucrose, in solid… (10%); 4401 Fuel wood, in logs, billets, twigs, faggots or similar… (4%); 2703 Peat, incl. peat litter, whether or not agglomerated (4%); 1001 Wheat and meslin (3%); 3824 Prepared binders for foundry moulds or cores; chemical… (3%).
- Main materials: Agriculture biomass (15%); Iron, steel and ferro-alloys (15%); Wood and wood fuels (14%).
Exports:
- Main CN4 codes (2019): 0808 Apples, pears and quinces, fresh (20%); 8708 Parts and accessories for tractors, motor vehicles for the… (12%); 2009 Fruit juices, incl. grape must, and vegetable juices… (6%); 2204 Wine of fresh grapes, incl. fortified wines; grape must… (5%); 1905 Bread, pastry, cakes, biscuits and other bakers' wares… (4%).
- Main materials: Agriculture biomass (35%); Iron, steel and ferro-alloys (20%); Stone (6%).
Domestic movement of goods
Inflows:
- Main CN4 codes (2019): 2517 Pebbles, gravel, broken or crushed stone, for concrete… (17%); 4403 Wood in the rough, whether or not stripped of bark or… (15%); 2711 Petroleum gas and other gaseous hydrocarbons (5%); 4401 Fuel wood, in logs, billets, twigs, faggots or similar… (4%); 4703 Chemical wood pulp, soda or sulphate (excl. dissolving… (3%).
- Main materials: Wood and wood fuels (23%); Stone (15%); Agriculture biomass (13%).
Outflows:
- Main CN4 codes (2019): 4403 Wood in the rough, whether or not stripped of bark or… (21%); 4401 Fuel wood, in logs, billets, twigs, faggots or similar… (18%); 0808 Apples, pears and quinces, fresh (13%); 2517 Pebbles, gravel, broken or crushed stone, for concrete… (8%); 0401 Milk and cream, not concentrated nor containing added sugar… (3%).
- Main materials: Wood and wood fuels (41%); Agriculture biomass (17%); Stone (9%).
Available resources
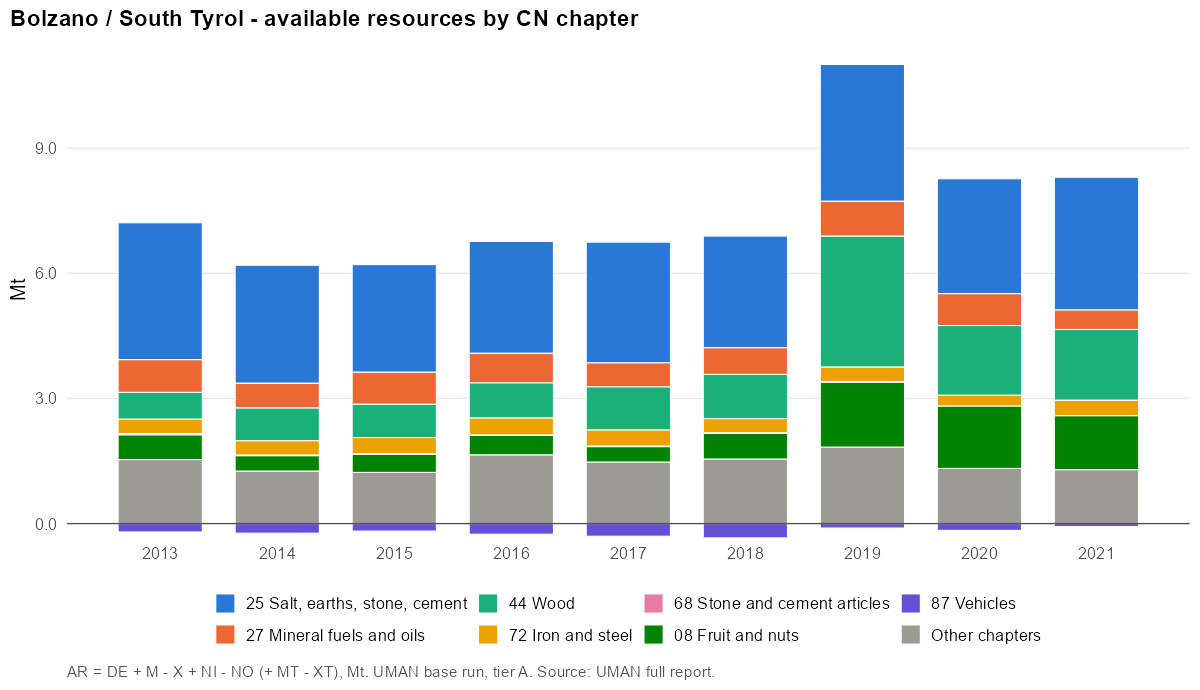
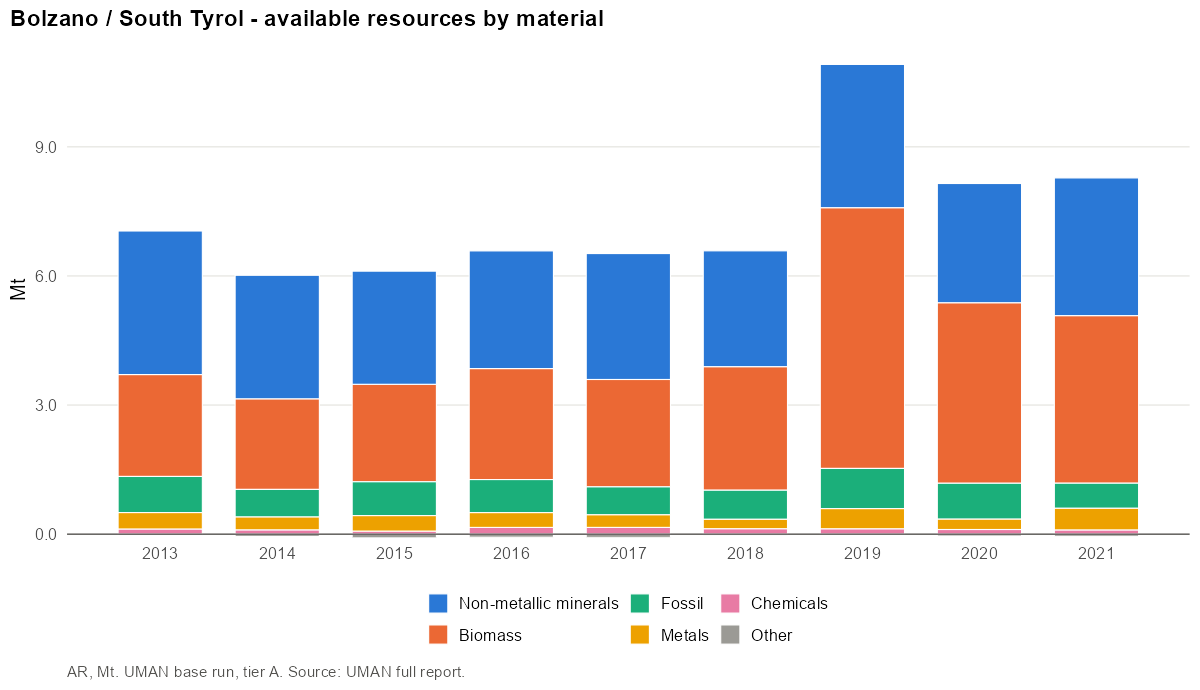
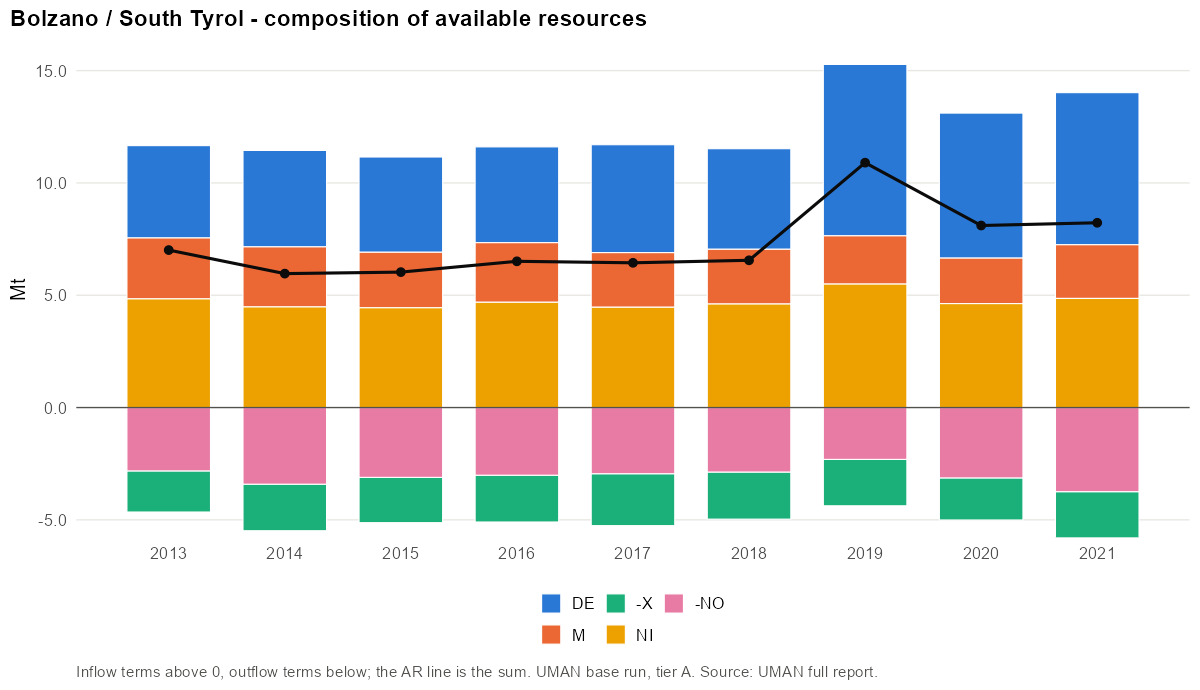
- Main CN4 codes (2019): 4403 Wood in the rough, whether or not stripped of bark or… (25%); 2517 Pebbles, gravel, broken or crushed stone, for concrete… (22%); 0808 Apples, pears and quinces, fresh (13%); 0401 Milk and cream, not concentrated nor containing added sugar… (4%); 2516 Granite, porphyry, basalt, sandstone and other monumental… (3%).
- Main materials: Wood and wood fuels (30%); Stone (21%); Agriculture biomass (18%).
Industrial production
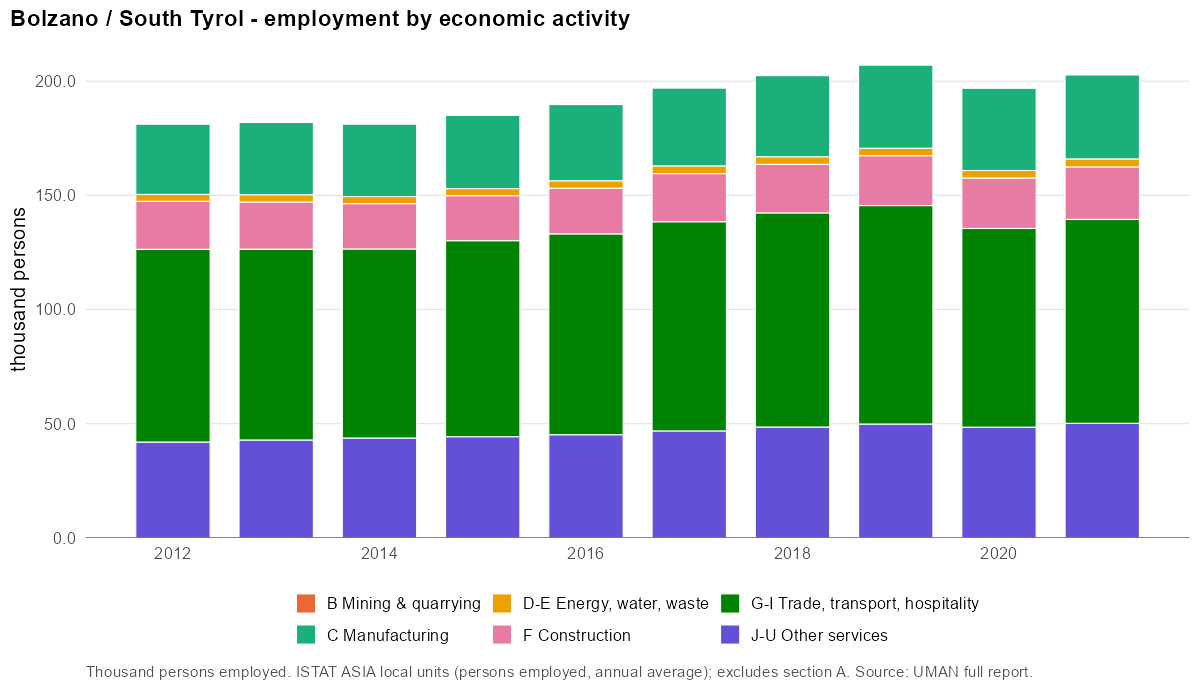
Largest employers (NACE divisions):
| NACE | Activity | Persons | Share |
|---|---|---|---|
| 55 | Accommodation | 27 444 | 13.2% |
| 46 | Wholesale trade, except of motor vehicles and motorcycles | 19 960 | 9.6% |
| 47 | Retail trade, except of motor vehicles and motorcycles | 19 168 | 9.2% |
| 56 | Food and beverage service activities | 15 346 | 7.4% |
| 43 | Specialised construction activities | 15 170 | 7.3% |
| 49 | Land transport and transport via pipelines | 7 519 | 3.6% |
| 10 | Manufacture of food products | 6 984 | 3.4% |
| 81 | Services to buildings and landscape activities | 5 578 | 2.7% |
Product transformation
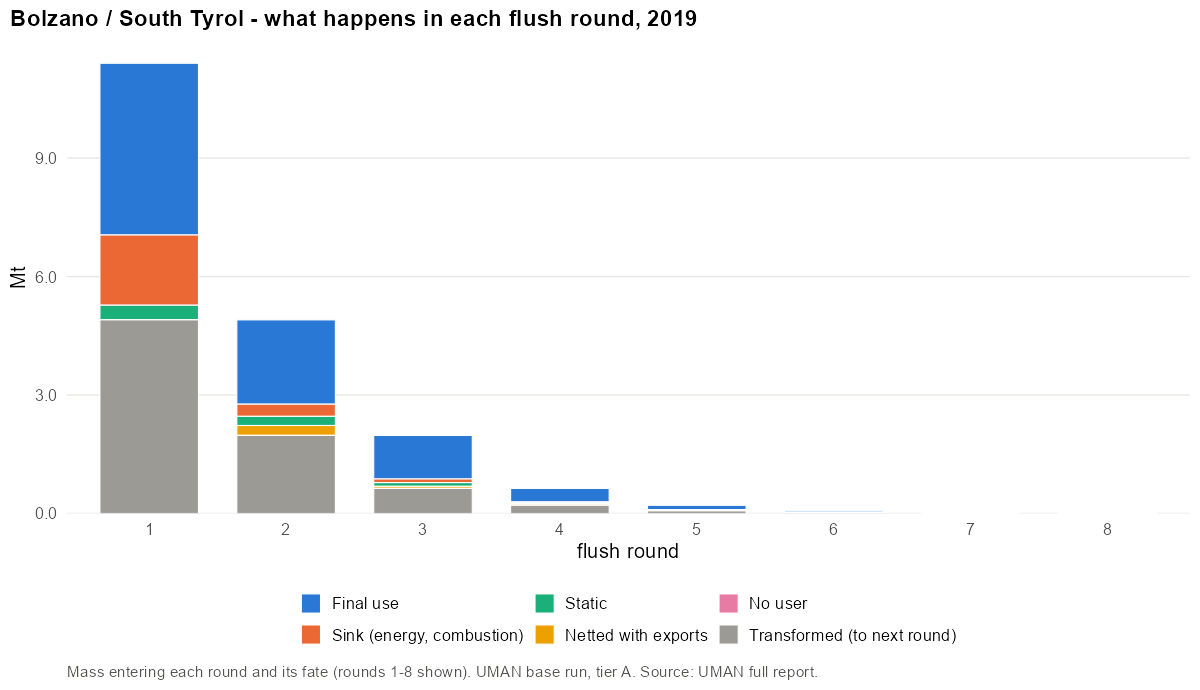
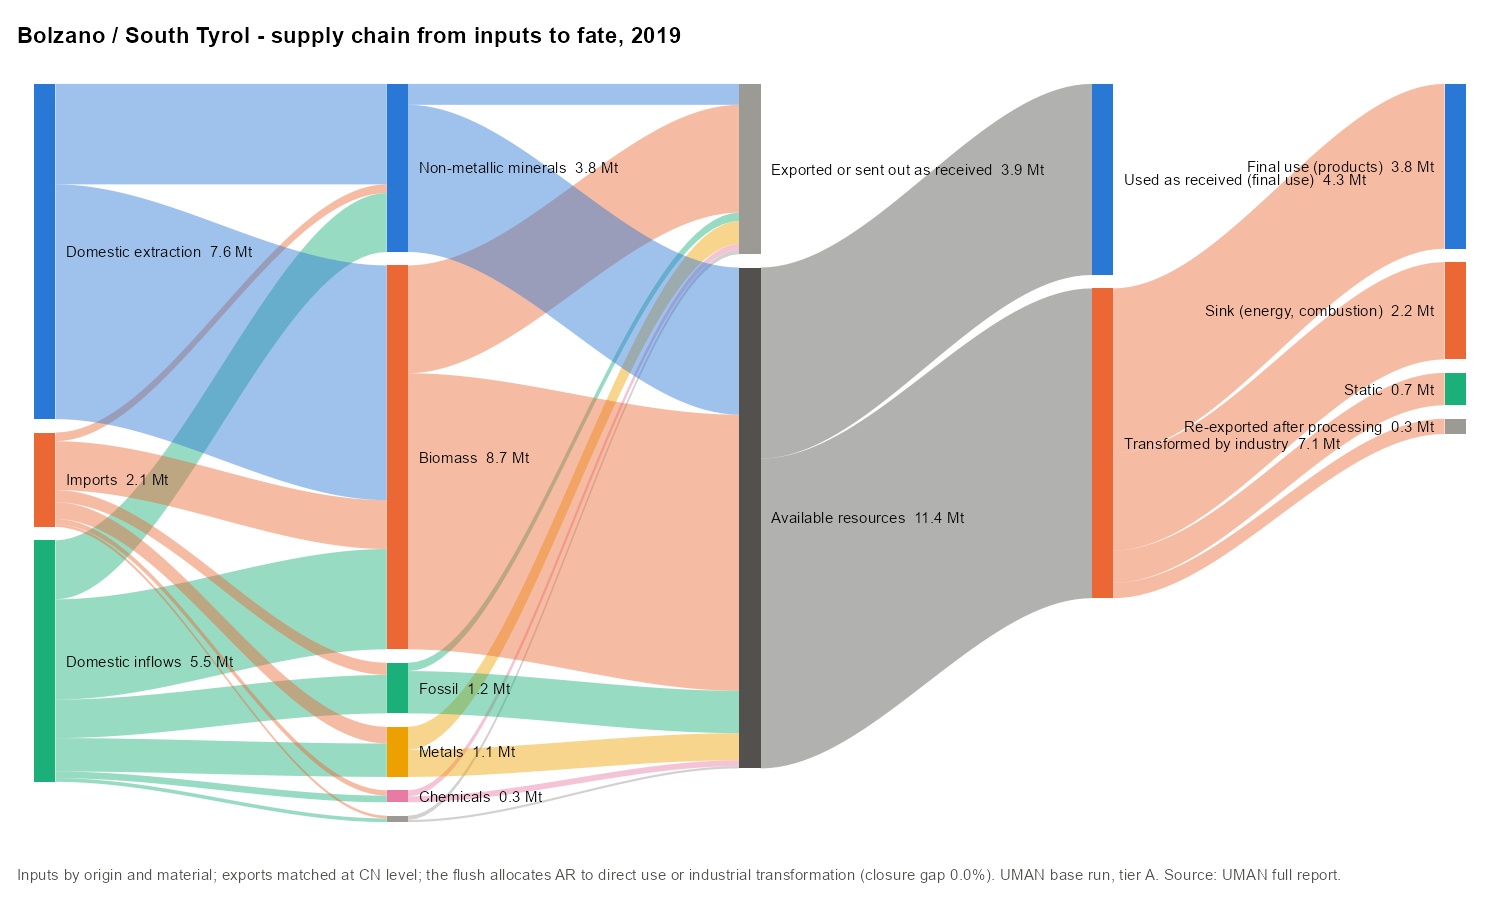
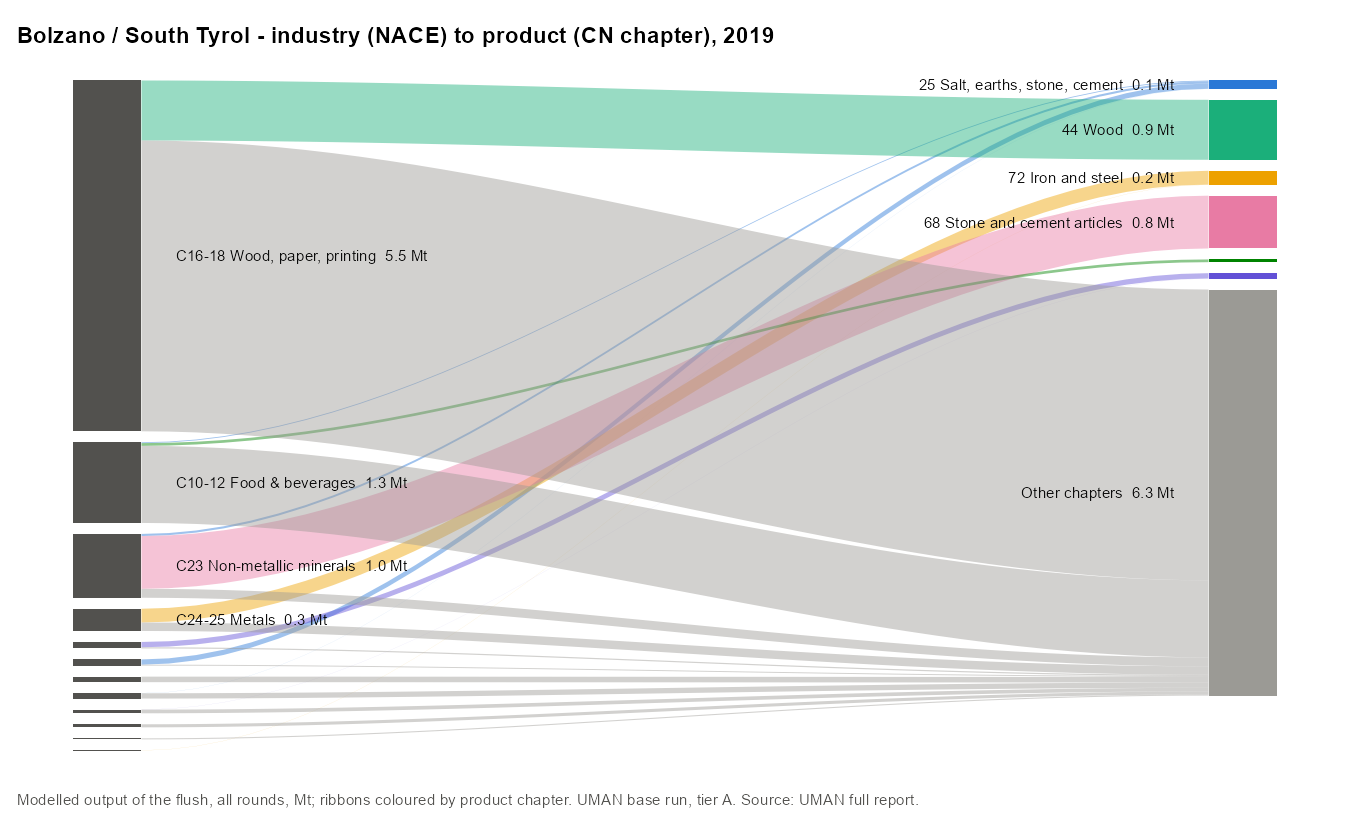
The flush needed 13 rounds. Round 1 handled 11.4 Mt; 43% of it was transformed into other products and re-entered round 2.
Domestic material consumption
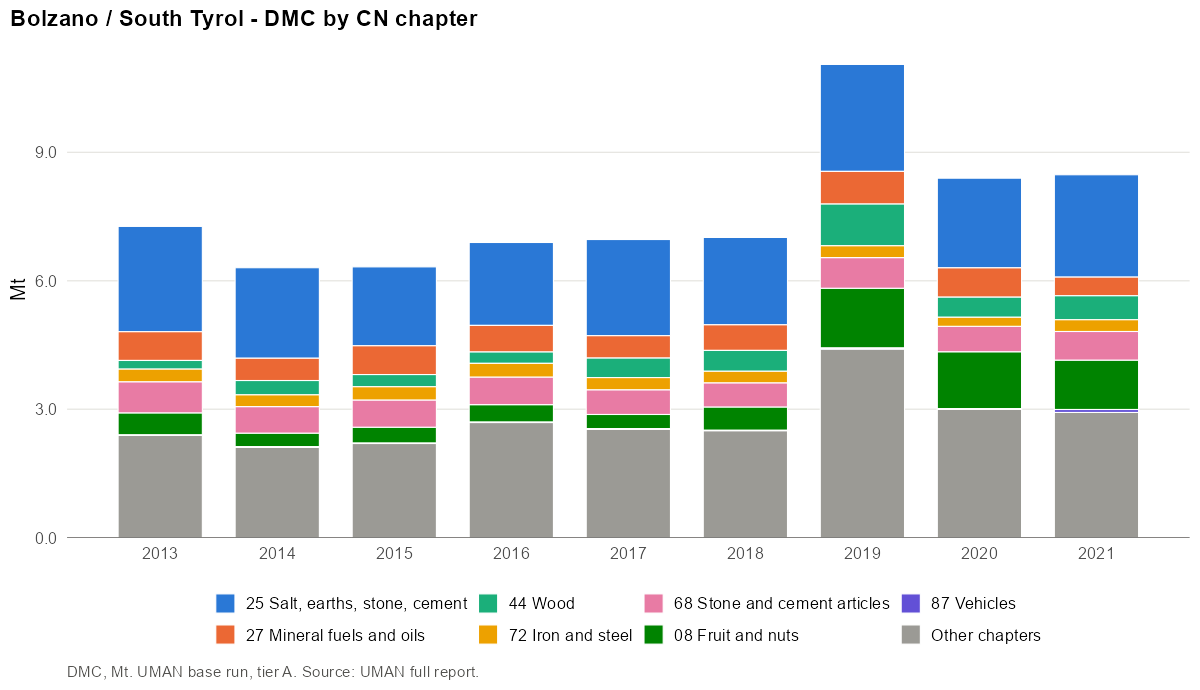
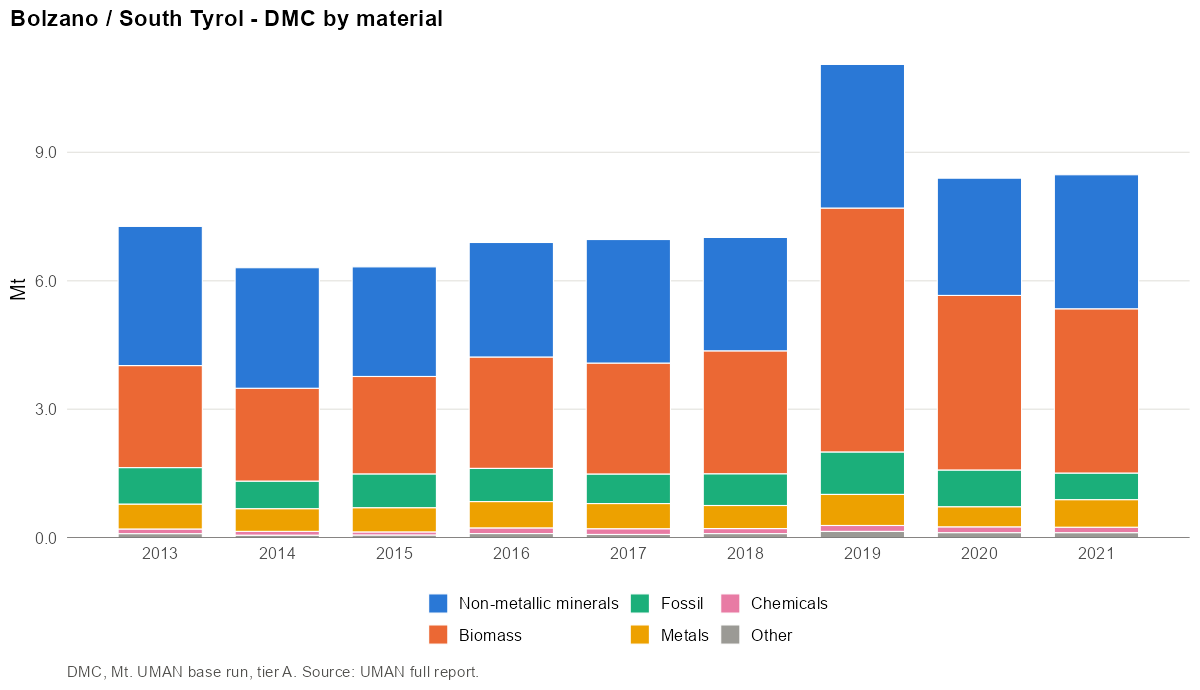
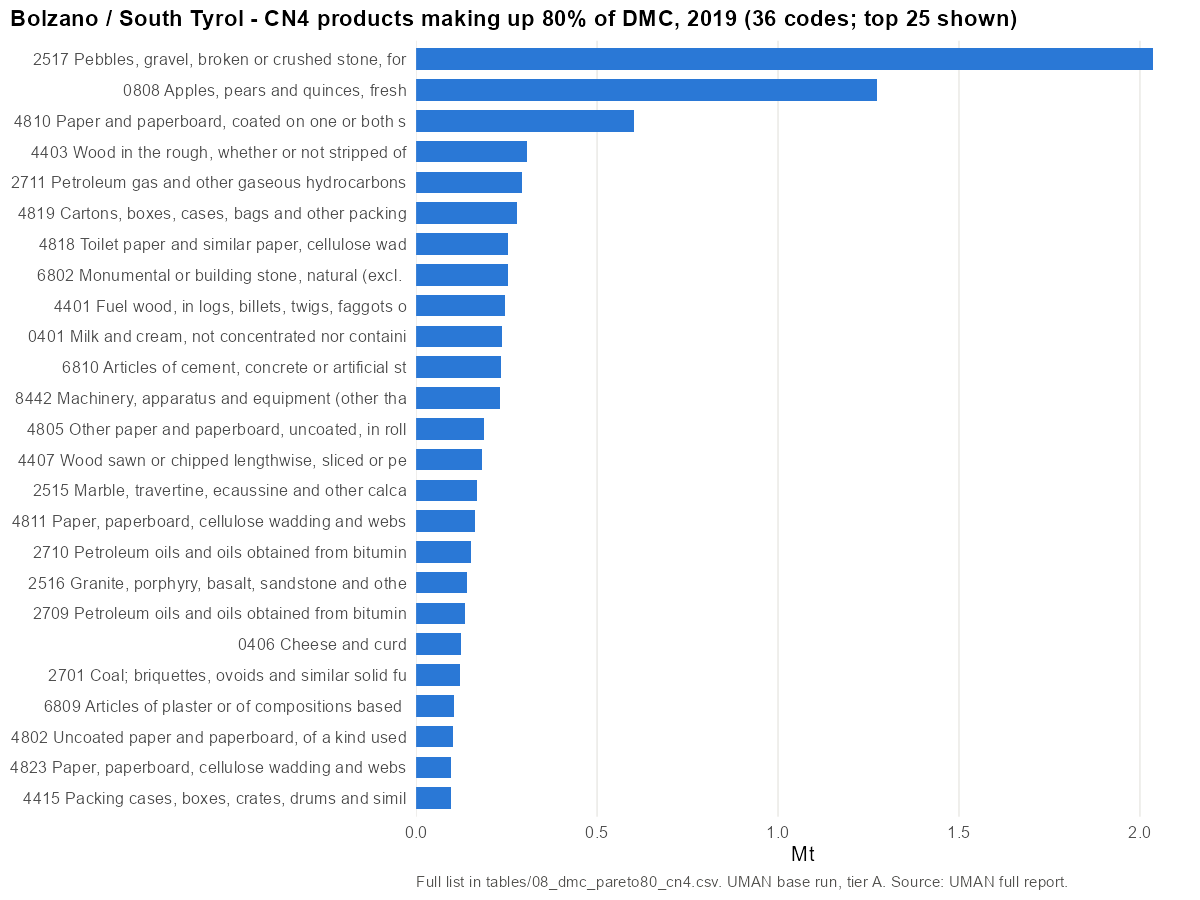
- Main CN4 codes (2019): 2517 Pebbles, gravel, broken or crushed stone, for concrete… (18%); 0808 Apples, pears and quinces, fresh (12%); 4810 Paper and paperboard, coated on one or both sides with… (5%); 4403 Wood in the rough, whether or not stripped of bark or… (3%); 2711 Petroleum gas and other gaseous hydrocarbons (3%).
- Main materials: Stone (21%); Agriculture biomass (18%); Paper and board (17%).
36 CN4 codes make up 80% of DMC in 2019. Top 10:
| Rank | CN4 | Product | Mt | Share | Cumulative |
|---|---|---|---|---|---|
| 1 | 2517 | Pebbles, gravel, broken or crushed stone, for concrete… | 2.04 | 18.4% | 18% |
| 2 | 0808 | Apples, pears and quinces, fresh | 1.27 | 11.5% | 30% |
| 3 | 4810 | Paper and paperboard, coated on one or both sides with… | 0.60 | 5.4% | 35% |
| 4 | 4403 | Wood in the rough, whether or not stripped of bark or… | 0.31 | 2.8% | 38% |
| 5 | 2711 | Petroleum gas and other gaseous hydrocarbons | 0.29 | 2.6% | 41% |
| 6 | 4819 | Cartons, boxes, cases, bags and other packing containers… | 0.28 | 2.5% | 43% |
| 7 | 4818 | Toilet paper and similar paper, cellulose wadding or webs… | 0.25 | 2.3% | 46% |
| 8 | 6802 | Monumental or building stone, natural (excl. slate)… | 0.25 | 2.3% | 48% |
| 9 | 4401 | Fuel wood, in logs, billets, twigs, faggots or similar… | 0.24 | 2.2% | 50% |
| 10 | 0401 | Milk and cream, not concentrated nor containing added sugar… | 0.24 | 2.1% | 52% |
Metrics
| Year | DMC/cap | AR/cap | DE/cap | Import dep. | Intl import dep. | Self-suff. | Export int. |
|---|---|---|---|---|---|---|---|
| 2013 | 14.2 | 13.7 | 8.0 | 65% | 40% | 57% | 40% |
| 2014 | 12.2 | 11.6 | 8.3 | 62% | 38% | 68% | 48% |
| 2015 | 12.2 | 11.6 | 8.2 | 62% | 37% | 67% | 46% |
| 2016 | 13.3 | 12.5 | 8.2 | 63% | 38% | 62% | 44% |
| 2017 | 13.3 | 12.3 | 9.2 | 59% | 34% | 69% | 45% |
| 2018 | 13.3 | 12.4 | 8.5 | 61% | 35% | 64% | 43% |
| 2019 | 20.8 | 20.6 | 14.4 | 50% | 22% | 69% | 29% |
| 2020 | 15.8 | 15.2 | 12.1 | 51% | 24% | 77% | 38% |
| 2021 | 15.8 | 15.4 | 12.7 | 52% | 26% | 80% | 41% |
Rest of Italy (IT - ITH10)
Italy · rest-of · code IT-ITH10 · rest (IT - ITH10) · years 2013–2021
Findings
- The rest of Italy is Italy: Bolzano holds 0.9% of the population. Removing it lowers DMC per capita by 0.1 t (7.5 against 7.6 t/cap in 2019) and leaves composition unchanged (35% non-metallic minerals, 30% fossil, 26% biomass).
- The contrast is the point: a resident of Bolzano consumes 2.8 times as much material as a resident of the rest of Italy.
- Negative cells are negligible (0.07% of DMC).
Overview
| 2013 | 2019 | 2021 | |
|---|---|---|---|
| Population | 59 765 690 | 59 286 360 | 58 701 301 |
| DE (Mt) | 256.1 | 255.7 | 292.1 |
| Imports M (Mt) | 289.7 | 307.9 | 304.1 |
| Exports X (Mt) | 136.6 | 139.6 | 143.5 |
| Domestic in NI (Mt) | – | – | – |
| Domestic out NO (Mt) | – | – | – |
| AR (Mt) | 407.3 | 420.8 | 451.6 |
| DMC (Mt) | 434.5 | 446.1 | 476.5 |
| DMC (t/cap) | 7.3 | 7.5 | 8.1 |
| Unbalanced (% of gross AR) | 5.8% | 5.3% | 4.9% |
Domestic extraction
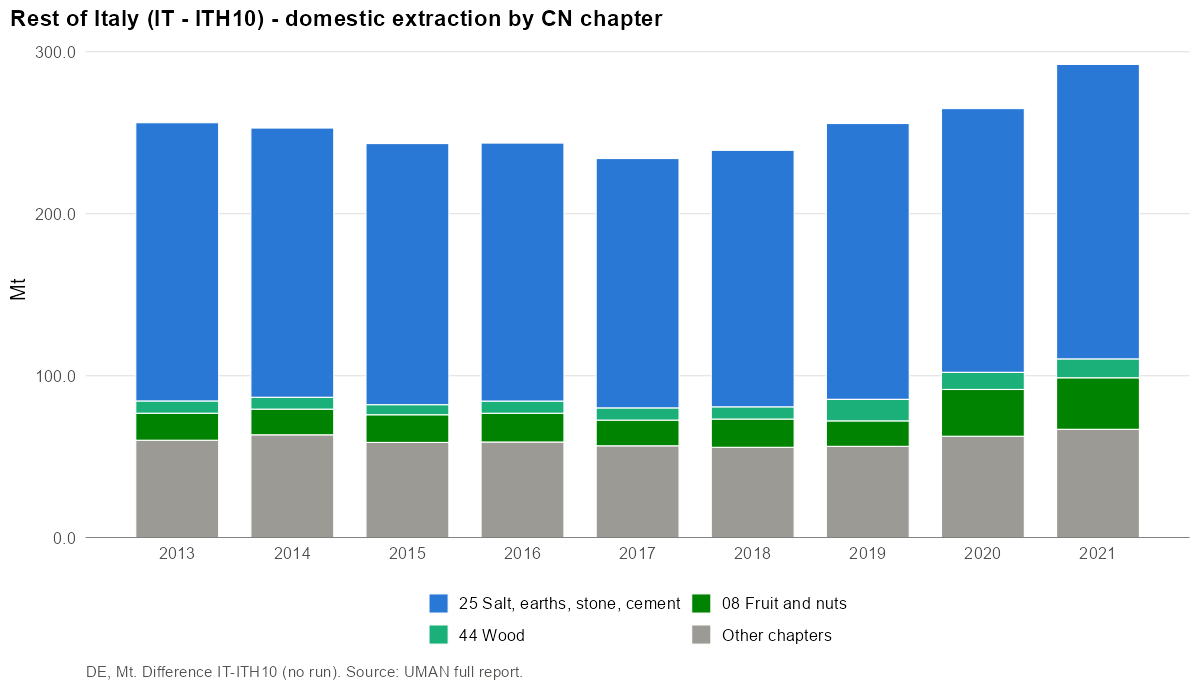
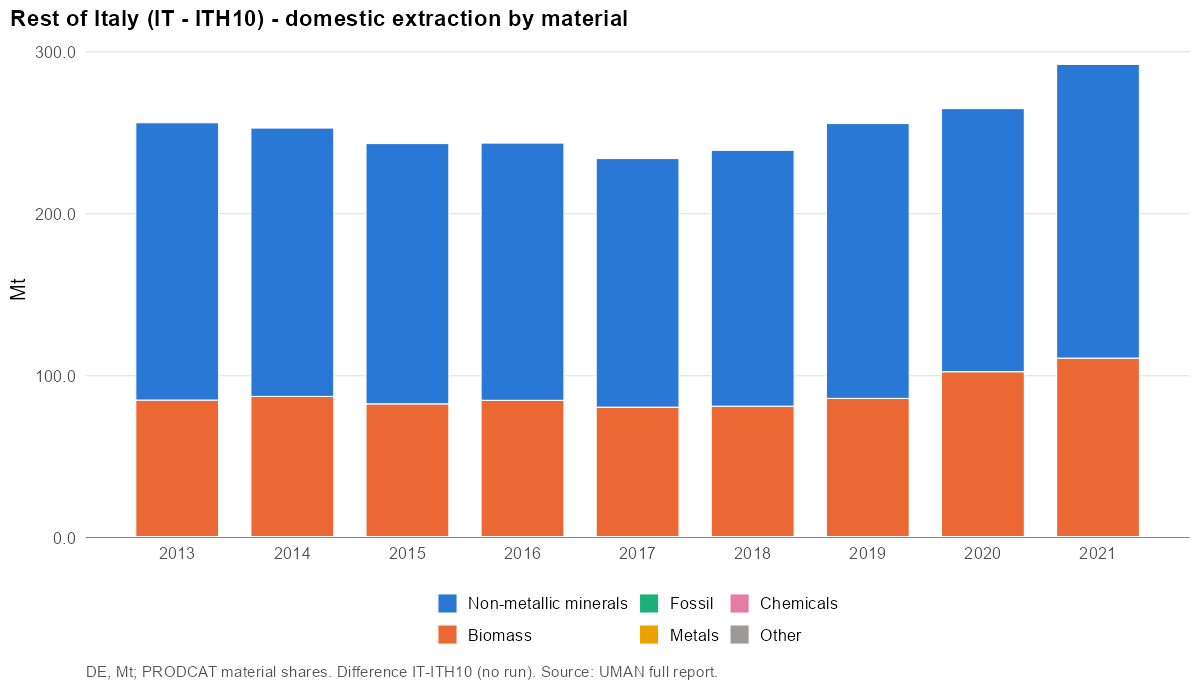
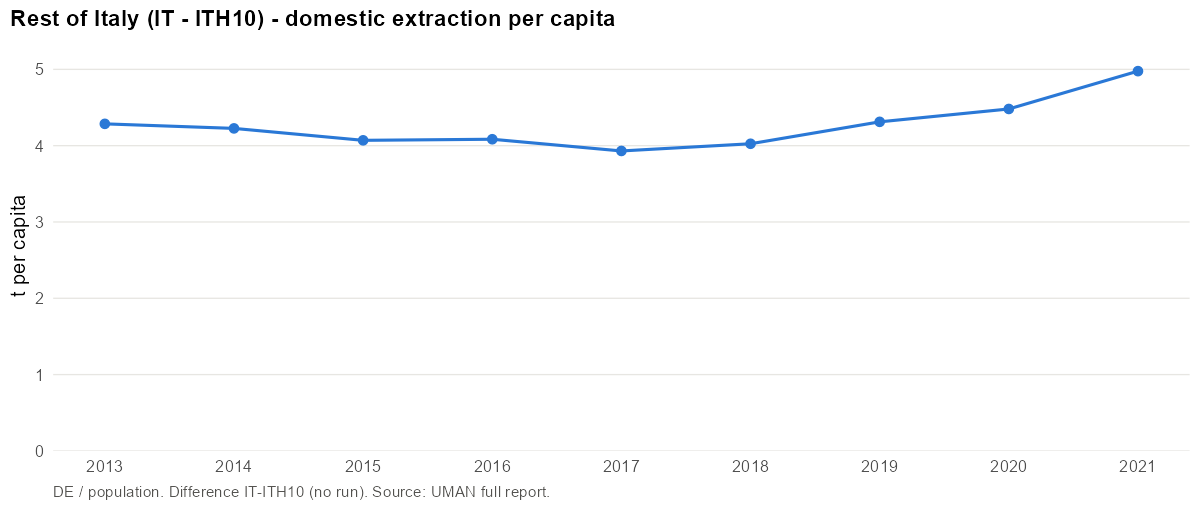
- Main CN4 codes (2019): 2517 Pebbles, gravel, broken or crushed stone, for concrete… (50%); 2516 Granite, porphyry, basalt, sandstone and other monumental… (7%); 2507 Kaolin and other kaolinic clays, whether or not calcined (6%); 1007 Grain sorghum (5%); 0806 Grapes, fresh or dried (3%).
- Main materials: Stone (43%); Agriculture biomass (21%); Other non-metallic minerals (15%).
International trade
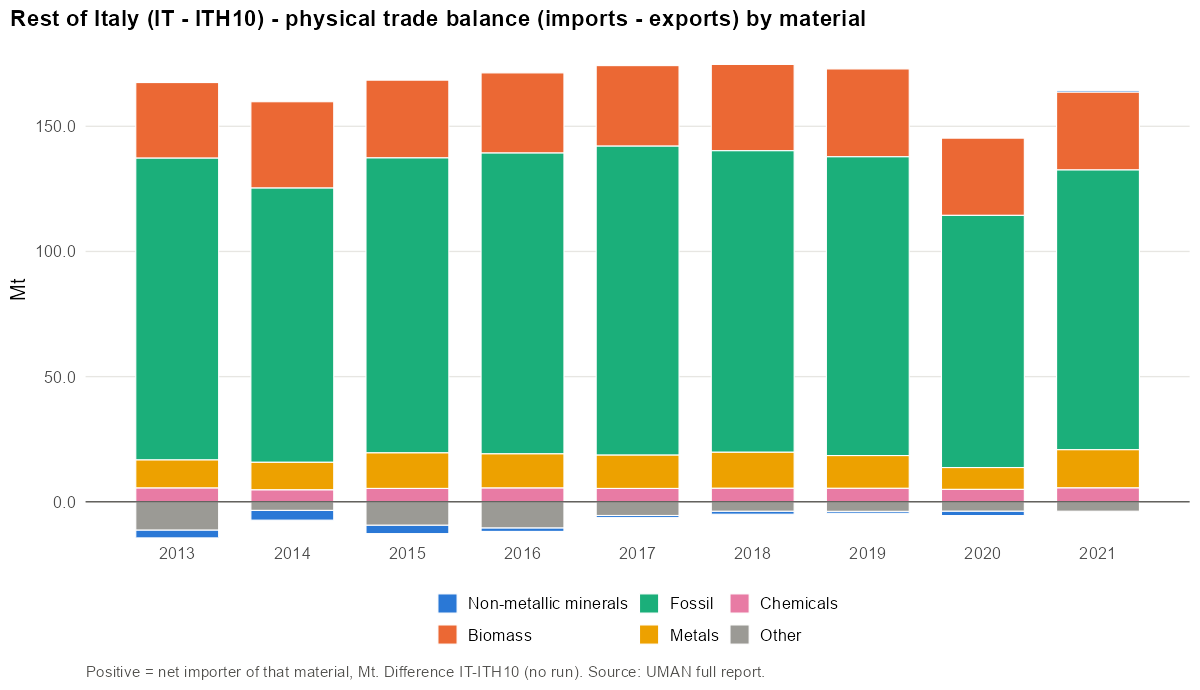
Imports:
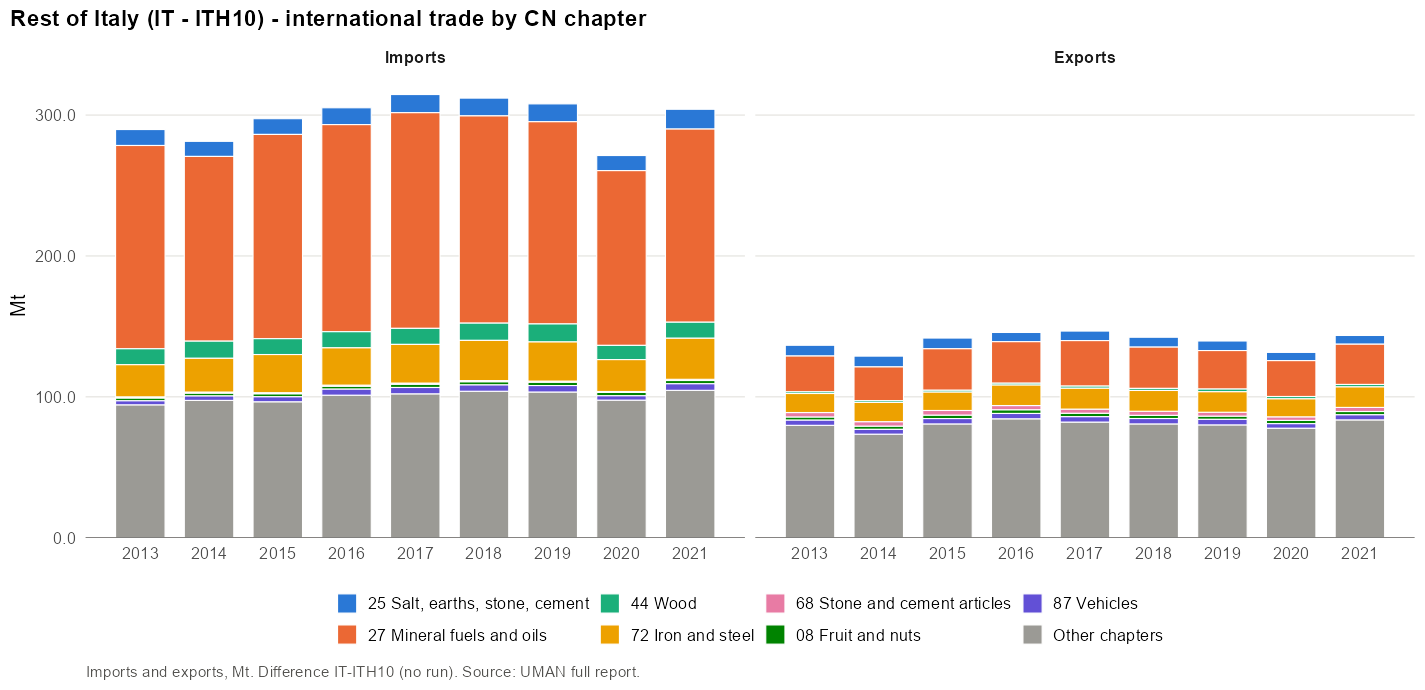
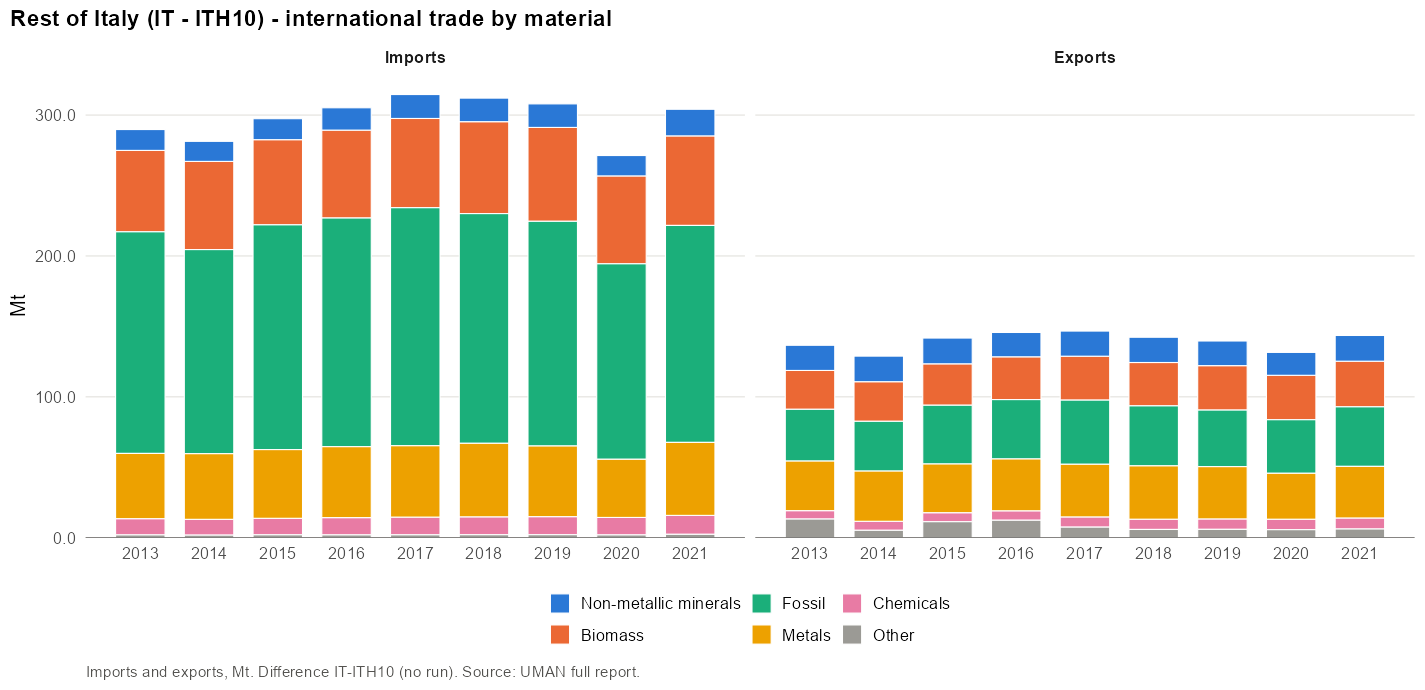
- Main CN4 codes (2019): 2709 Petroleum oils and oils obtained from bituminous minerals… (20%); 2711 Petroleum gas and other gaseous hydrocarbons (17%); 2710 Petroleum oils and oils obtained from bituminous minerals… (5%); 2701 Coal; briquettes, ovoids and similar solid fuels… (4%); 1001 Wheat and meslin (2%).
- Main materials: Fuels (18%); Iron, steel and ferro-alloys (14%); Plastics and rubbers (13%).
Exports:
- Main CN4 codes (2019): 2710 Petroleum oils and oils obtained from bituminous minerals… (18%); 6907 Ceramic flags and paving, hearth or wall tiles; ceramic… (4%); 7306 Tubes, pipes and hollow profiles ""e.g., open seam or… (2%); 7208 Flat-rolled products of iron or non-alloy steel, of a width… (2%); 1902 Pasta, whether or not cooked or stuffed with meat or other… (2%).
- Main materials: Iron, steel and ferro-alloys (23%); Fuels (10%); Agriculture biomass (10%).
Domestic movement of goods
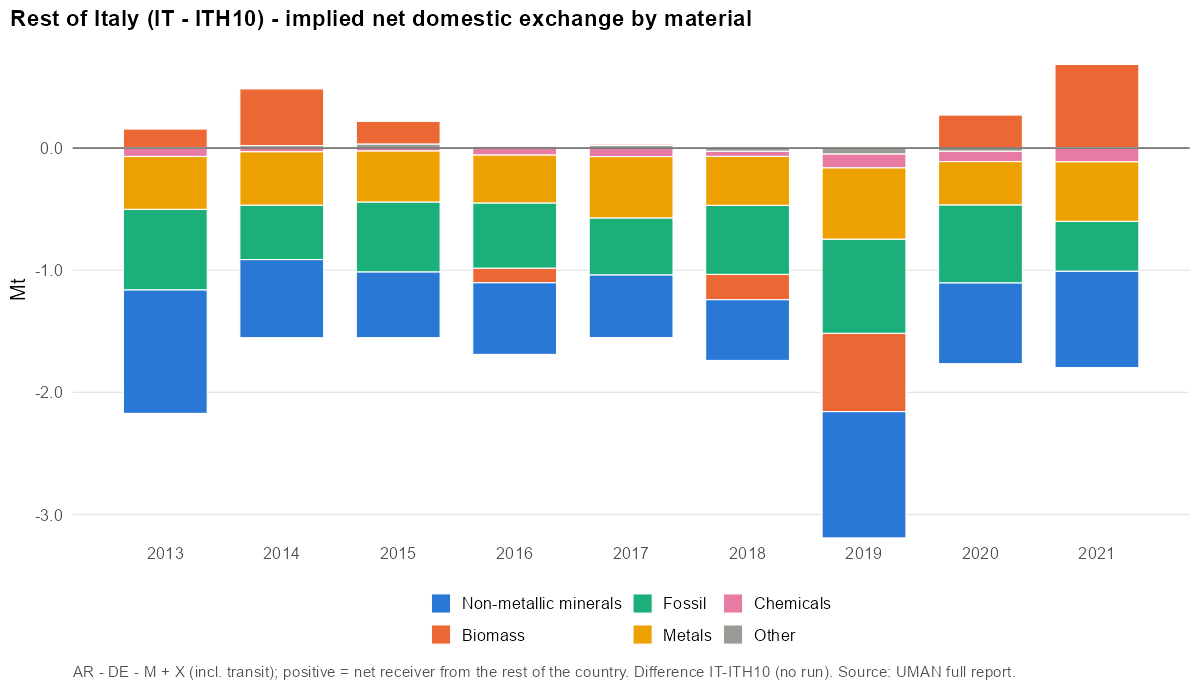
Gross domestic flows of a rest-of territory cannot be obtained by difference; only the implied net exchange is shown.
Available resources
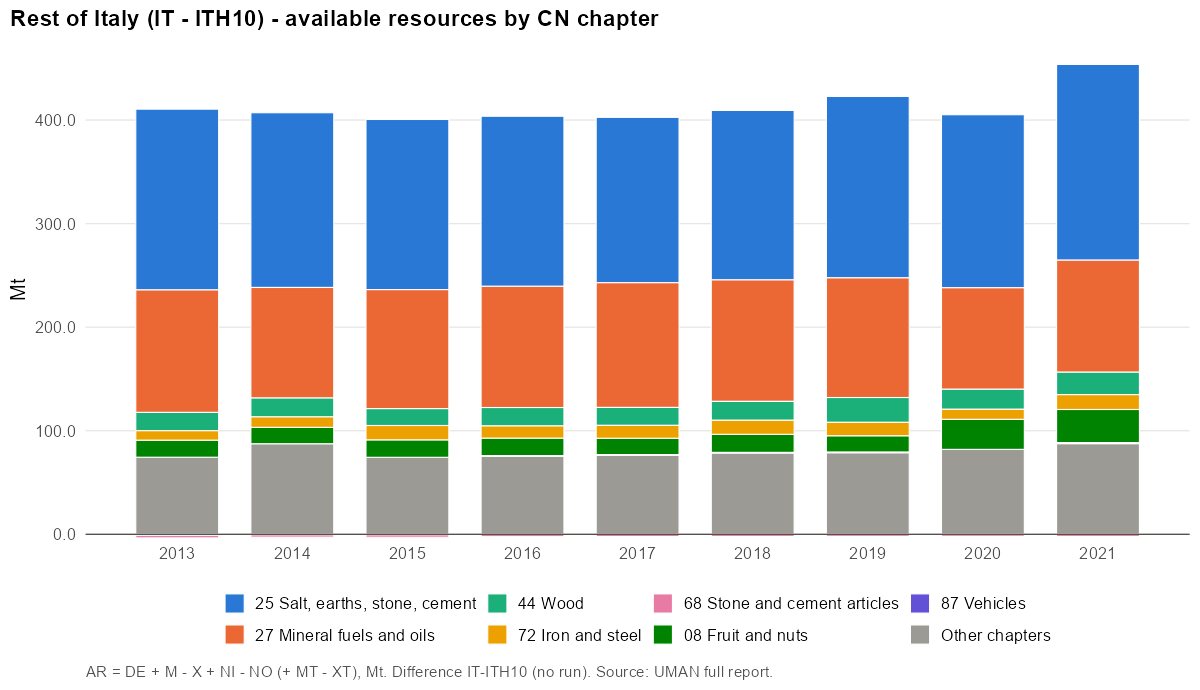
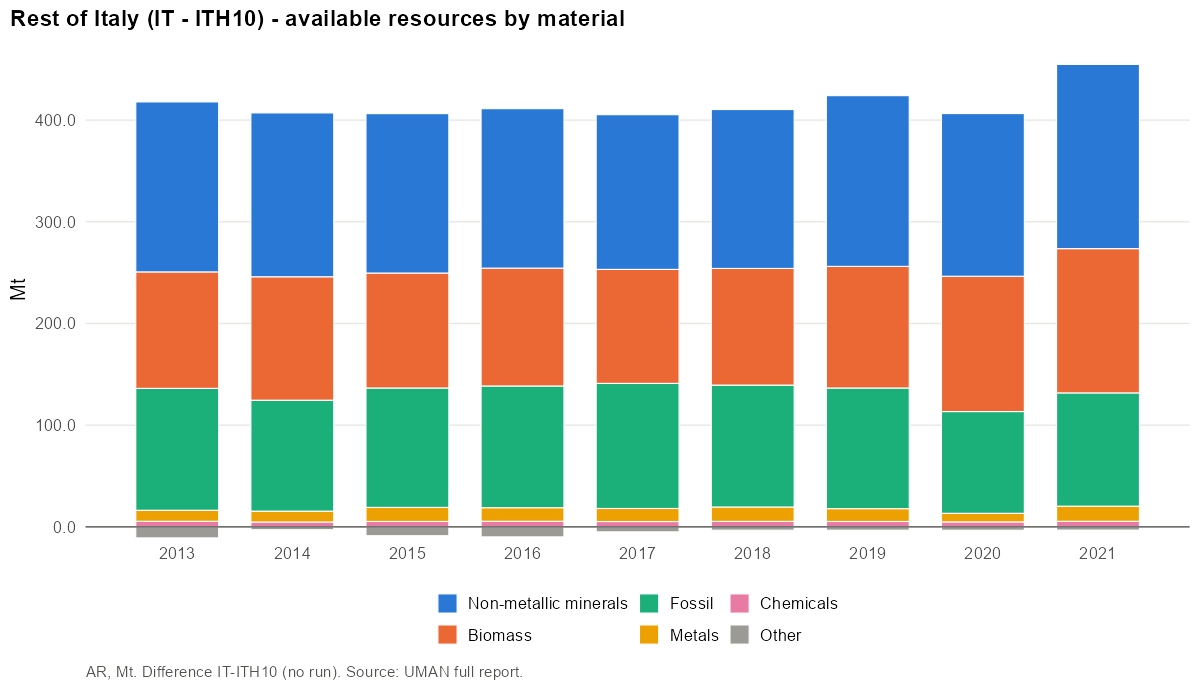
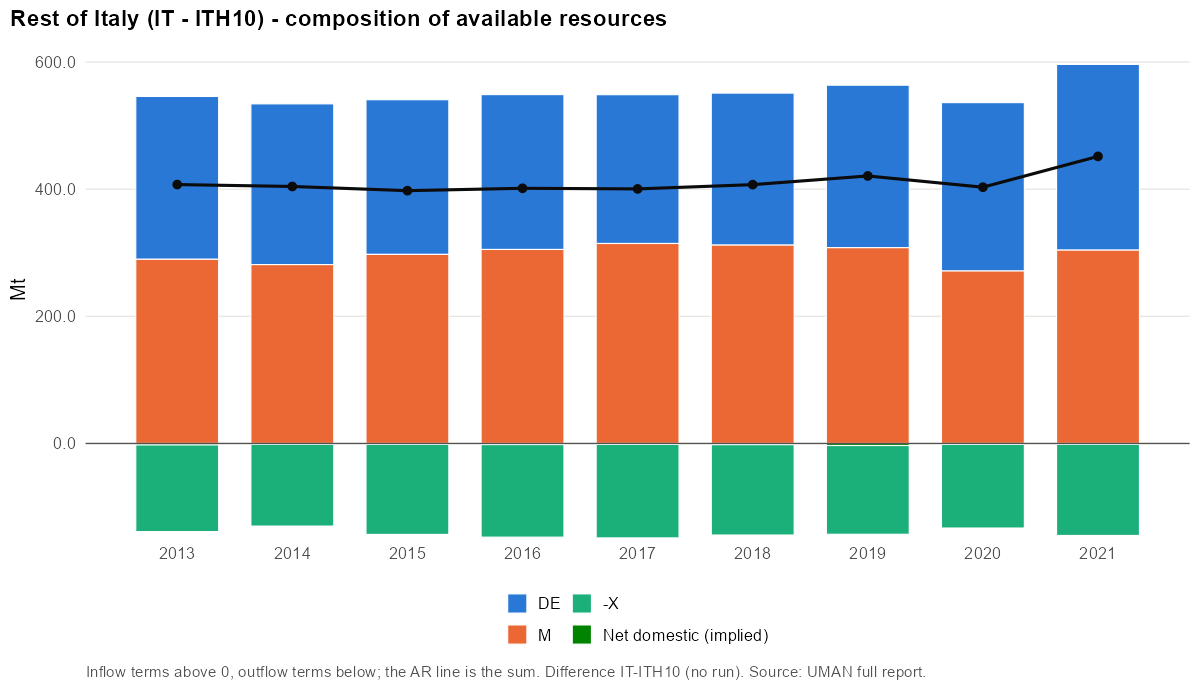
- Main CN4 codes (2019): 2517 Pebbles, gravel, broken or crushed stone, for concrete… (30%); 2709 Petroleum oils and oils obtained from bituminous minerals… (15%); 2711 Petroleum gas and other gaseous hydrocarbons (13%); 2516 Granite, porphyry, basalt, sandstone and other monumental… (4%); 2507 Kaolin and other kaolinic clays, whether or not calcined (4%).
- Main materials: Stone (25%); Agriculture biomass (16%); Other non-metallic minerals (10%).
Industrial production
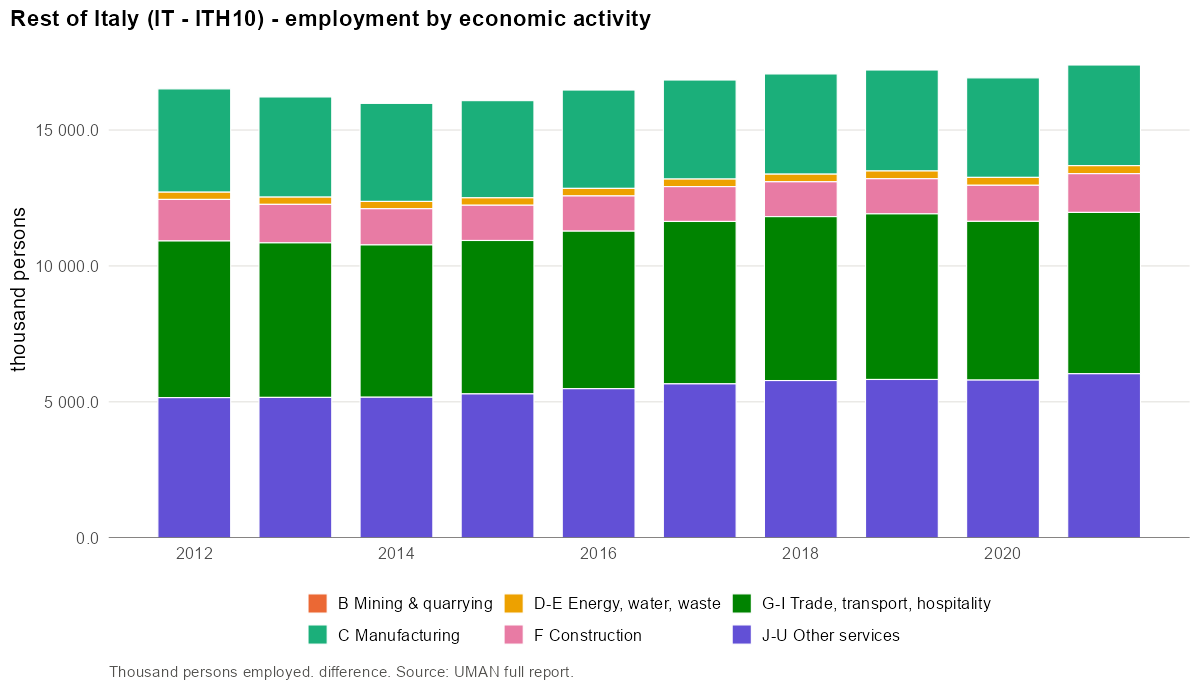
Production and the NACE-CN Sankey require a run; not available for a rest-of territory.
Largest employers (NACE divisions):
| NACE | Activity | Persons | Share |
|---|---|---|---|
| 47 | Retail trade, except of motor vehicles and motorcycles | 1 893 271 | 11.0% |
| 56 | Food and beverage service activities | 1 277 994 | 7.4% |
| 46 | Wholesale trade, except of motor vehicles and motorcycles | 1 124 061 | 6.5% |
| 43 | Specialised construction activities | 919 672 | 5.3% |
| 86 | Human health activities | 557 032 | 3.2% |
| 25 | Manufacture of fabricated metal products, except machinery and equipment | 546 250 | 3.2% |
| 49 | Land transport and transport via pipelines | 544 113 | 3.2% |
| 81 | Services to buildings and landscape activities | 528 149 | 3.1% |
Product transformation
Product transformation requires a run; not available for a rest-of territory.
Domestic material consumption
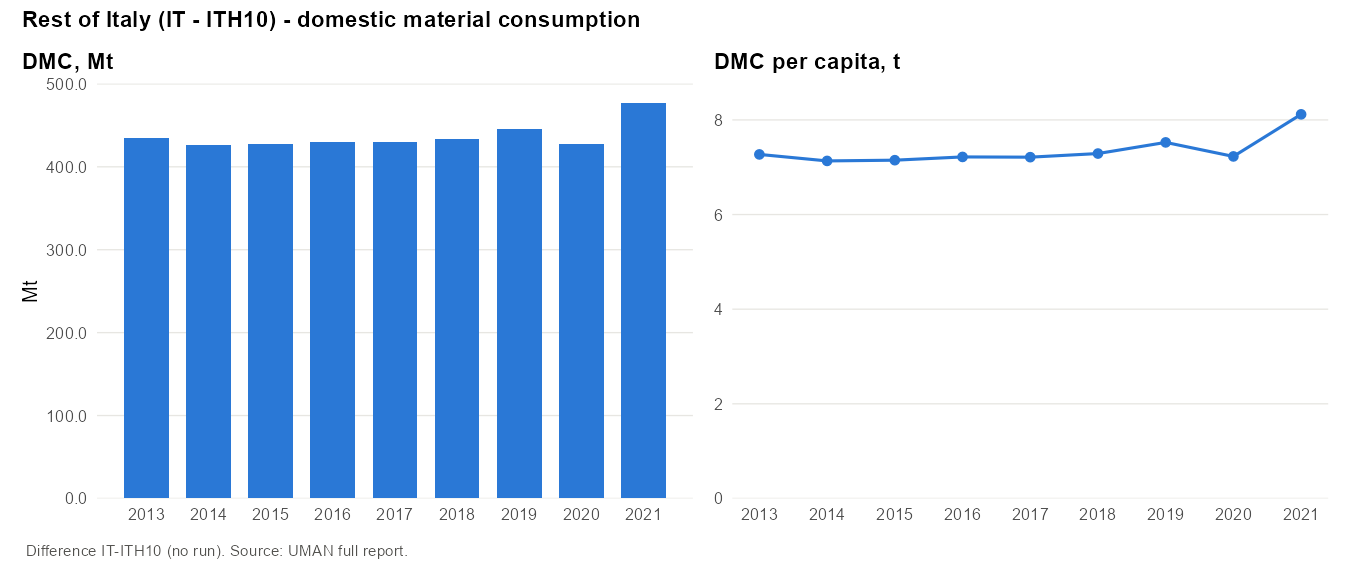
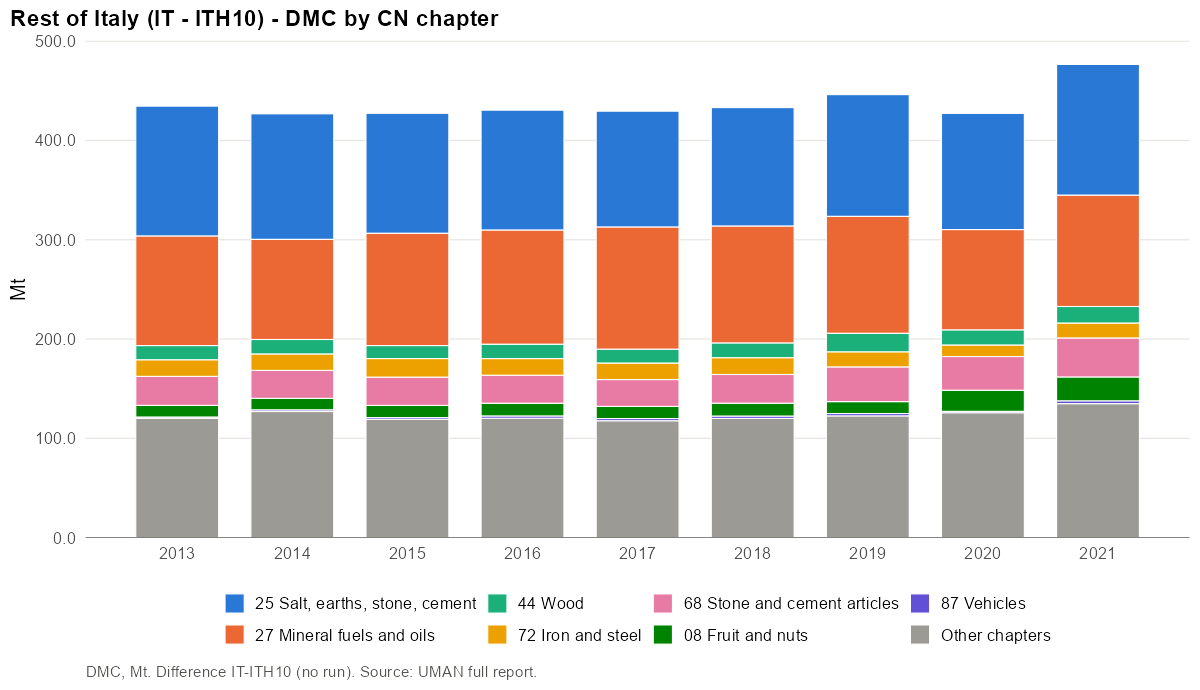
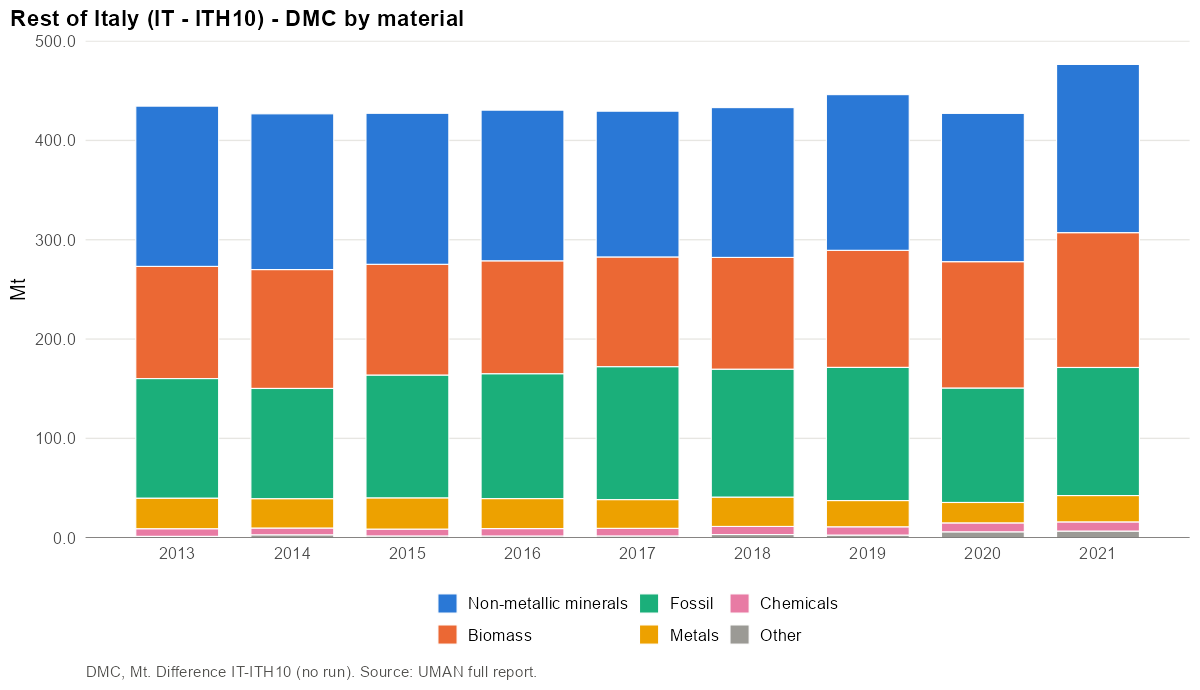
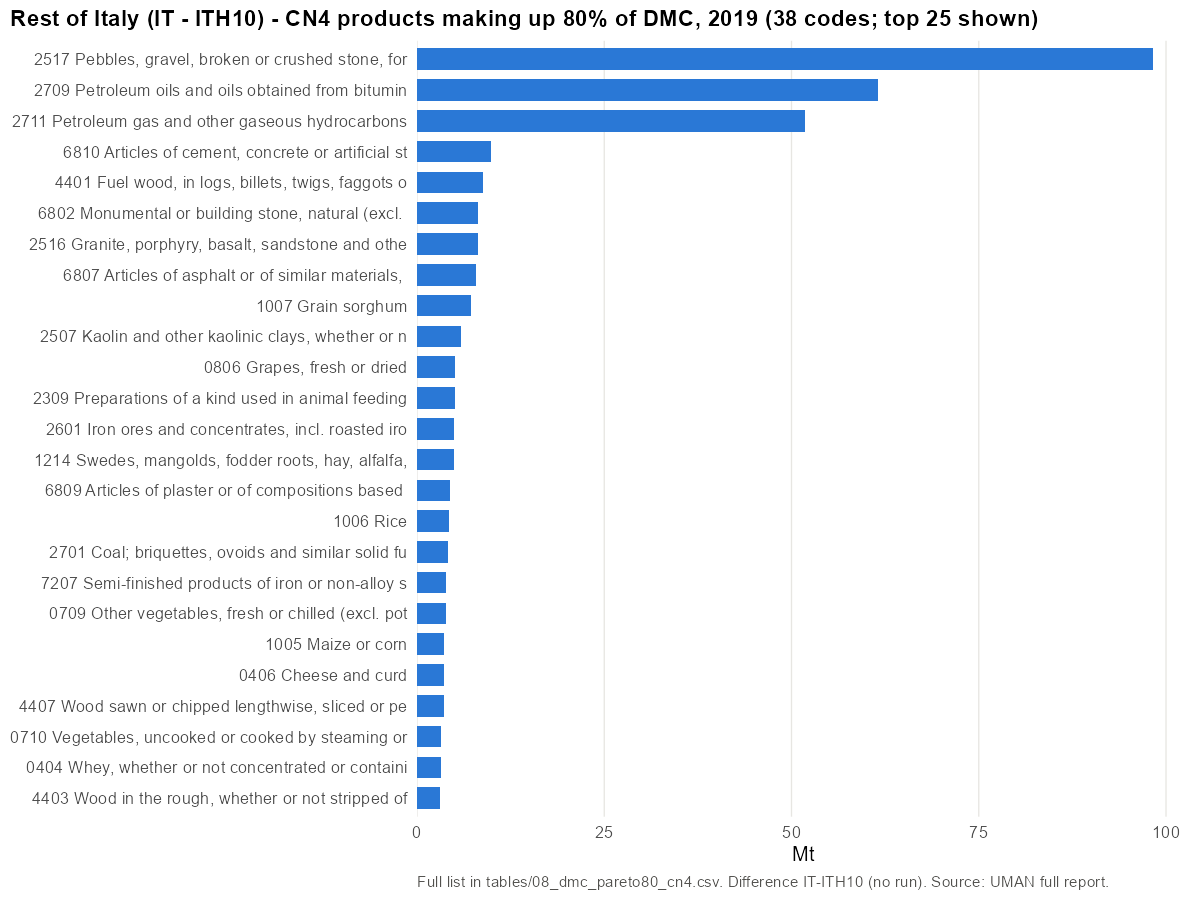
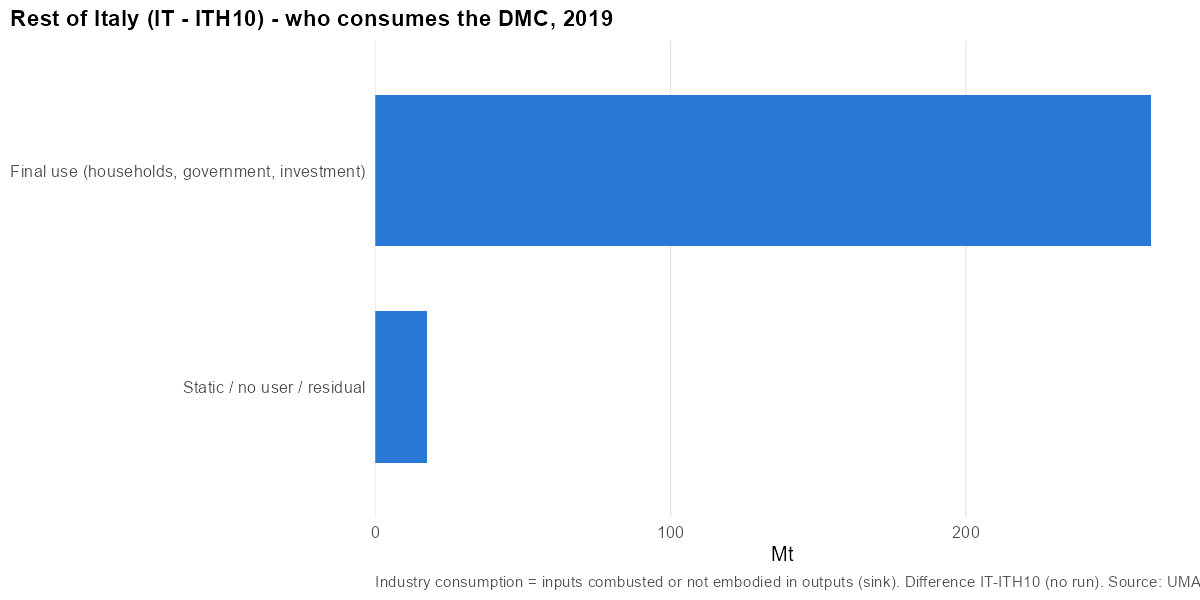
- Main CN4 codes (2019): 2517 Pebbles, gravel, broken or crushed stone, for concrete… (22%); 2709 Petroleum oils and oils obtained from bituminous minerals… (14%); 2711 Petroleum gas and other gaseous hydrocarbons (12%); 6810 Articles of cement, concrete or artificial stone, whether… (2%); 4401 Fuel wood, in logs, billets, twigs, faggots or similar… (2%).
- Main materials: Stone (22%); Agriculture biomass (14%); Fuels (9%).
38 CN4 codes make up 80% of DMC in 2019. Top 10:
| Rank | CN4 | Product | Mt | Share | Cumulative |
|---|---|---|---|---|---|
| 1 | 2517 | Pebbles, gravel, broken or crushed stone, for concrete… | 98.24 | 22.0% | 22% |
| 2 | 2709 | Petroleum oils and oils obtained from bituminous minerals… | 61.52 | 13.8% | 36% |
| 3 | 2711 | Petroleum gas and other gaseous hydrocarbons | 51.78 | 11.6% | 47% |
| 4 | 6810 | Articles of cement, concrete or artificial stone, whether… | 9.90 | 2.2% | 50% |
| 5 | 4401 | Fuel wood, in logs, billets, twigs, faggots or similar… | 8.80 | 2.0% | 52% |
| 6 | 6802 | Monumental or building stone, natural (excl. slate)… | 8.21 | 1.8% | 53% |
| 7 | 2516 | Granite, porphyry, basalt, sandstone and other monumental… | 8.09 | 1.8% | 55% |
| 8 | 6807 | Articles of asphalt or of similar materials, e.g. petroleum… | 7.90 | 1.8% | 57% |
| 9 | 1007 | Grain sorghum | 7.14 | 1.6% | 59% |
| 10 | 2507 | Kaolin and other kaolinic clays, whether or not calcined | 5.91 | 1.3% | 60% |
Metrics
| Year | DMC/cap | AR/cap | DE/cap | Import dep. | Intl import dep. | Self-suff. | Export int. |
|---|---|---|---|---|---|---|---|
| 2013 | 7.3 | 6.8 | 4.3 | – | 53% | 59% | – |
| 2014 | 7.1 | 6.8 | 4.2 | – | 53% | 59% | – |
| 2015 | 7.1 | 6.7 | 4.1 | – | 55% | 57% | – |
| 2016 | 7.2 | 6.7 | 4.1 | – | 56% | 57% | – |
| 2017 | 7.2 | 6.7 | 3.9 | – | 57% | 54% | – |
| 2018 | 7.3 | 6.9 | 4.0 | – | 57% | 55% | – |
| 2019 | 7.5 | 7.1 | 4.3 | – | 55% | 57% | – |
| 2020 | 7.2 | 6.8 | 4.5 | – | 51% | 62% | – |
| 2021 | 8.1 | 7.7 | 5.0 | – | 51% | 61% | – |
Negative cells in 2019 (child > parent for a CN code): DE -0.01 Mt; M -0.00 Mt; X -0.00 Mt; dmc -0.33 Mt.
Portugal
Method · Italy · Portugal · Sweden · Comparison · About
In this chapter: Portugal · Centro · Região de Coimbra · Rest of Portugal (PT - PT16) · Rest of Centro (PT16 - PT16E)
Portugal (PT)
Portugal · NUTS 0 · code PT · tier A · years 2012–2021
Findings
- DMC is 112.6 Mt or 10.9 t/cap in 2019. It has risen from its low in 2013 (9.1 t/cap) to 11.7 t/cap in 2021.
- Portugal is a stone country: DE is 80.6 Mt (7.8 t/cap), of which marble 31%, granite 24% and limestone 11%. Monumental and building stone (6802) is the largest single item of DMC (16%).
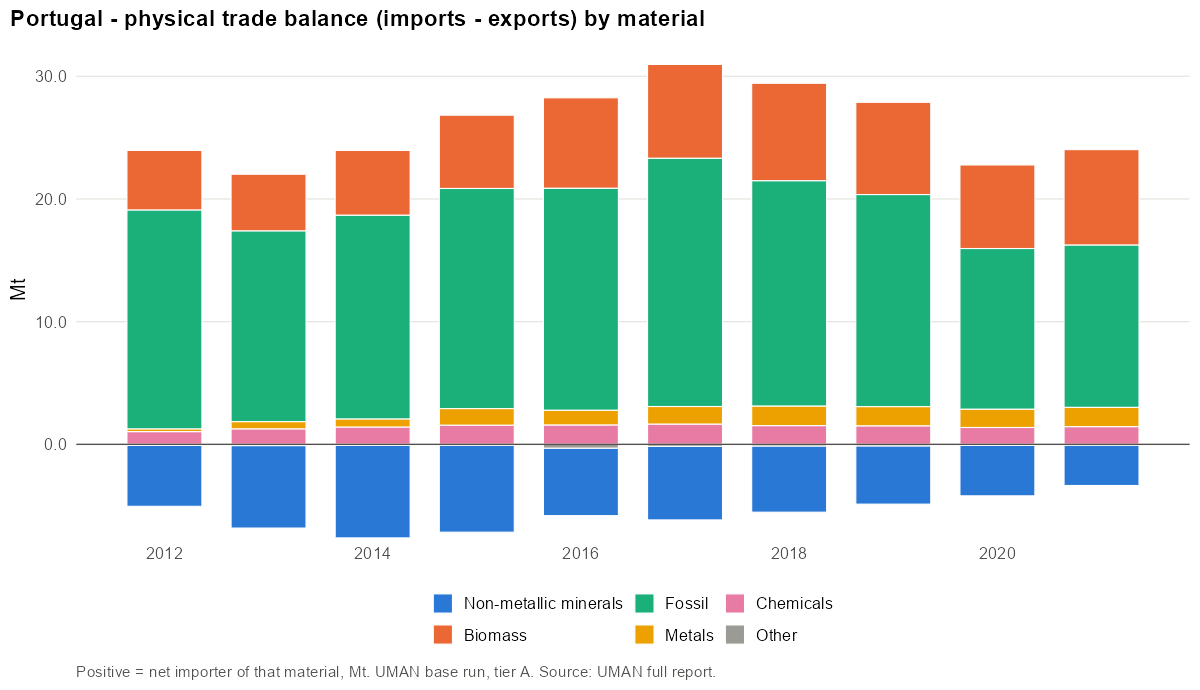
- Imports (62.1 Mt) are mostly energy: crude oil 18% and gas 9%. Exports (39.1 Mt) are refined products (16%), cement (5%) and paper (4%). Import dependency is 44%.
- DMC composition: 49% non-metallic minerals, 26% biomass, 17% fossil. 29 CN4 codes make up 80%.
- Transformation: 40% of round-1 inputs are transformed. Industry consumes 29.6 Mt as sink and re-exports 7.5 Mt. The unbalanced share is 6.9%.
Overview
| 2012 | 2019 | 2021 | |
|---|---|---|---|
| Population | 10 503 889 | 10 375 395 | 10 421 117 |
| DE (Mt) | 74.6 | 80.6 | 94.0 |
| Imports M (Mt) | 51.8 | 62.1 | 59.2 |
| Exports X (Mt) | 32.9 | 39.1 | 38.6 |
| Domestic in NI (Mt) | 0.0 | 0.0 | 0.0 |
| Domestic out NO (Mt) | 0.0 | 0.0 | 0.0 |
| AR (Mt) | 93.5 | 103.6 | 114.7 |
| DMC (Mt) | 103.5 | 112.6 | 122.3 |
| DMC (t/cap) | 9.9 | 10.9 | 11.7 |
| Unbalanced (% of gross AR) | 8.6% | 6.9% | 5.5% |
Domestic extraction
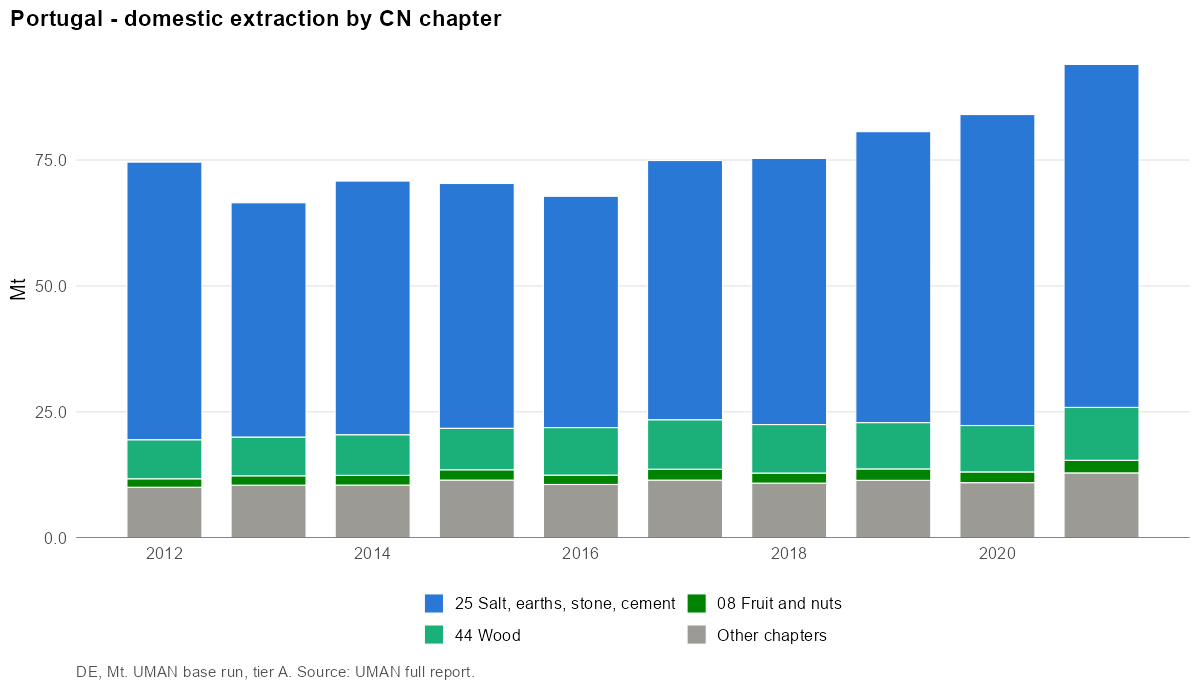
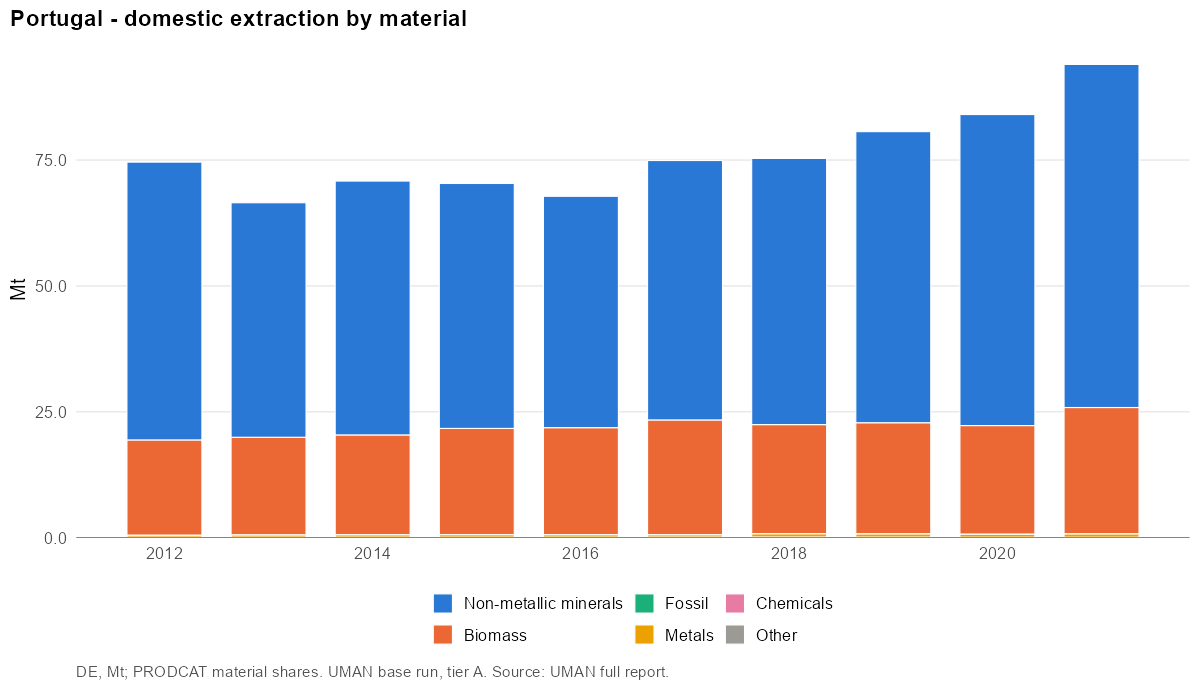
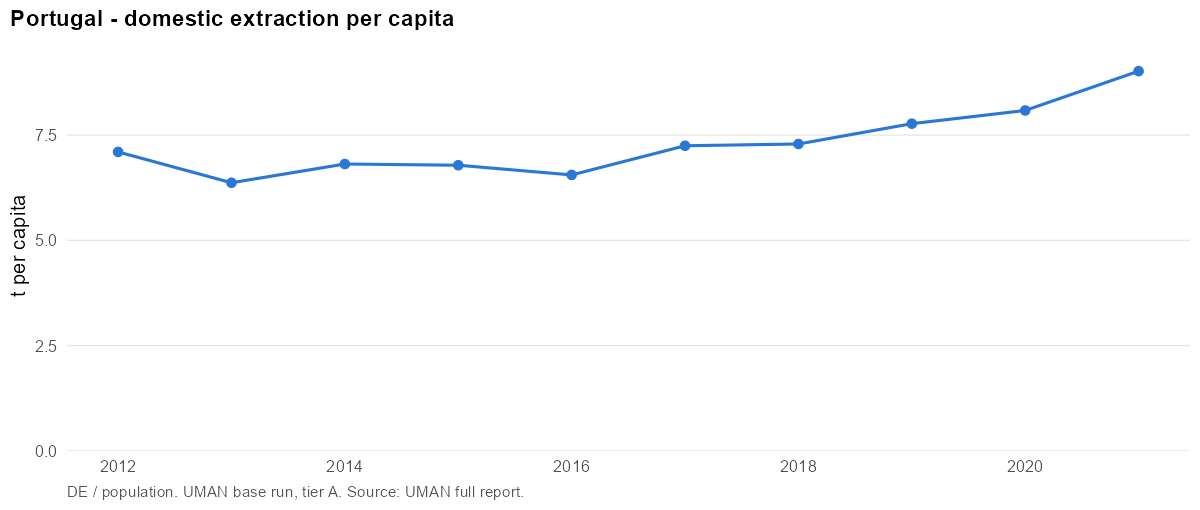
- Main CN4 codes (2019): 2515 Marble, travertine, ecaussine and other calcareous… (31%); 2516 Granite, porphyry, basalt, sandstone and other monumental… (24%); 2521 Limestone flux; limestone and other calcareous stone, of a… (11%); 4403 Wood in the rough, whether or not stripped of bark or… (10%); 2508 Clays, andalusite, kyanite and sillimanite, whether or not… (3%).
- Main materials: Stone (55%); Wood and wood fuels (11%); Cement (11%).
International trade
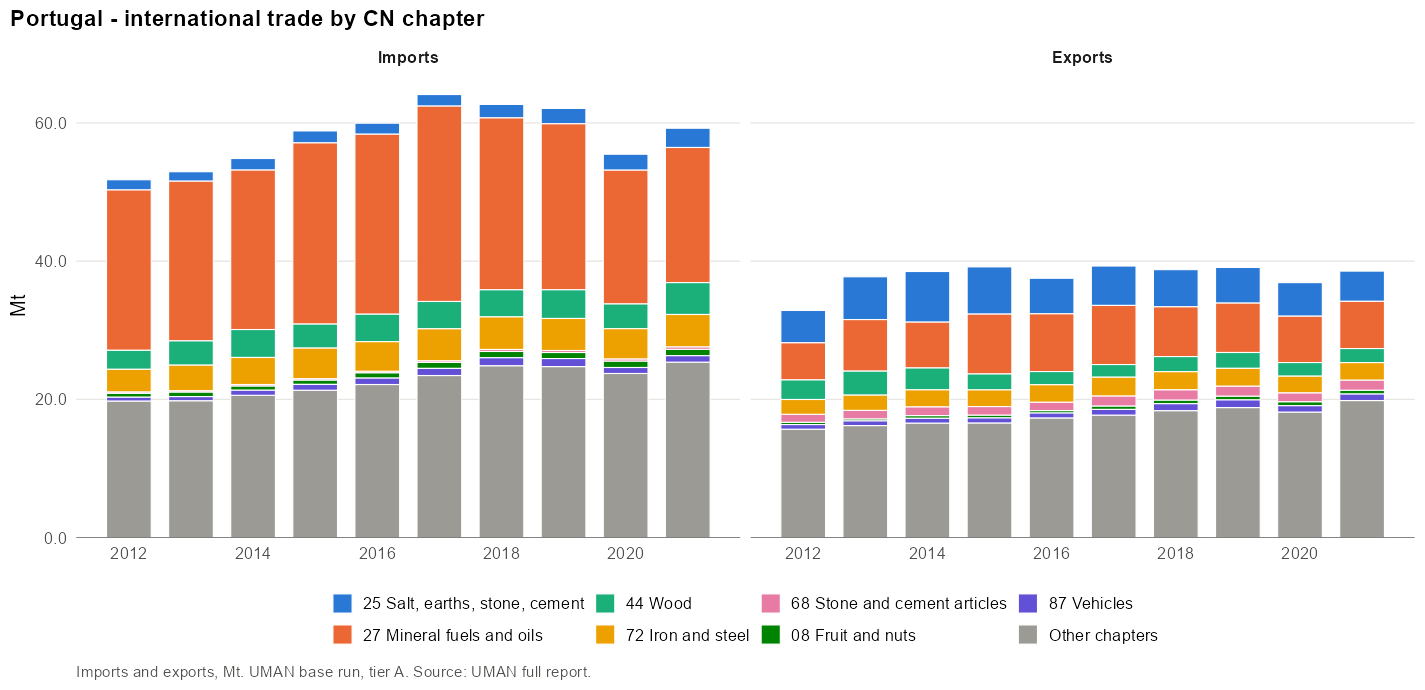
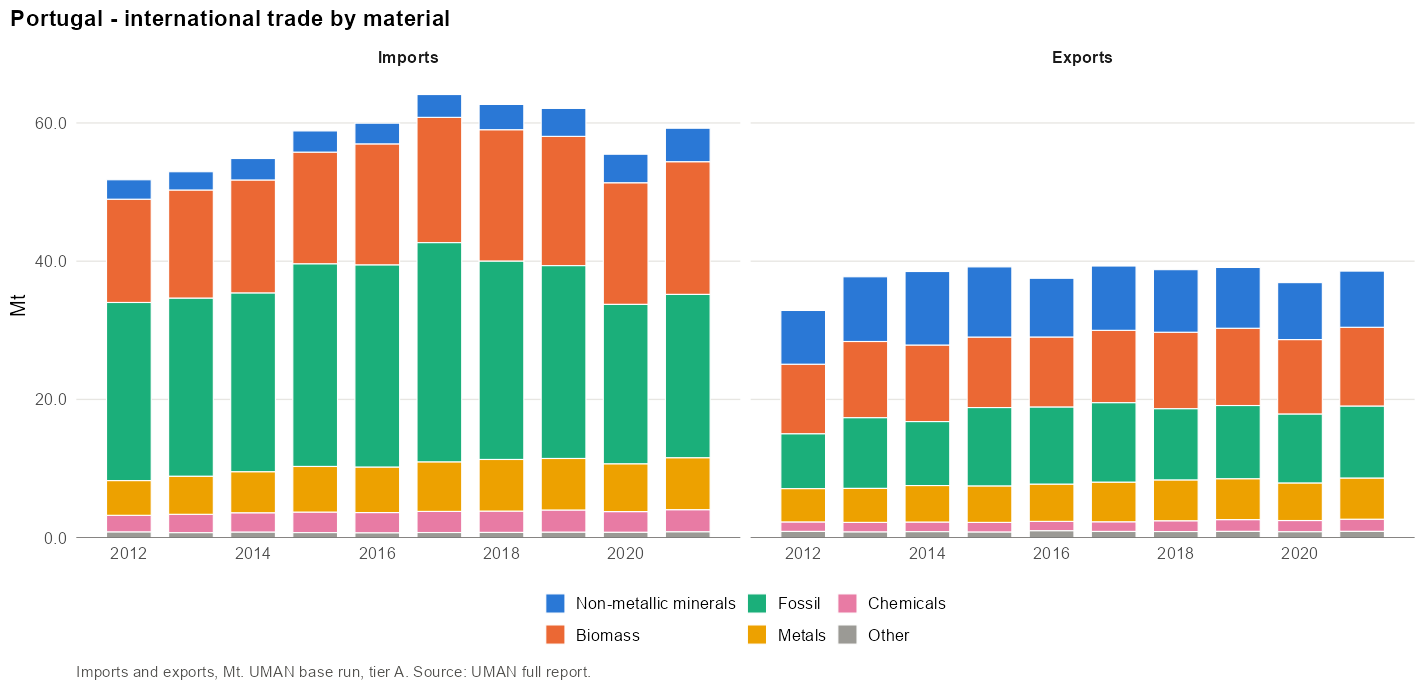
Imports:
- Main CN4 codes (2019): 2709 Petroleum oils and oils obtained from bituminous minerals… (18%); 2711 Petroleum gas and other gaseous hydrocarbons (9%); 2710 Petroleum oils and oils obtained from bituminous minerals… (6%); 2701 Coal; briquettes, ovoids and similar solid fuels… (5%); 1005 Maize or corn (3%).
- Main materials: Fuels (23%); Agriculture biomass (15%); Iron, steel and ferro-alloys (11%).
Exports:
- Main CN4 codes (2019): 2710 Petroleum oils and oils obtained from bituminous minerals… (16%); 2523 Cement, incl. cement clinkers, whether or not coloured (5%); 4802 Uncoated paper and paperboard, of a kind used for writing… (4%); 4703 Chemical wood pulp, soda or sulphate (excl. dissolving… (3%); 7010 Carboys, bottles, flasks, jars, pots, phials, ampoules and… (3%).
- Main materials: Fuels (16%); Iron, steel and ferro-alloys (12%); Wood and wood fuels (9%).
Domestic movement of goods
National territory: no domestic border, NI = NO = 0.
Available resources
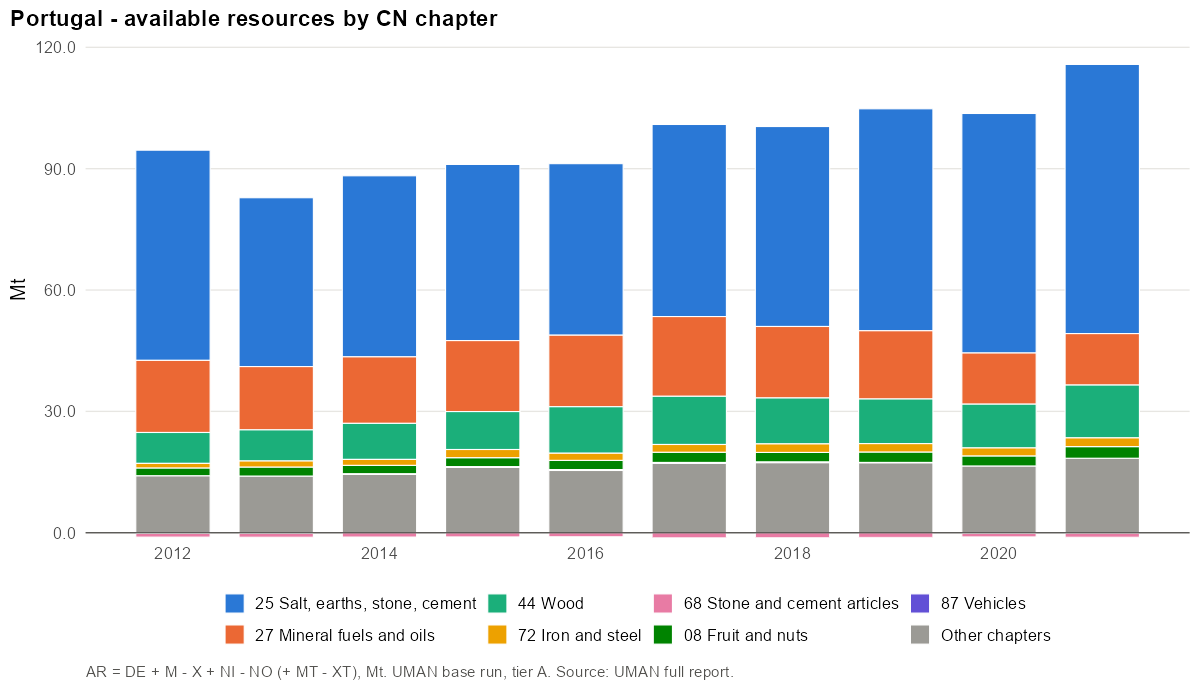
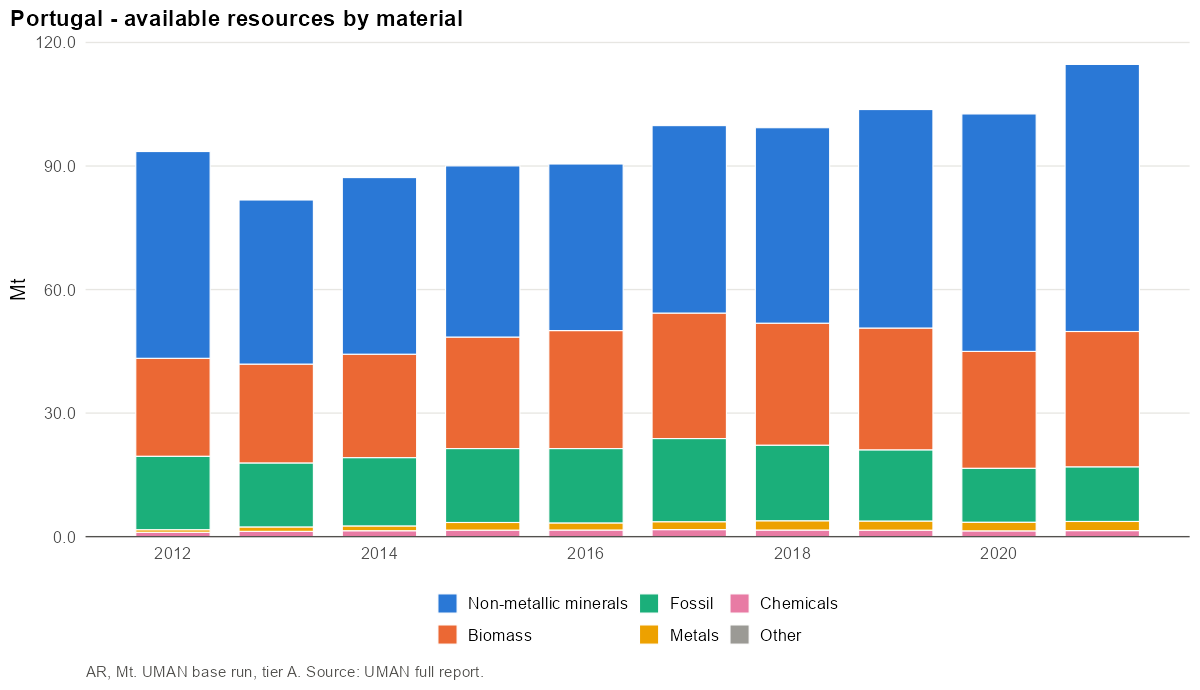
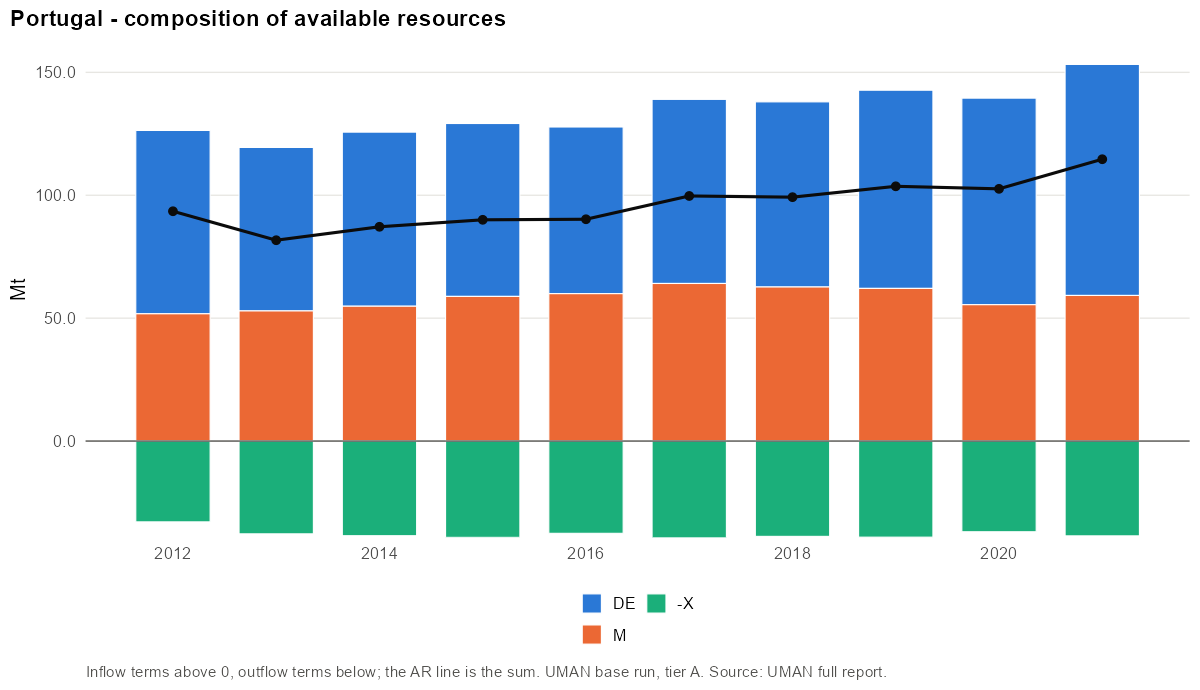
- Main CN4 codes (2019): 2515 Marble, travertine, ecaussine and other calcareous… (23%); 2516 Granite, porphyry, basalt, sandstone and other monumental… (19%); 2709 Petroleum oils and oils obtained from bituminous minerals… (11%); 4403 Wood in the rough, whether or not stripped of bark or… (9%); 2521 Limestone flux; limestone and other calcareous stone, of a… (8%).
- Main materials: Stone (41%); Agriculture biomass (14%); Wood and wood fuels (10%).
Industrial production
Largest employers (NACE divisions):
| NACE | Activity | Persons | Share |
|---|---|---|---|
| 47 | Retail trade, except of motor vehicles and motorcycles | 461 148 | 10.9% |
| 56 | Food and beverage service activities | 283 438 | 6.7% |
| 46 | Wholesale trade, except of motor vehicles and motorcycles | 242 666 | 5.7% |
| 82 | Office administrative, office support and other business support activities | 233 508 | 5.5% |
| 01 | Crop and animal production, hunting and related service activities | 177 221 | 4.2% |
| 86 | Human health activities | 172 650 | 4.1% |
| 41 | Construction of buildings | 169 284 | 4.0% |
| 43 | Specialised construction activities | 135 446 | 3.2% |
Product transformation
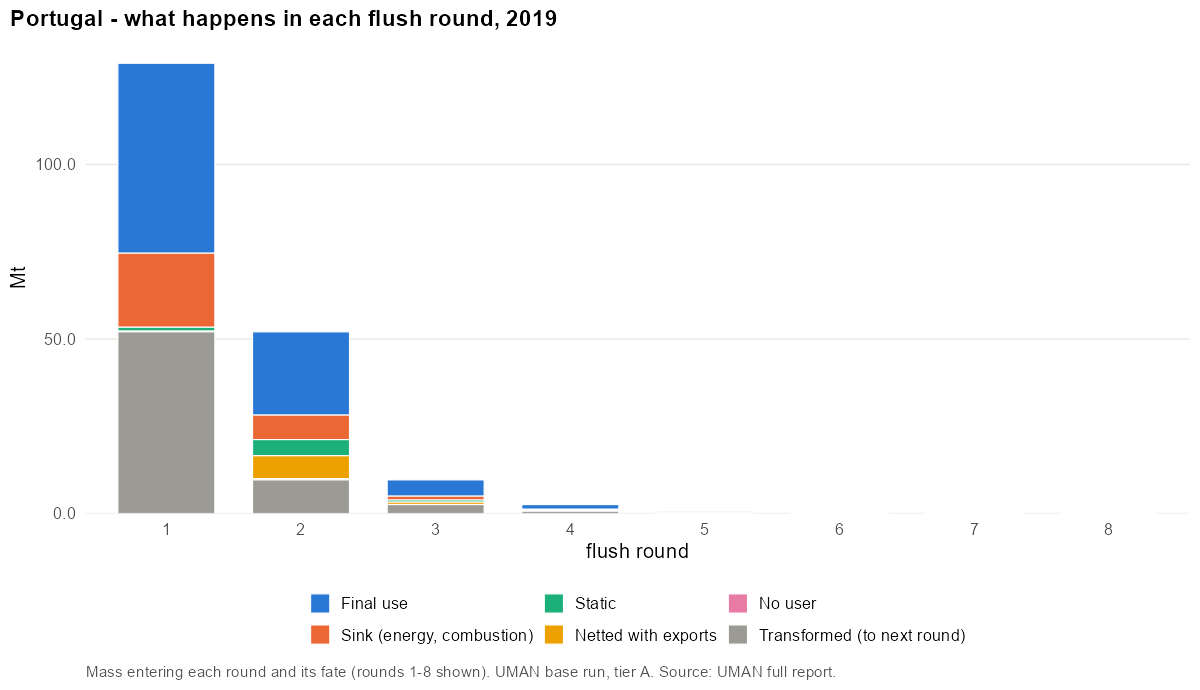
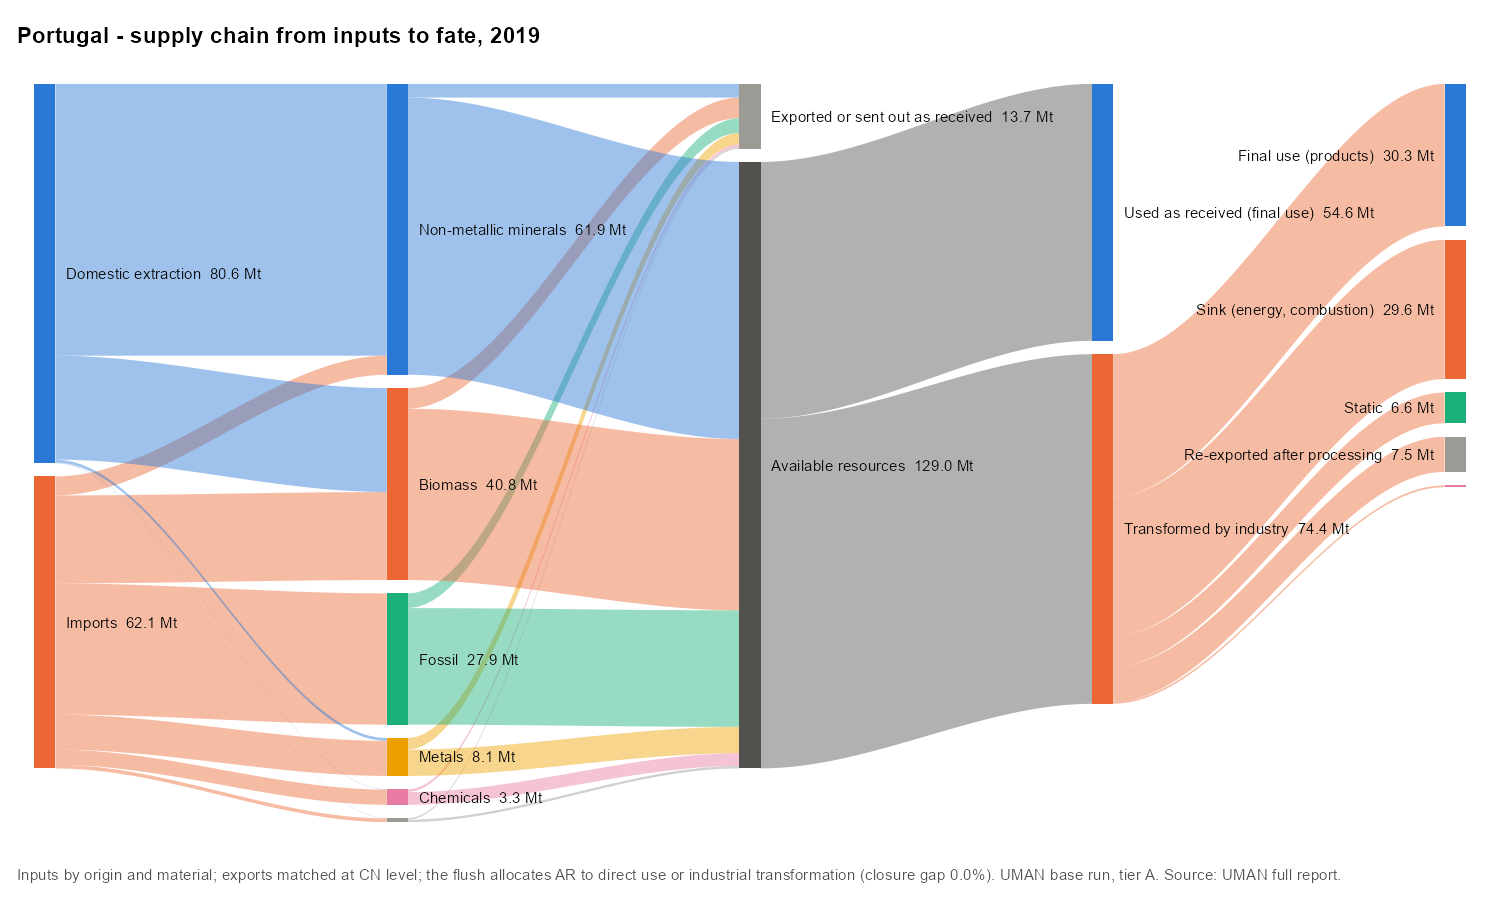
The flush needed 11 rounds. Round 1 handled 129.0 Mt; 40% of it was transformed into other products and re-entered round 2.
Domestic material consumption
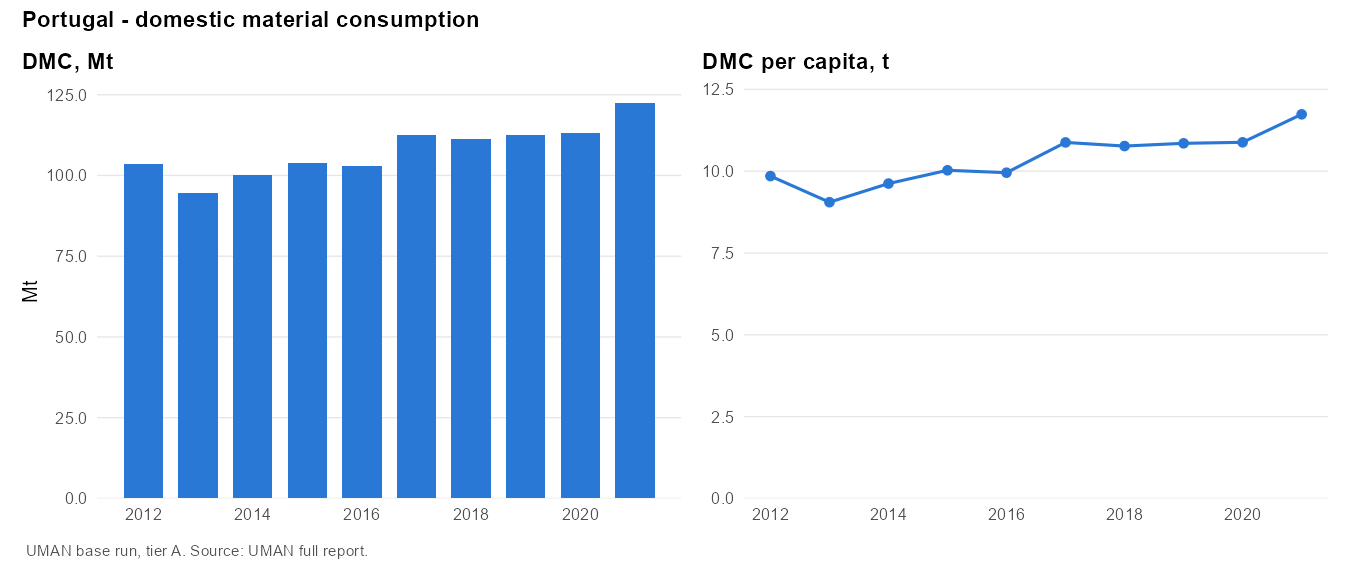
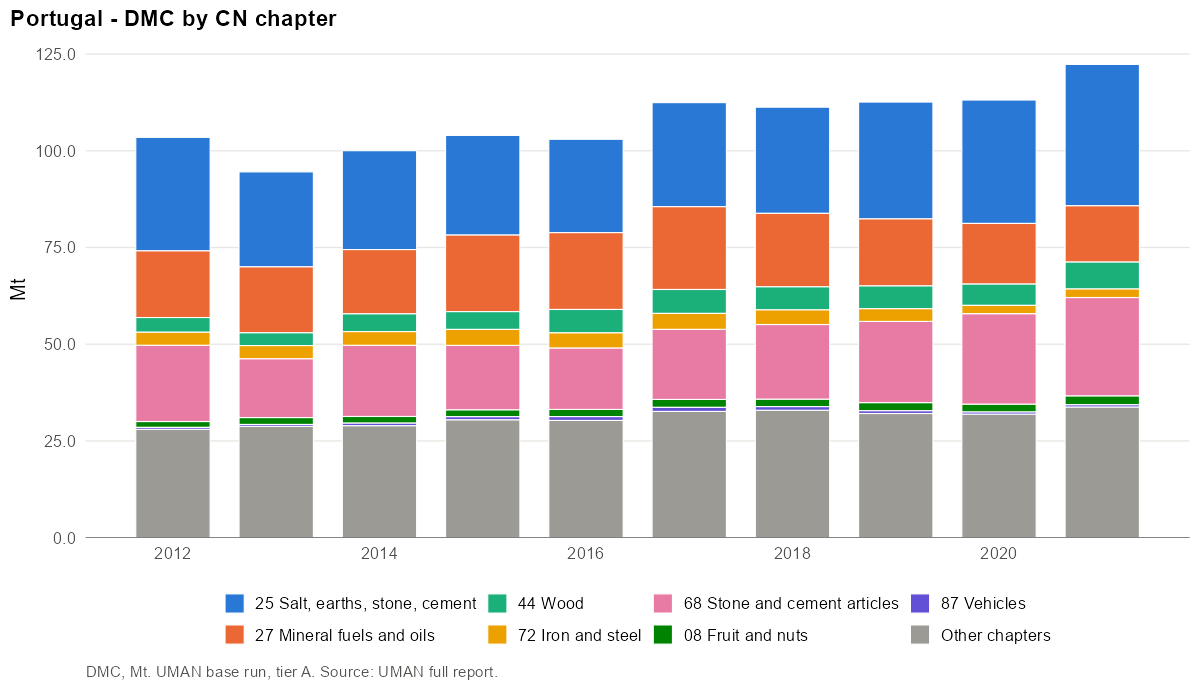
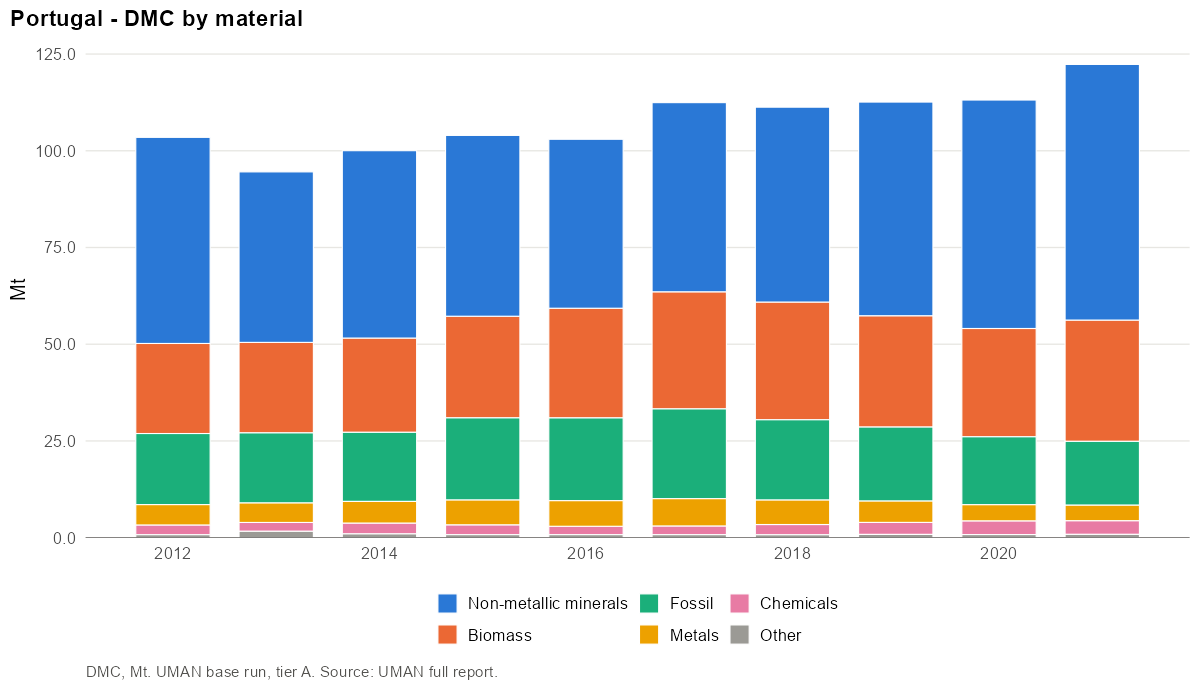
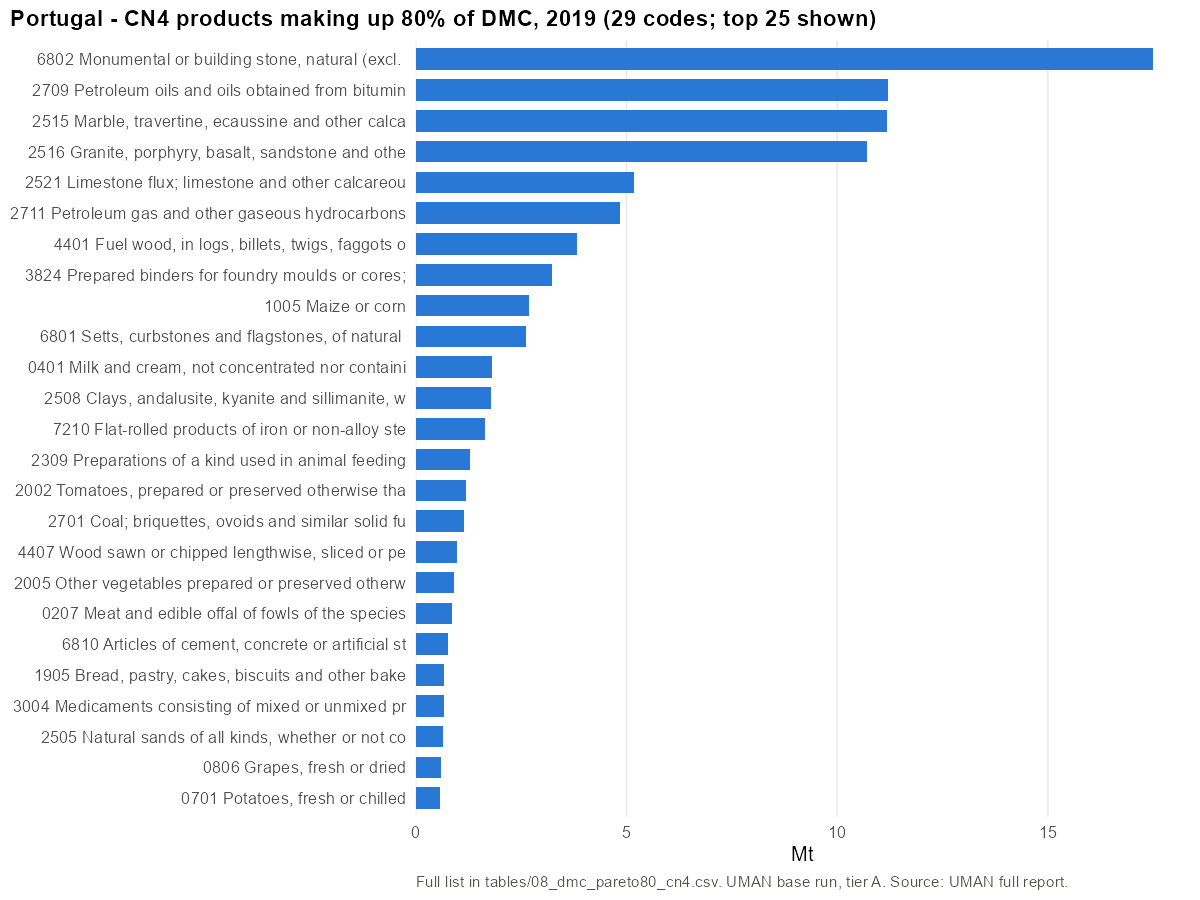
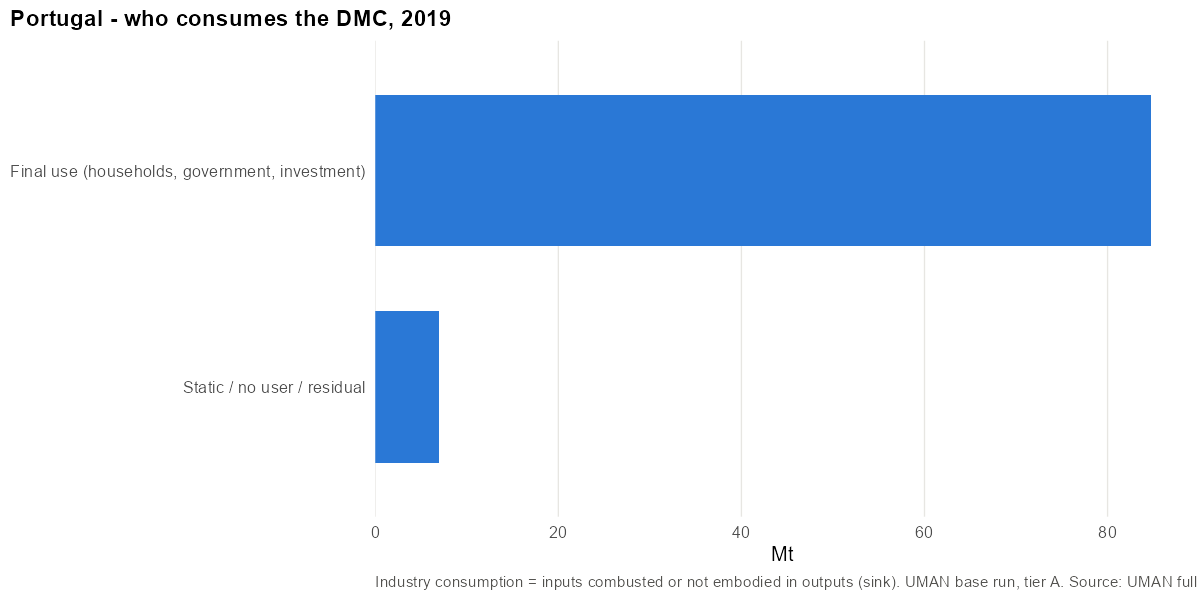
- Main CN4 codes (2019): 6802 Monumental or building stone, natural (excl. slate)… (16%); 2709 Petroleum oils and oils obtained from bituminous minerals… (10%); 2515 Marble, travertine, ecaussine and other calcareous… (10%); 2516 Granite, porphyry, basalt, sandstone and other monumental… (10%); 2521 Limestone flux; limestone and other calcareous stone, of a… (5%).
- Main materials: Stone (39%); Agriculture biomass (12%); Fuels (8%).
29 CN4 codes make up 80% of DMC in 2019. Top 10:
| Rank | CN4 | Product | Mt | Share | Cumulative |
|---|---|---|---|---|---|
| 1 | 6802 | Monumental or building stone, natural (excl. slate)… | 17.49 | 15.5% | 16% |
| 2 | 2709 | Petroleum oils and oils obtained from bituminous minerals… | 11.20 | 10.0% | 25% |
| 3 | 2515 | Marble, travertine, ecaussine and other calcareous… | 11.18 | 9.9% | 35% |
| 4 | 2516 | Granite, porphyry, basalt, sandstone and other monumental… | 10.71 | 9.5% | 45% |
| 5 | 2521 | Limestone flux; limestone and other calcareous stone, of a… | 5.17 | 4.6% | 50% |
| 6 | 2711 | Petroleum gas and other gaseous hydrocarbons | 4.85 | 4.3% | 54% |
| 7 | 4401 | Fuel wood, in logs, billets, twigs, faggots or similar… | 3.82 | 3.4% | 57% |
| 8 | 3824 | Prepared binders for foundry moulds or cores; chemical… | 3.23 | 2.9% | 60% |
| 9 | 1005 | Maize or corn | 2.70 | 2.4% | 62% |
| 10 | 6801 | Setts, curbstones and flagstones, of natural stone (excl.… | 2.61 | 2.3% | 65% |
Metrics
| Year | DMC/cap | AR/cap | DE/cap | Import dep. | Intl import dep. | Self-suff. | Export int. |
|---|---|---|---|---|---|---|---|
| 2012 | 9.9 | 8.9 | 7.1 | 41% | 41% | 72% | 26% |
| 2013 | 9.1 | 7.8 | 6.4 | 44% | 44% | 70% | 32% |
| 2014 | 9.6 | 8.4 | 6.8 | 44% | 44% | 71% | 31% |
| 2015 | 10.0 | 8.7 | 6.8 | 46% | 46% | 68% | 30% |
| 2016 | 10.0 | 8.7 | 6.6 | 47% | 47% | 66% | 29% |
| 2017 | 10.9 | 9.6 | 7.2 | 46% | 46% | 67% | 28% |
| 2018 | 10.8 | 9.6 | 7.3 | 45% | 45% | 68% | 28% |
| 2019 | 10.9 | 10.0 | 7.8 | 44% | 44% | 72% | 27% |
| 2020 | 10.9 | 9.9 | 8.1 | 40% | 40% | 74% | 26% |
| 2021 | 11.7 | 11.0 | 9.0 | 39% | 39% | 77% | 25% |
Centro (PT16)
Portugal · NUTS 2 · code PT16 · tier A · years 2015–2021
Findings
- DMC is 28.6 Mt or 12.8 t/cap in 2019, above the national level, rising from 11.8 (2015) to 13.9 t/cap (2021).
- Centro extracts more than it consumes: DE is 13.4 t/cap against AR of 11.9 t/cap (self-sufficiency 1.04). DE is marble 32%, granite 25% and roundwood 14%.
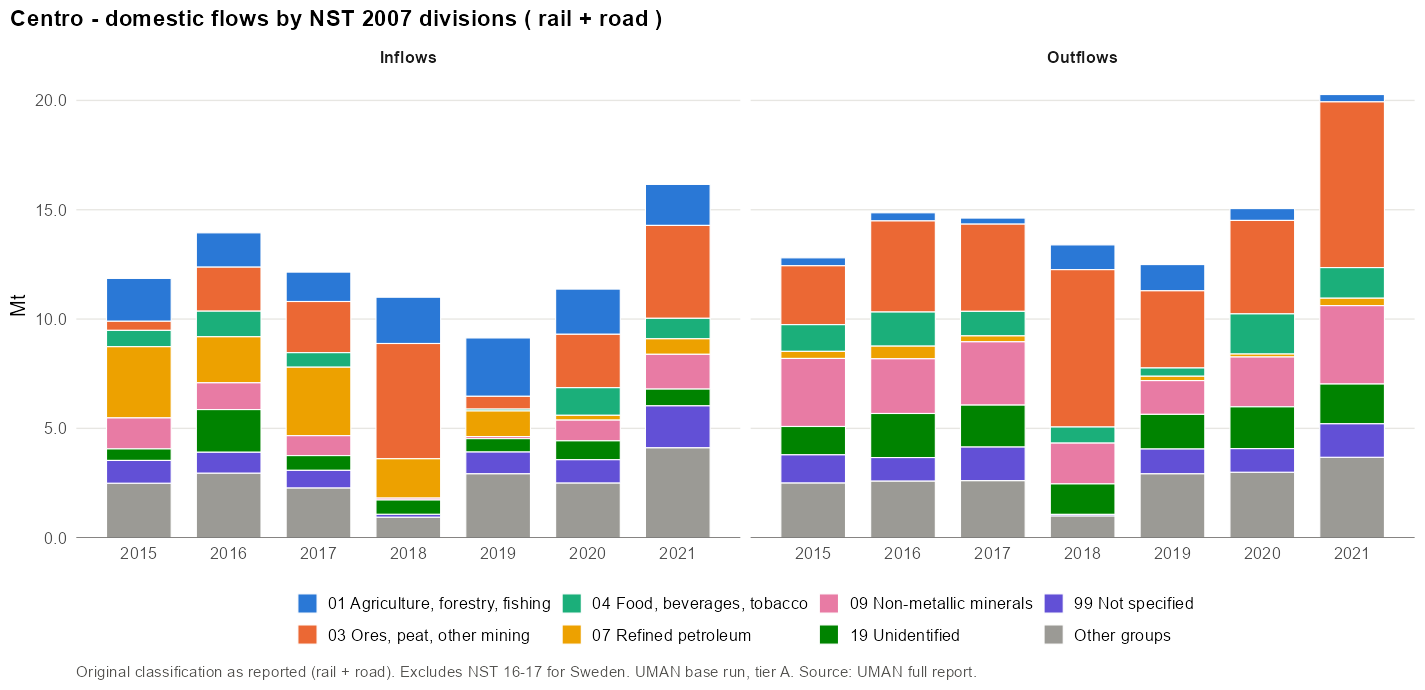
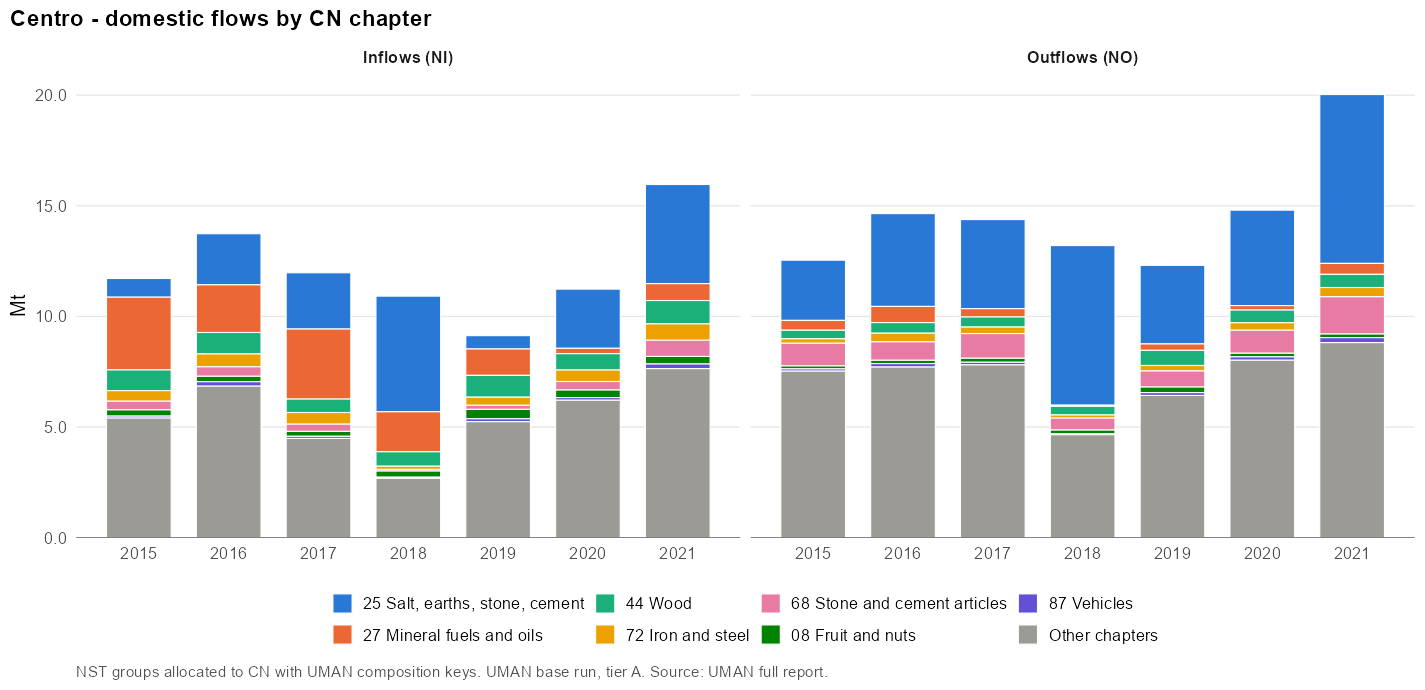
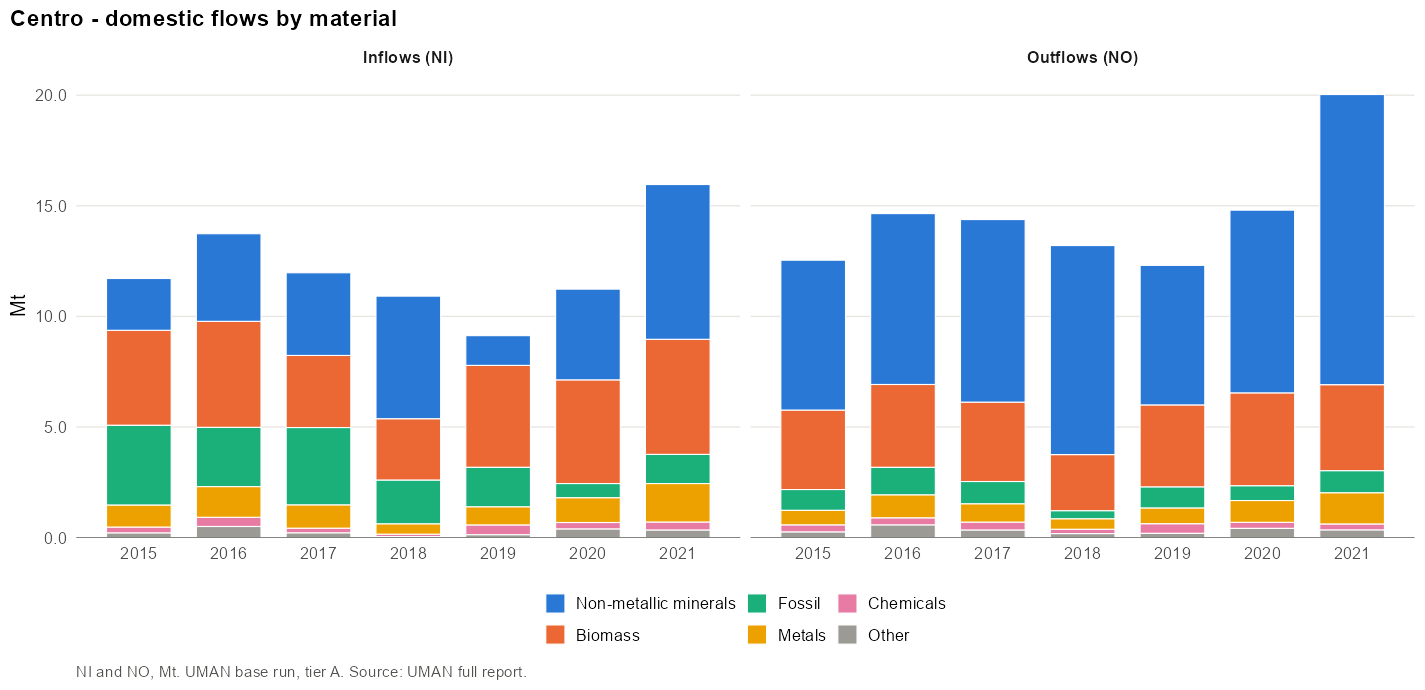
- The surplus leaves for the rest of Portugal: domestic outflows (12.3 Mt, led by marble, foundry binders and granite) exceed inflows (9.1 Mt). International trade is small (7.5 Mt in, 7.9 Mt out); chemical wood pulp is the main export (11%). International import dependency is 20%.
- DMC is 58% non-metallic minerals and 31% biomass. Building stone (6802) alone is 22%.
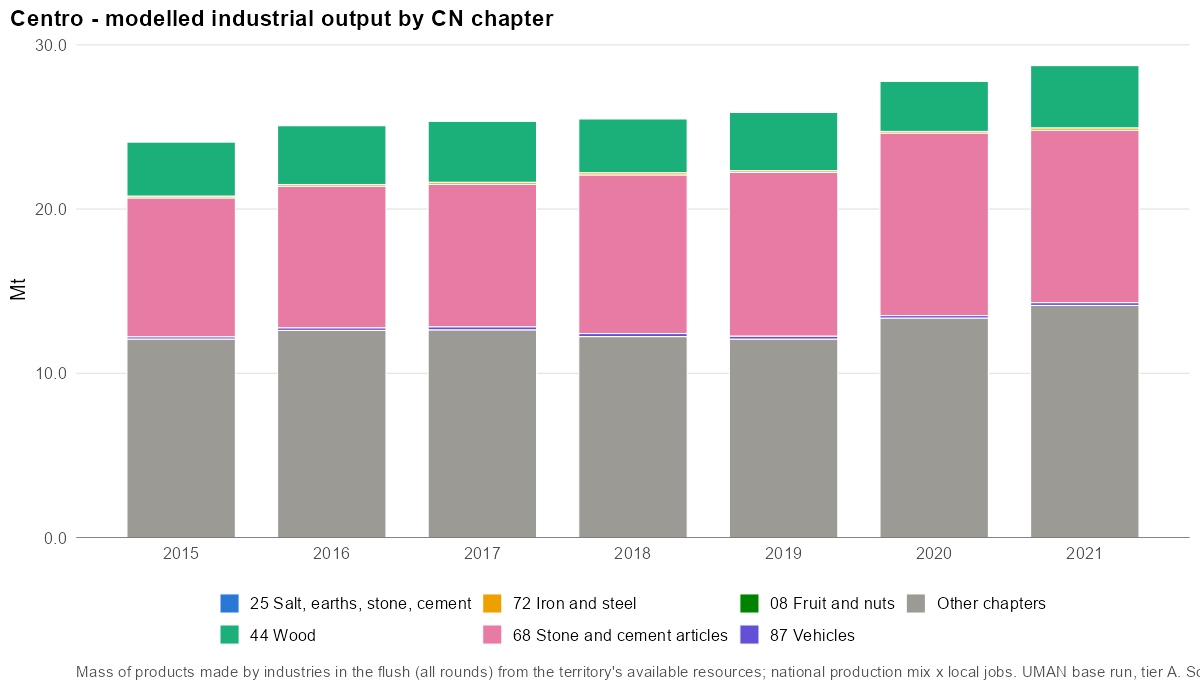
- Half of round-1 inputs (51%) are transformed, mainly by the non-metallic minerals industry (12 Mt of output) and the wood, paper and printing industries (9 Mt).
- Caveat: road freight tonnage jumps by about 60% in 2021, which drives part of the 2021 rise in DMC. The unbalanced share is 6.0%.
Overview
| 2015 | 2019 | 2021 | |
|---|---|---|---|
| Population | 2 272 517 | 2 226 188 | 2 239 686 |
| DE (Mt) | 26.3 | 29.8 | 32.5 |
| Imports M (Mt) | 6.2 | 7.5 | 8.7 |
| Exports X (Mt) | 7.5 | 7.9 | 8.8 |
| Domestic in NI (Mt) | 11.7 | 9.1 | 16.0 |
| Domestic out NO (Mt) | 12.5 | 12.3 | 20.0 |
| AR (Mt) | 24.4 | 26.5 | 28.6 |
| DMC (Mt) | 26.9 | 28.6 | 31.0 |
| DMC (t/cap) | 11.8 | 12.8 | 13.9 |
| Unbalanced (% of gross AR) | 7.3% | 6.0% | 6.5% |
Domestic extraction
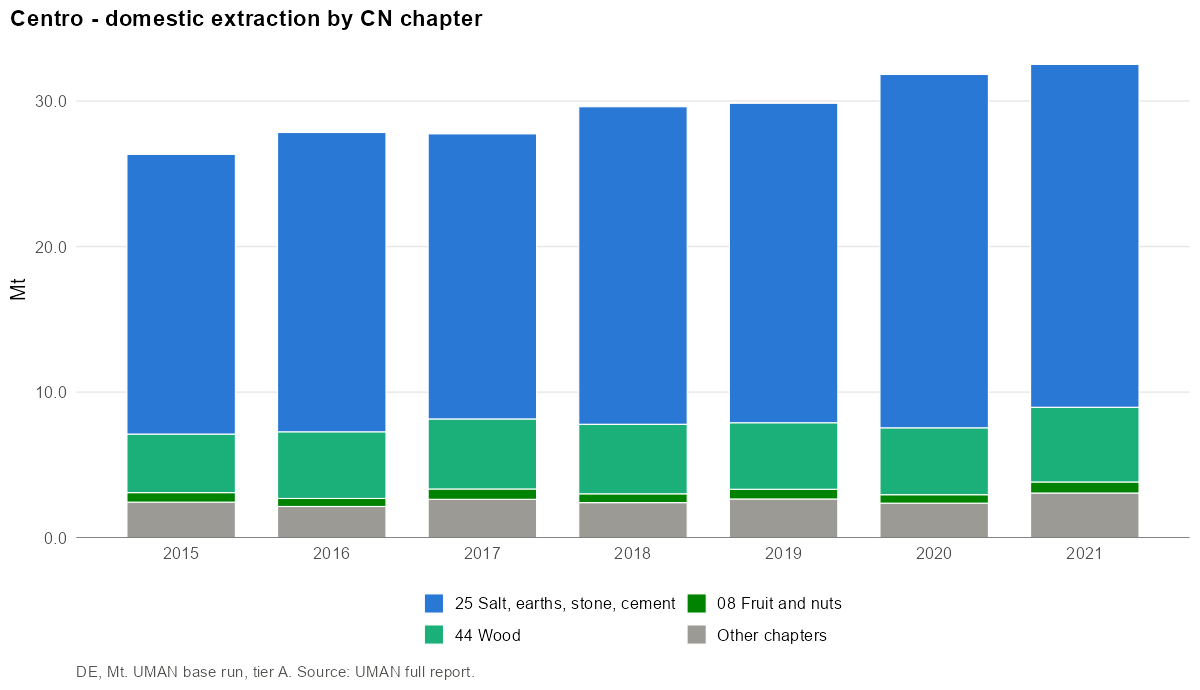
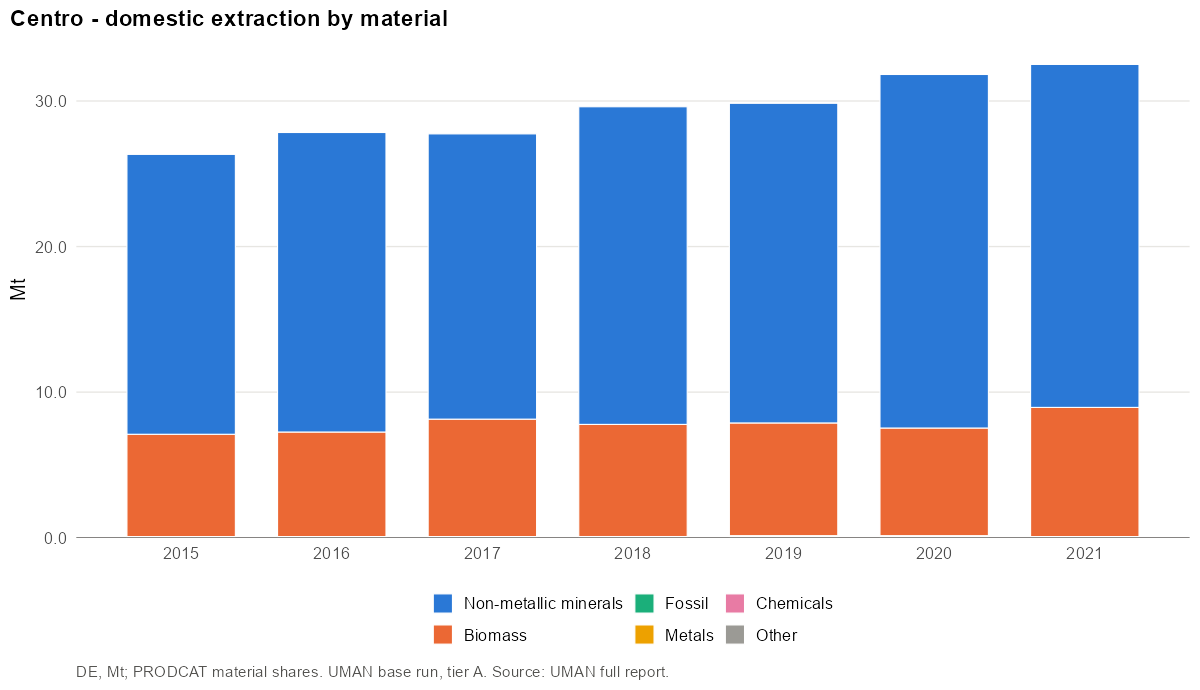
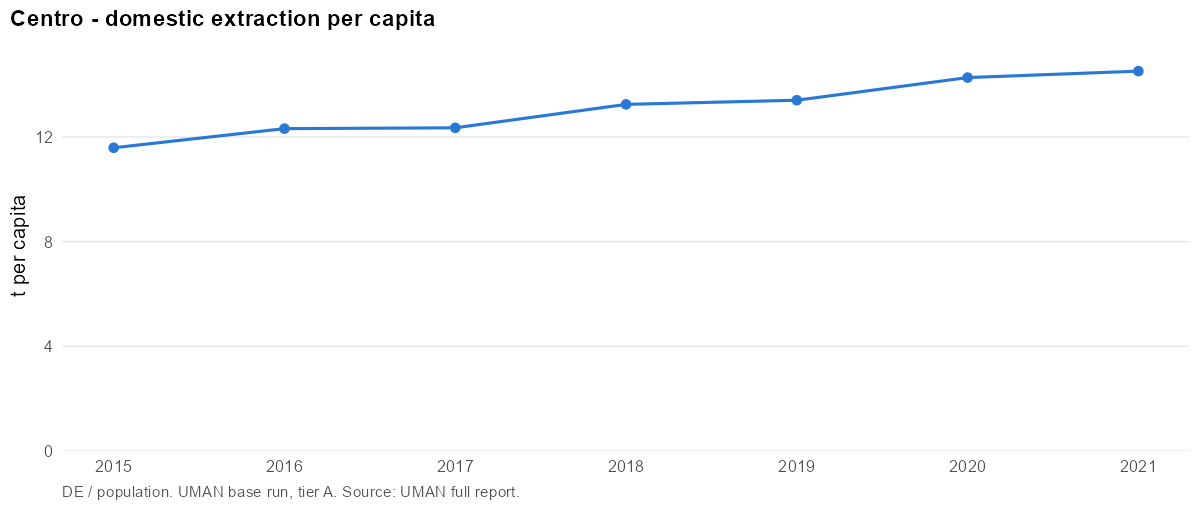
- Main CN4 codes (2019): 2515 Marble, travertine, ecaussine and other calcareous… (32%); 2516 Granite, porphyry, basalt, sandstone and other monumental… (25%); 4403 Wood in the rough, whether or not stripped of bark or… (14%); 2521 Limestone flux; limestone and other calcareous stone, of a… (6%); 2508 Clays, andalusite, kyanite and sillimanite, whether or not… (5%).
- Main materials: Stone (58%); Wood and wood fuels (15%); Agriculture biomass (7%).
International trade
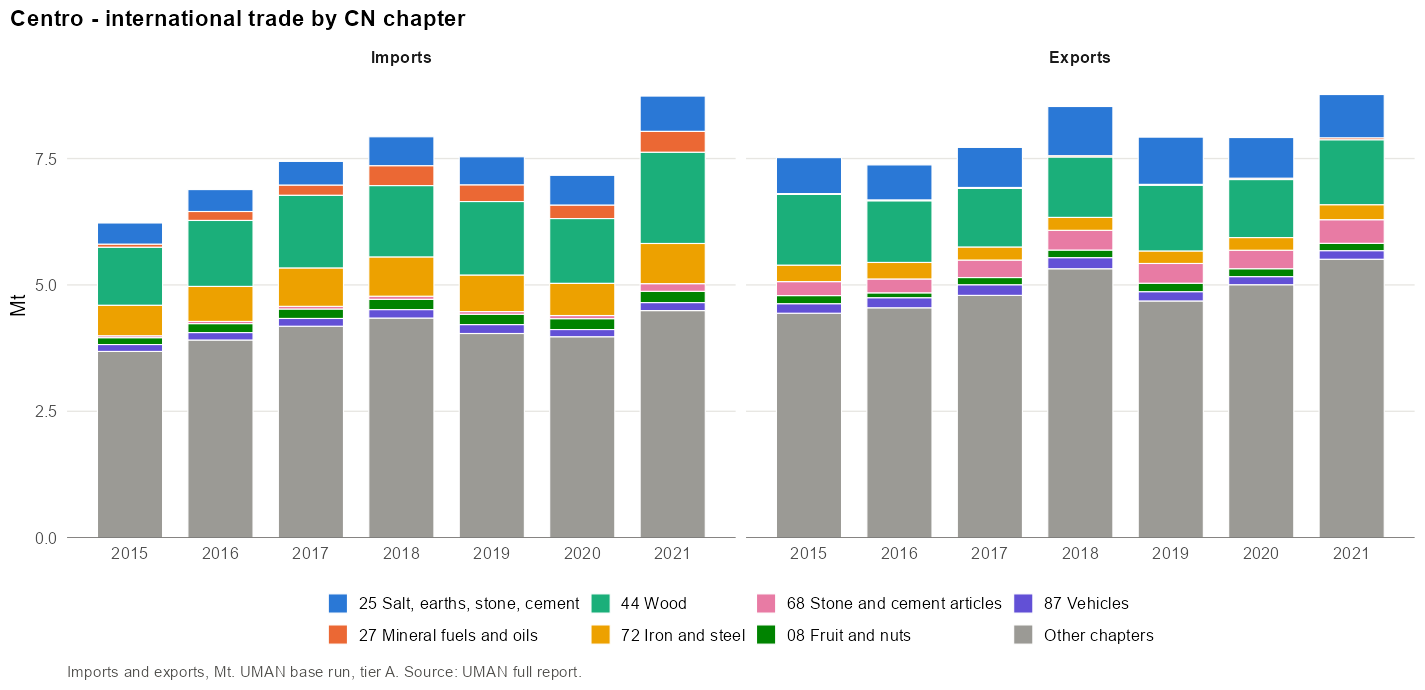
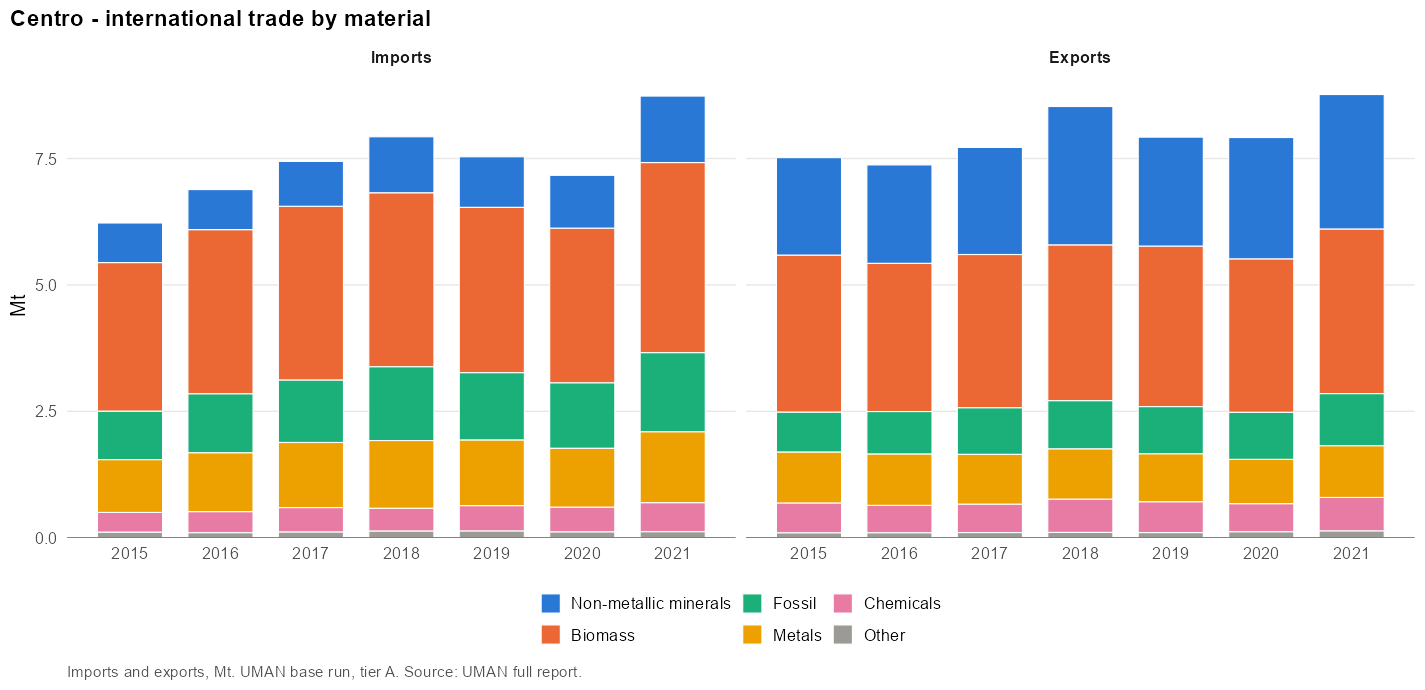
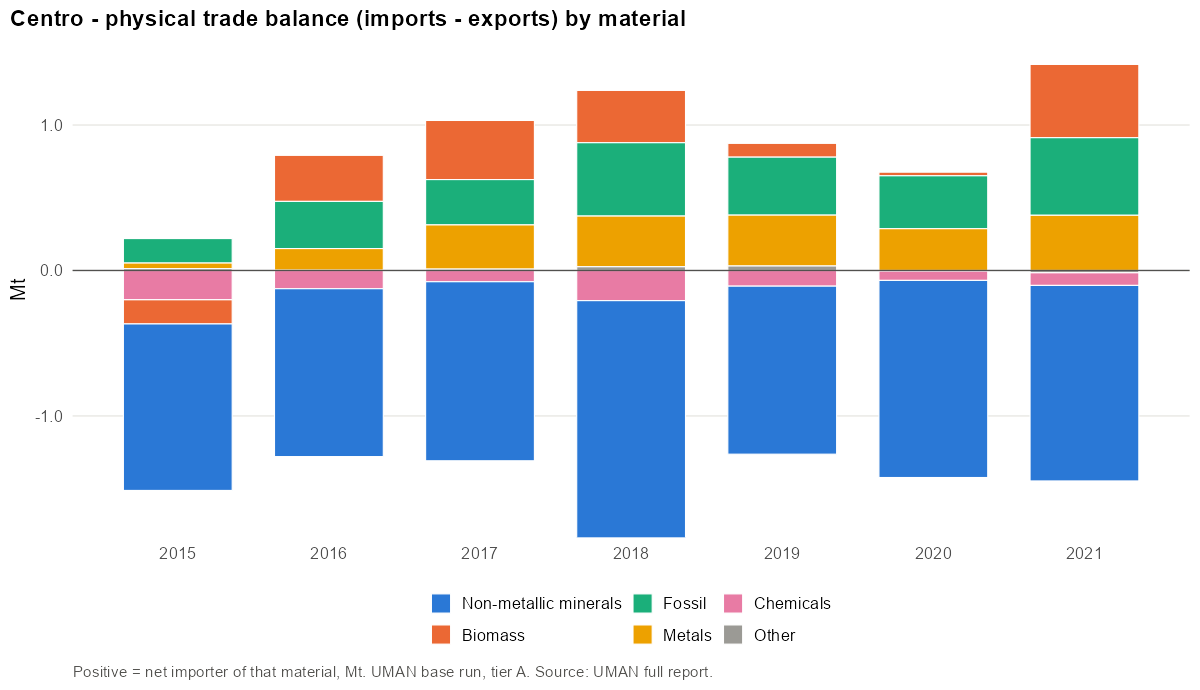
Imports:
- Main CN4 codes (2019): 4403 Wood in the rough, whether or not stripped of bark or… (7%); 4401 Fuel wood, in logs, billets, twigs, faggots or similar… (7%); 2710 Petroleum oils and oils obtained from bituminous minerals… (4%); 7001 Cullet and other waste and scrap of glass; glass in the… (3%); 0701 Potatoes, fresh or chilled (3%).
- Main materials: Wood and wood fuels (20%); Iron, steel and ferro-alloys (15%); Plastics and rubbers (12%).
Exports:
- Main CN4 codes (2019): 4703 Chemical wood pulp, soda or sulphate (excl. dissolving… (11%); 2515 Marble, travertine, ecaussine and other calcareous… (5%); 6907 Ceramic flags and paving, hearth or wall tiles; ceramic… (5%); 4401 Fuel wood, in logs, billets, twigs, faggots or similar… (5%); 4410 Particle board, oriented strand board ""OSB"" and similar… (4%).
- Main materials: Wood and wood fuels (26%); Clay (15%); Plastics and rubbers (11%).
Domestic movement of goods
Inflows:
- Main CN4 codes (2019): 2710 Petroleum oils and oils obtained from bituminous minerals… (9%); 4403 Wood in the rough, whether or not stripped of bark or… (6%); 1005 Maize or corn (6%); 2711 Petroleum gas and other gaseous hydrocarbons (3%); 3824 Prepared binders for foundry moulds or cores; chemical… (3%).
- Main materials: Agriculture biomass (26%); Wood and wood fuels (14%); Fuels (9%).
Outflows:
- Main CN4 codes (2019): 2515 Marble, travertine, ecaussine and other calcareous… (12%); 3824 Prepared binders for foundry moulds or cores; chemical… (10%); 2516 Granite, porphyry, basalt, sandstone and other monumental… (10%); 1209 Seeds, fruits and spores, for sowing (excl. leguminous… (4%); 6810 Articles of cement, concrete or artificial stone, whether… (3%).
- Main materials: Stone (31%); Agriculture biomass (13%); Sand (9%).
Available resources
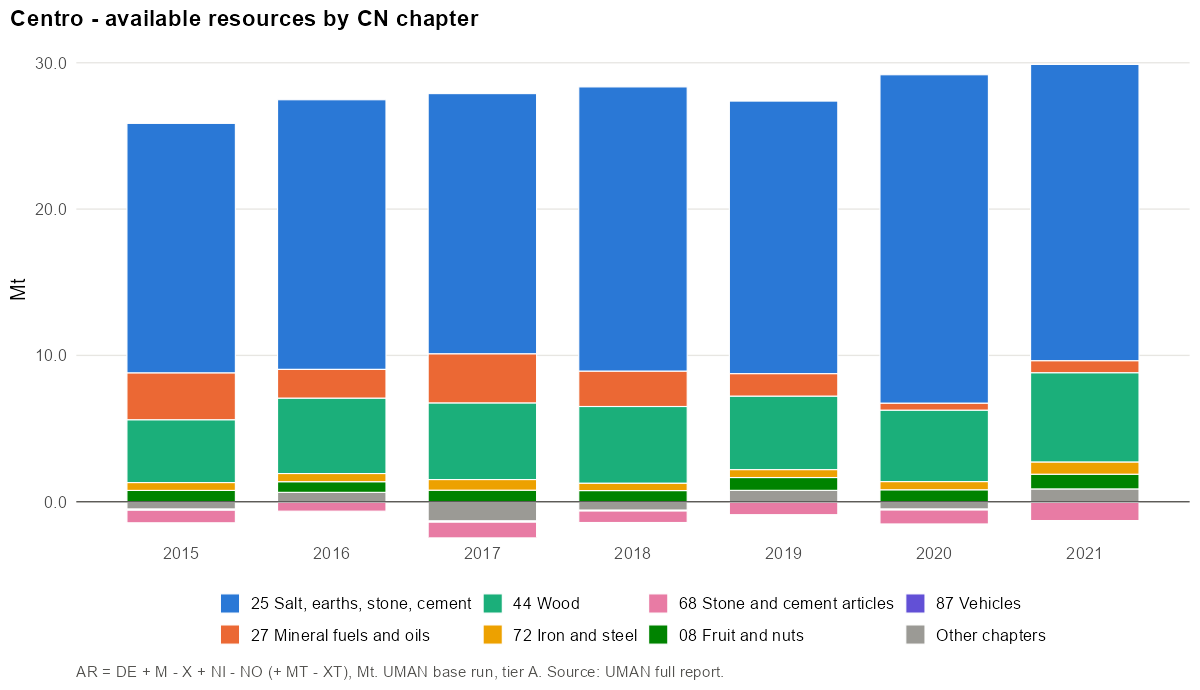
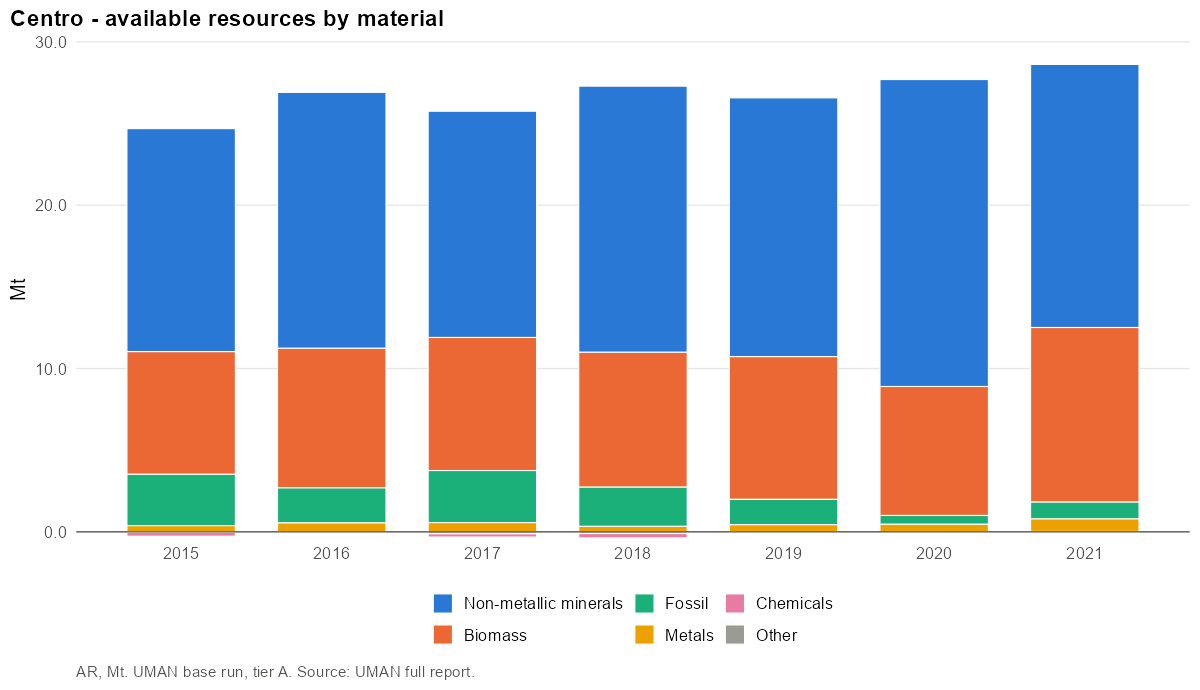
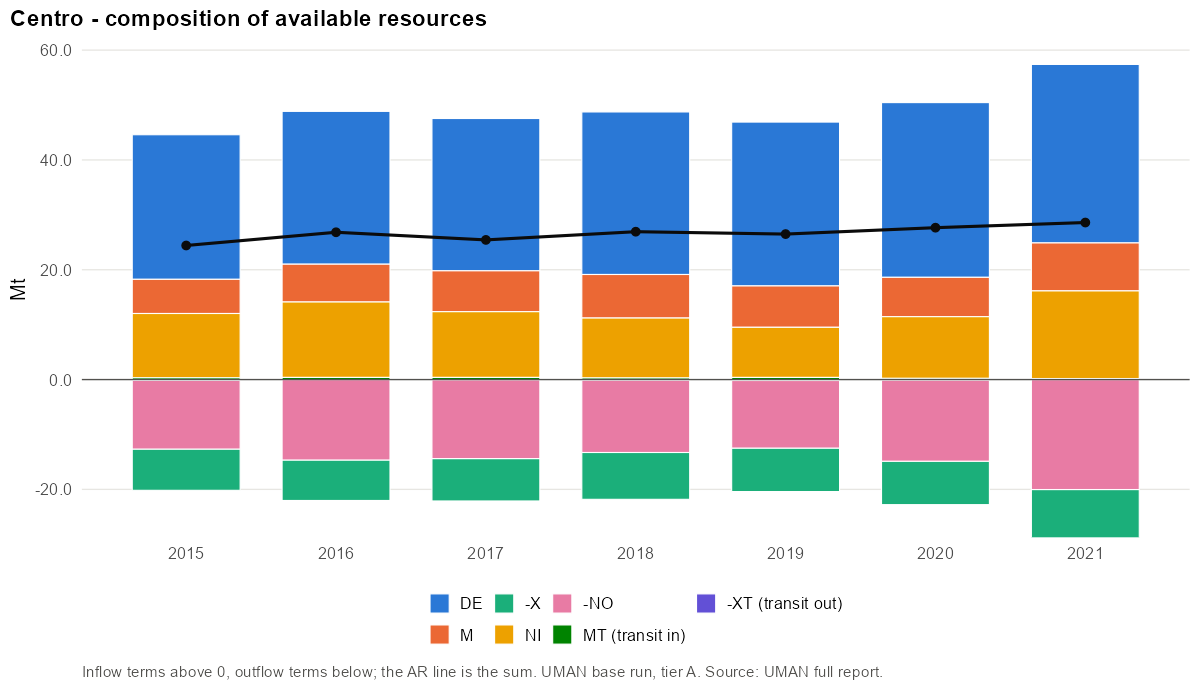
- Main CN4 codes (2019): 2515 Marble, travertine, ecaussine and other calcareous… (30%); 2516 Granite, porphyry, basalt, sandstone and other monumental… (24%); 4403 Wood in the rough, whether or not stripped of bark or… (18%); 2521 Limestone flux; limestone and other calcareous stone, of a… (6%); 2710 Petroleum oils and oils obtained from bituminous minerals… (4%).
- Main materials: Stone (51%); Wood and wood fuels (17%); Agriculture biomass (12%).
Industrial production
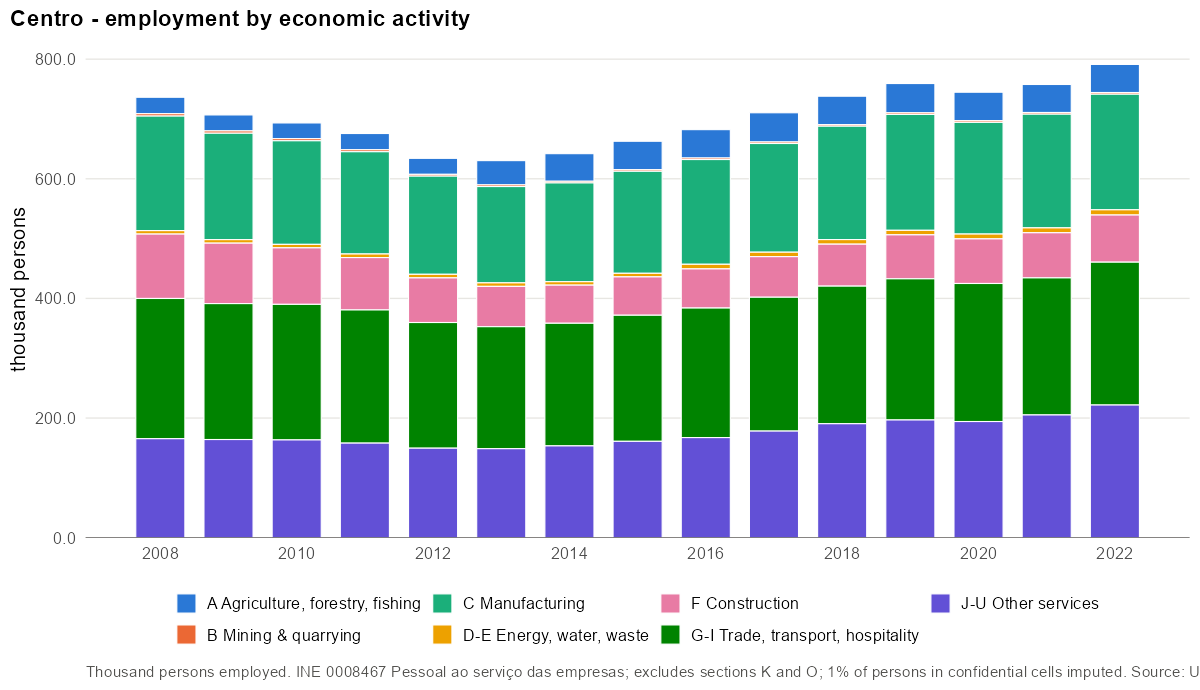
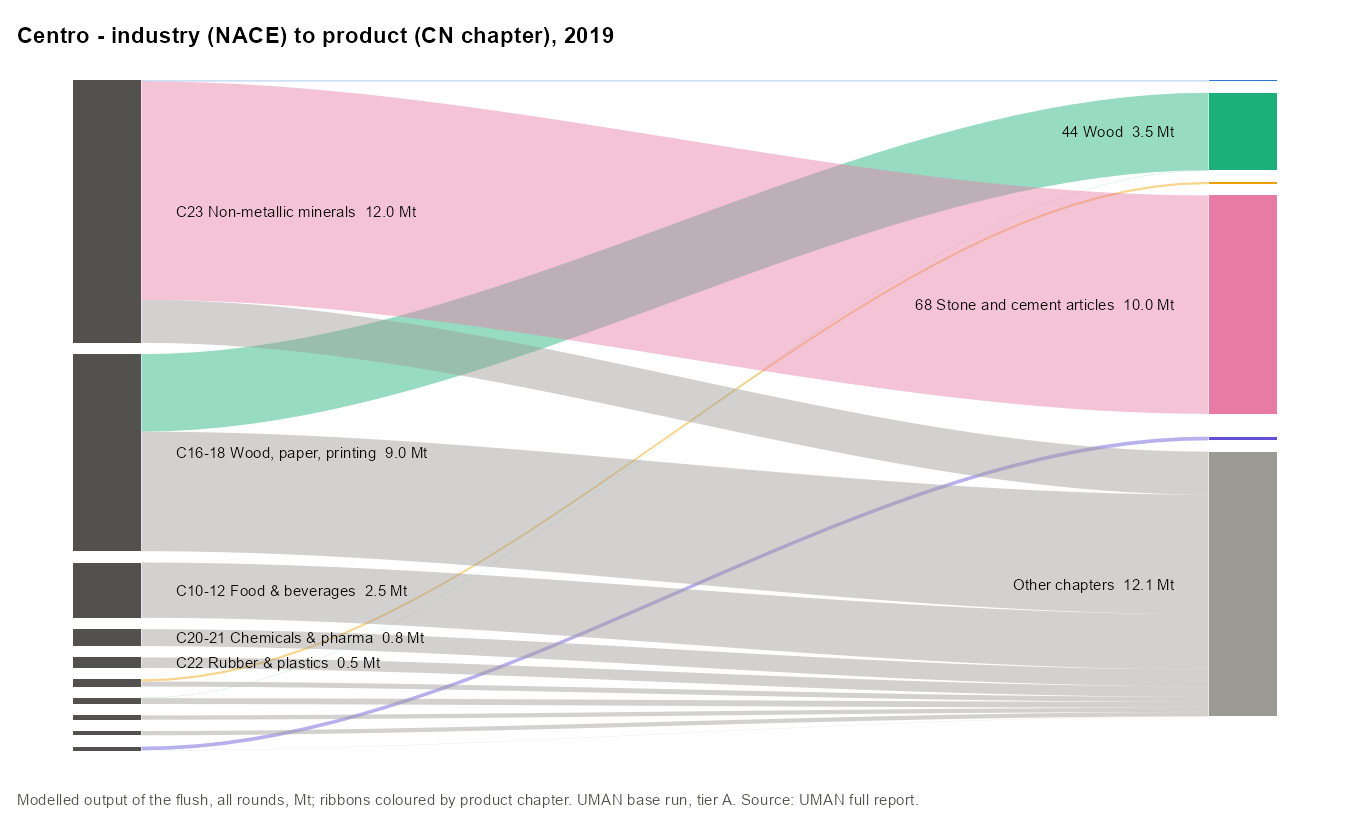
Largest employers (NACE divisions):
| NACE | Activity | Persons | Share |
|---|---|---|---|
| 47 | Retail trade, except of motor vehicles and motorcycles | 71 308 | 9.4% |
| 46 | Wholesale trade, except of motor vehicles and motorcycles | 50 413 | 6.6% |
| 56 | Food and beverage service activities | 41 447 | 5.5% |
| 01 | Crop and animal production, hunting and related service activities | 39 248 | 5.2% |
| 25 | Manufacture of fabricated metal products, except machinery and equipment | 36 262 | 4.8% |
| 41 | Construction of buildings | 33 446 | 4.4% |
| 43 | Specialised construction activities | 32 565 | 4.3% |
| 82 | Office administrative, office support and other business support activities | 32 121 | 4.2% |
Product transformation
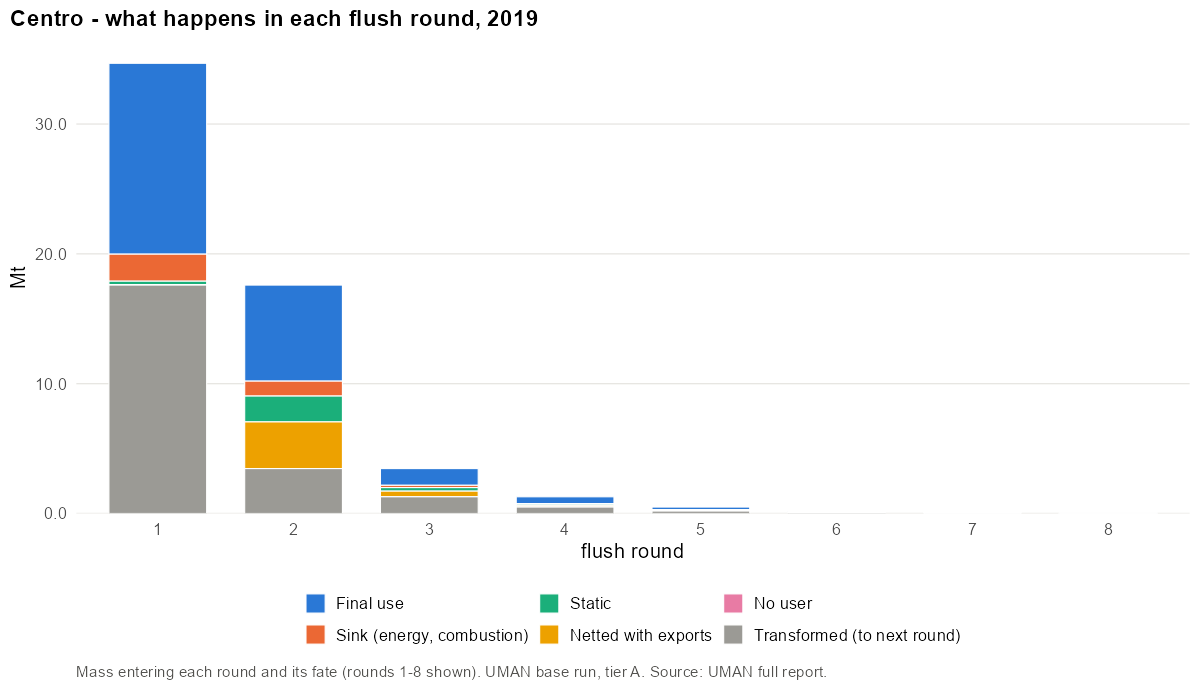
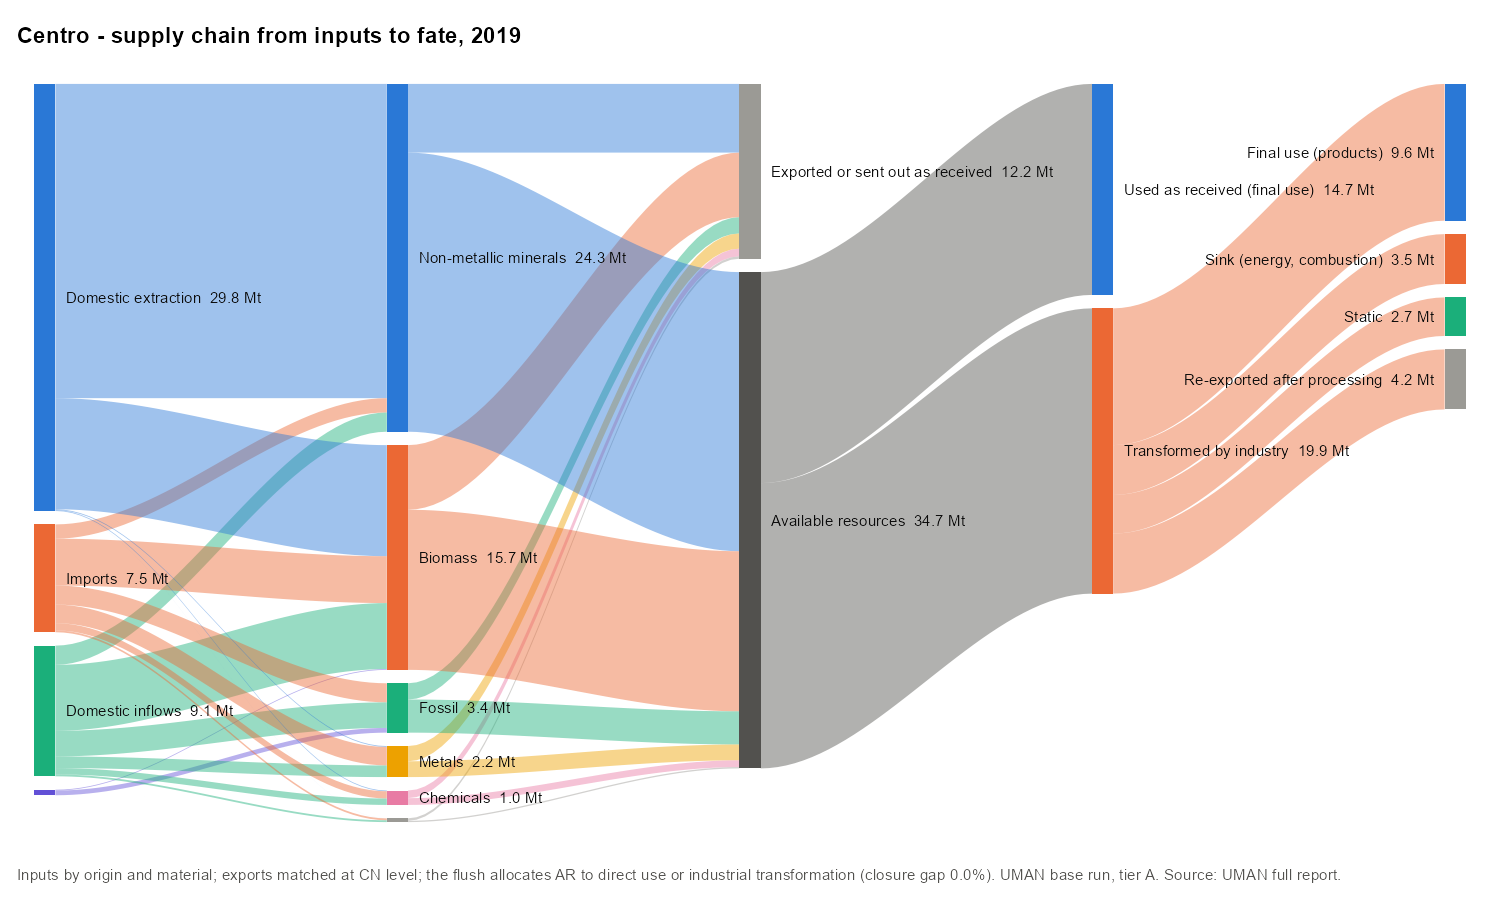
The flush needed 13 rounds. Round 1 handled 34.7 Mt; 51% of it was transformed into other products and re-entered round 2.
Domestic material consumption
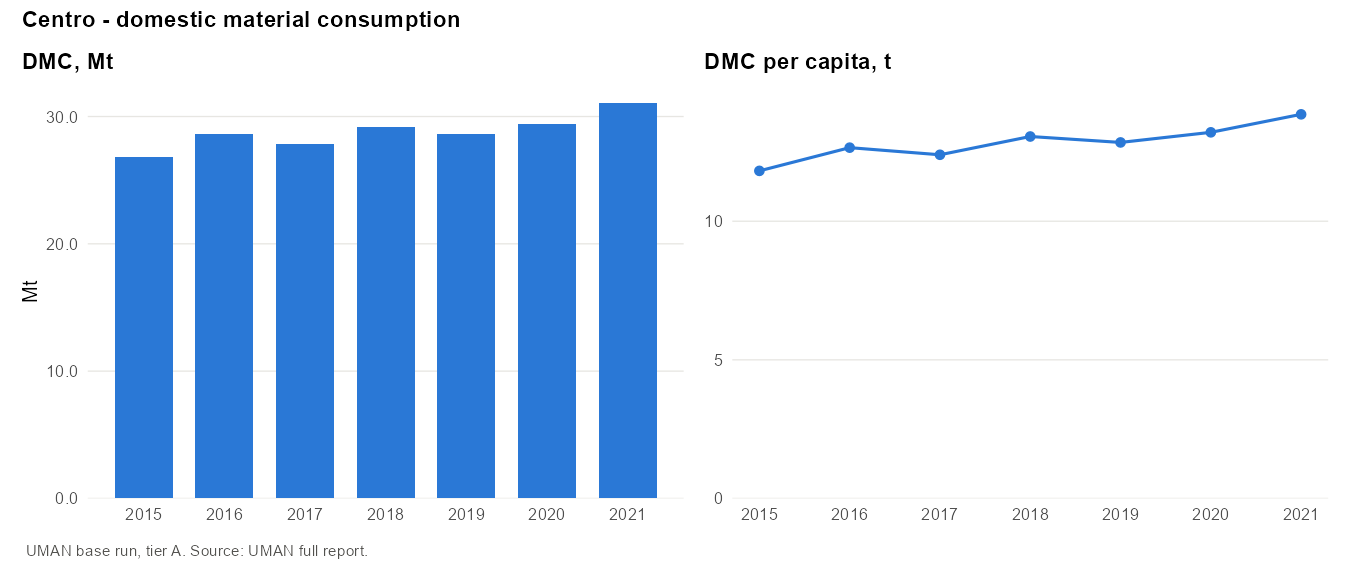
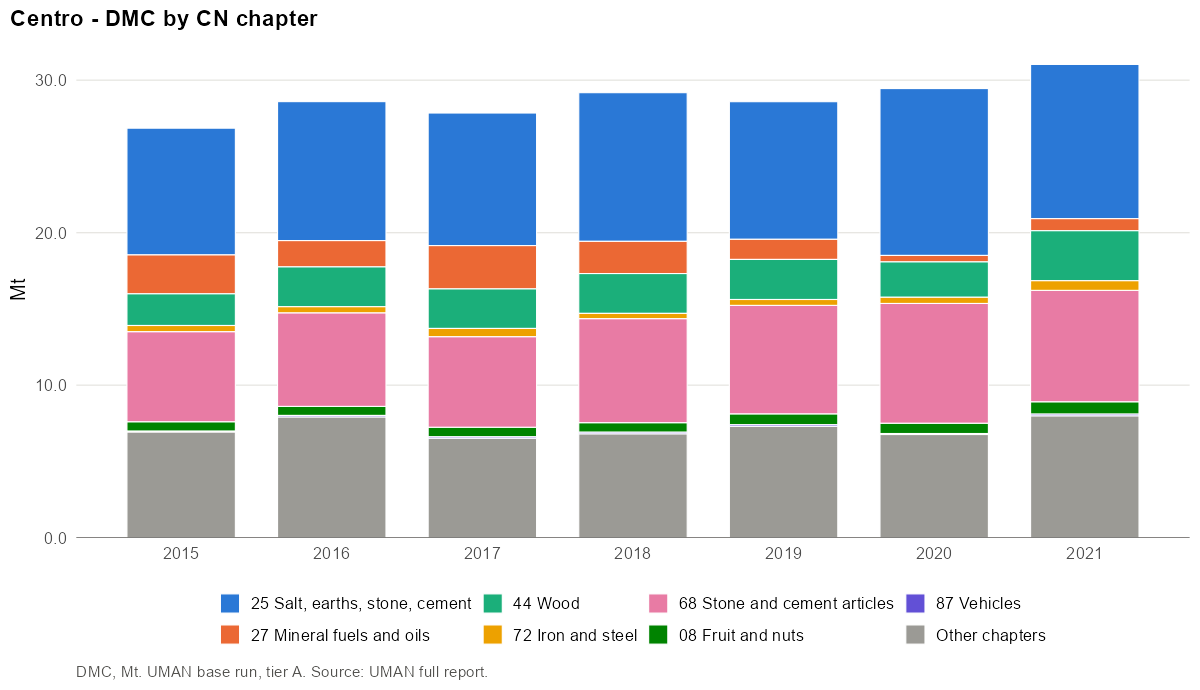
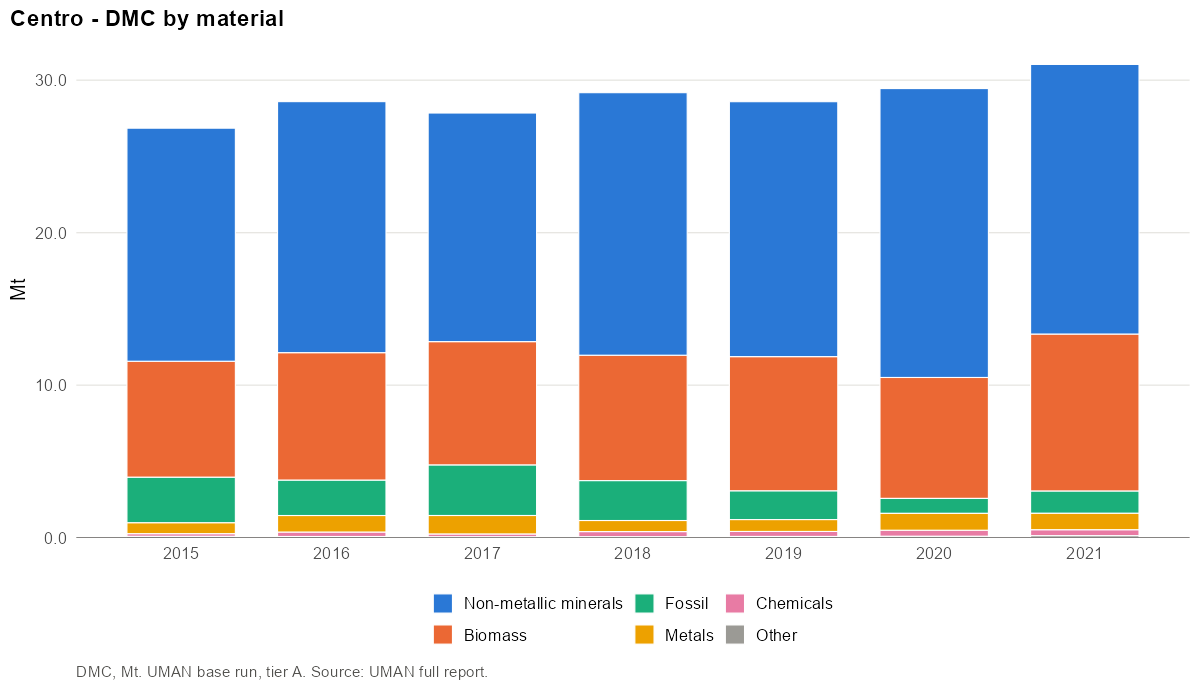
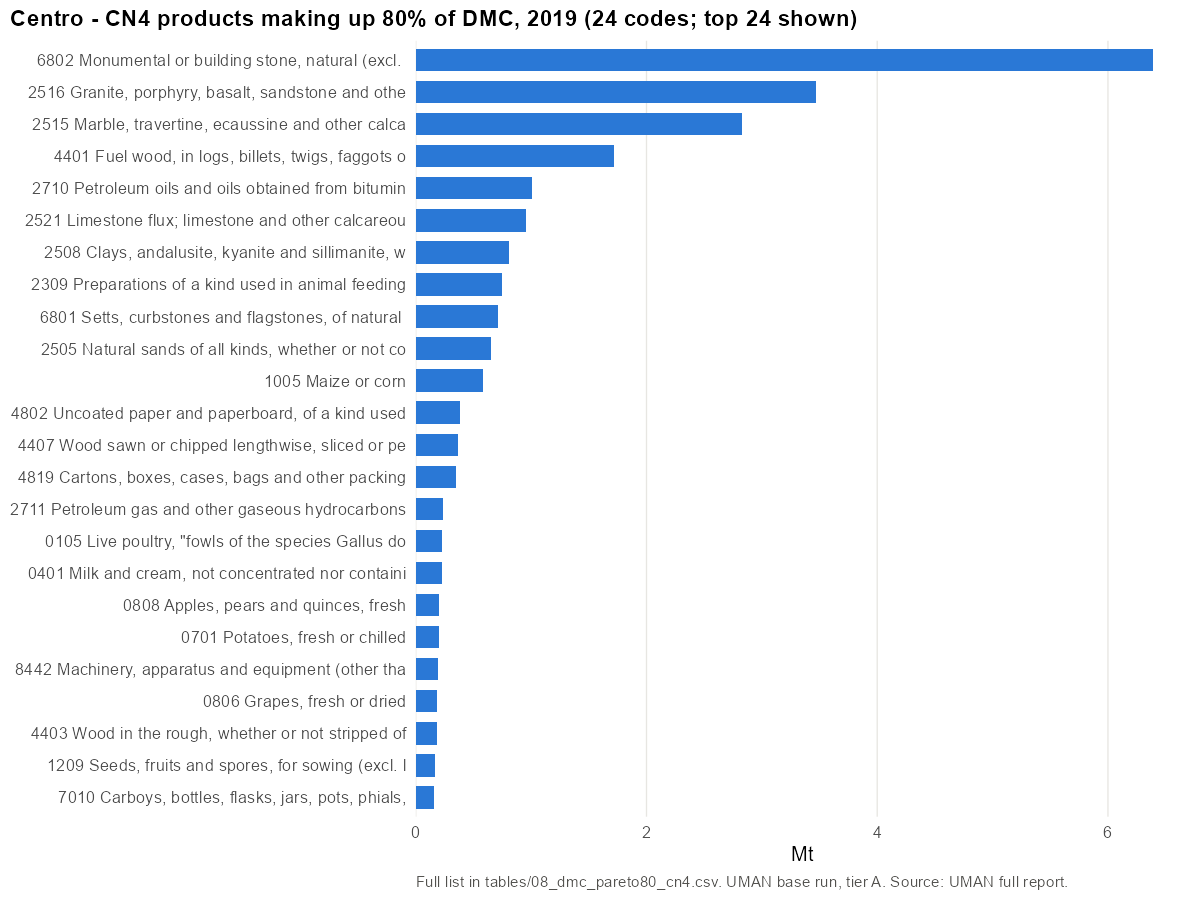
- Main CN4 codes (2019): 6802 Monumental or building stone, natural (excl. slate)… (22%); 2516 Granite, porphyry, basalt, sandstone and other monumental… (12%); 2515 Marble, travertine, ecaussine and other calcareous… (10%); 4401 Fuel wood, in logs, billets, twigs, faggots or similar… (6%); 2710 Petroleum oils and oils obtained from bituminous minerals… (4%).
- Main materials: Stone (47%); Agriculture biomass (11%); Wood and wood fuels (10%).
24 CN4 codes make up 80% of DMC in 2019. Top 10:
| Rank | CN4 | Product | Mt | Share | Cumulative |
|---|---|---|---|---|---|
| 1 | 6802 | Monumental or building stone, natural (excl. slate)… | 6.39 | 22.3% | 22% |
| 2 | 2516 | Granite, porphyry, basalt, sandstone and other monumental… | 3.47 | 12.1% | 34% |
| 3 | 2515 | Marble, travertine, ecaussine and other calcareous… | 2.83 | 9.9% | 44% |
| 4 | 4401 | Fuel wood, in logs, billets, twigs, faggots or similar… | 1.71 | 6.0% | 50% |
| 5 | 2710 | Petroleum oils and oils obtained from bituminous minerals… | 1.01 | 3.5% | 54% |
| 6 | 2521 | Limestone flux; limestone and other calcareous stone, of a… | 0.95 | 3.3% | 57% |
| 7 | 2508 | Clays, andalusite, kyanite and sillimanite, whether or not… | 0.80 | 2.8% | 60% |
| 8 | 2309 | Preparations of a kind used in animal feeding | 0.75 | 2.6% | 63% |
| 9 | 6801 | Setts, curbstones and flagstones, of natural stone (excl.… | 0.71 | 2.5% | 65% |
| 10 | 2505 | Natural sands of all kinds, whether or not coloured (excl.… | 0.65 | 2.3% | 67% |
Metrics
| Year | DMC/cap | AR/cap | DE/cap | Import dep. | Intl import dep. | Self-suff. | Export int. |
|---|---|---|---|---|---|---|---|
| 2015 | 11.8 | 10.7 | 11.6 | 41% | 19% | 98% | 45% |
| 2016 | 12.7 | 11.9 | 12.3 | 43% | 20% | 97% | 45% |
| 2017 | 12.4 | 11.3 | 12.3 | 42% | 21% | 100% | 47% |
| 2018 | 13.1 | 12.0 | 13.2 | 39% | 21% | 101% | 45% |
| 2019 | 12.8 | 11.9 | 13.4 | 36% | 20% | 104% | 43% |
| 2020 | 13.2 | 12.4 | 14.3 | 37% | 18% | 108% | 45% |
| 2021 | 13.9 | 12.8 | 14.5 | 43% | 21% | 105% | 50% |
Região de Coimbra (PT16E)
Portugal · NUTS 3 · code PT16E · tier C · years 2015–2021
Findings
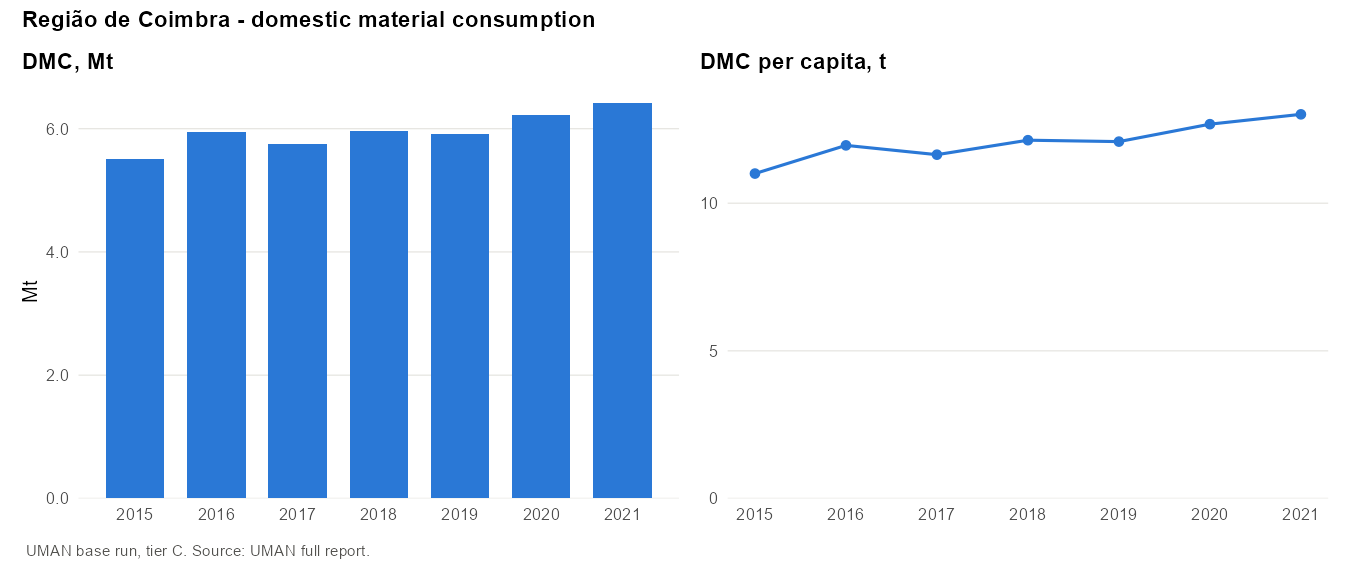
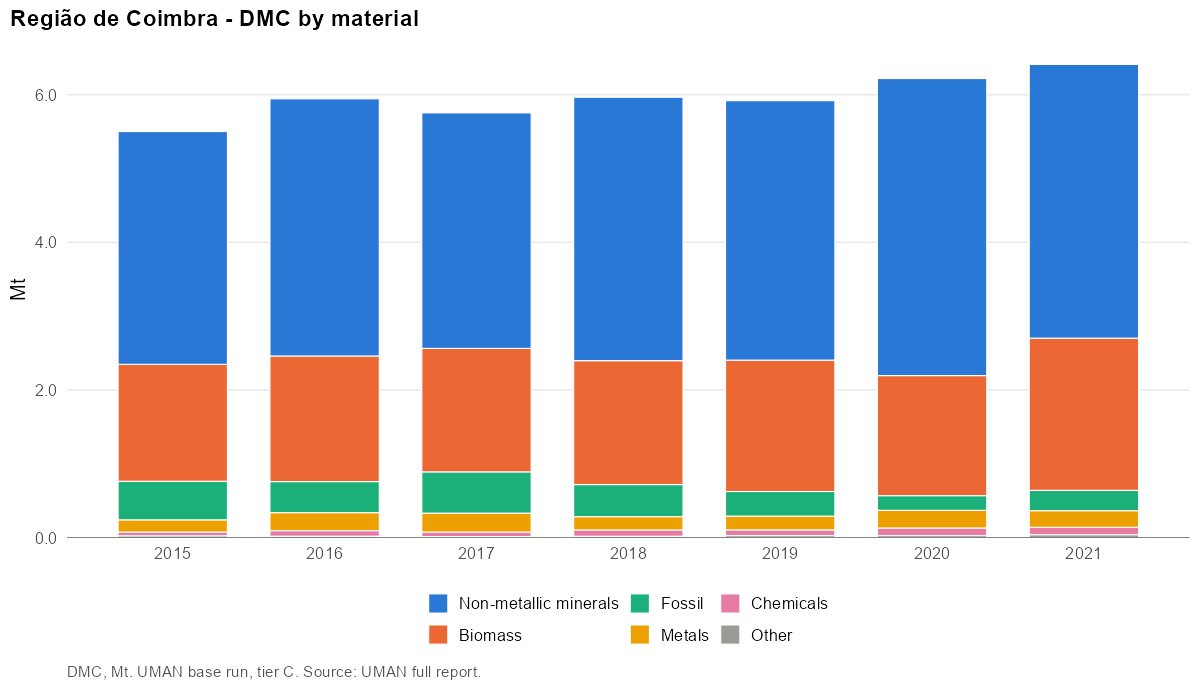
- Coimbra is tier C: its DMC (5.9 Mt, 12.1 t/cap in 2019) is Centro's DMC distributed by consumer jobs. Its composition (59% non-metallic minerals, 30% biomass) is Centro's by construction.
- Population needs checking: the workbook gives 489,761 inhabitants against 439,542 in Eurostat for PT16E (2019). With the Eurostat figure, DMC would be about 13.4 t/cap instead of 12.1.
- Employment (137,700 persons in 2019) has many confidential cells: 15–31% of persons are imputed depending on the year.
- A profile of its own needs its own data: extraction (quarries and forests in the region), trade and freight for the NUTS 3 area.
Overview
| 2015 | 2019 | 2021 | |
|---|---|---|---|
| Population | 499 954 | 489 761 | 492 731 |
| DE (Mt) | – | – | – |
| Imports M (Mt) | – | – | – |
| Exports X (Mt) | – | – | – |
| Domestic in NI (Mt) | – | – | – |
| Domestic out NO (Mt) | – | – | – |
| AR (Mt) | – | – | – |
| DMC (Mt) | 5.5 | 5.9 | 6.4 |
| DMC (t/cap) | 11.0 | 12.1 | 13.0 |
| Unbalanced (% of gross AR) | – | – | – |
Domestic extraction
Tier C: the DMC is downscaled from the parent; no own DE, trade or domestic-flow accounts.
- Main CN4 codes (2019): NA NA (–).
- Main materials: NA (–).
International trade
Tier C: the DMC is downscaled from the parent; no own DE, trade or domestic-flow accounts.
Imports:
- Main CN4 codes (2019): NA NA (–).
- Main materials: NA (–).
Exports:
- Main CN4 codes (2019): NA NA (–).
- Main materials: NA (–).
Domestic movement of goods
Tier C: the DMC is downscaled from the parent; no own DE, trade or domestic-flow accounts.
Available resources
Tier C: the DMC is downscaled from the parent; no own DE, trade or domestic-flow accounts.
- Main CN4 codes (2019): NA NA (–).
- Main materials: NA (–).
Industrial production
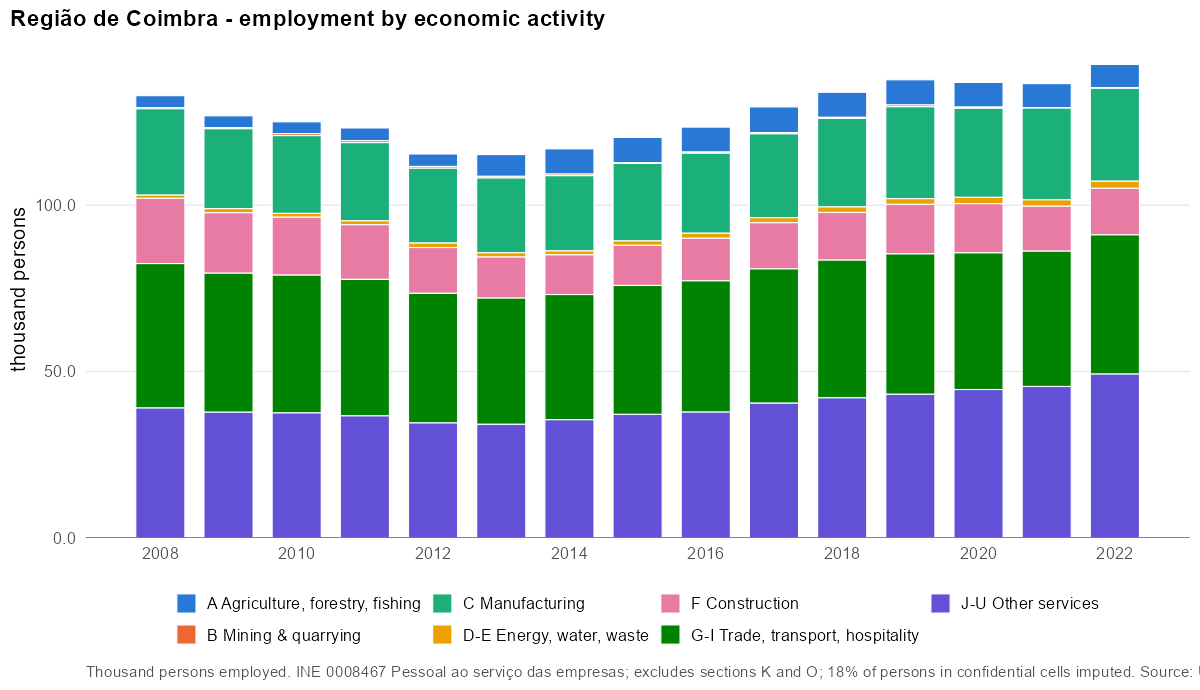
Tier C: no run of its own.
Largest employers (NACE divisions):
| NACE | Activity | Persons | Share |
|---|---|---|---|
| 47 | Retail trade, except of motor vehicles and motorcycles | 13 472 | 9.8% |
| 86 | Human health activities | 8 382 | 6.1% |
| 56 | Food and beverage service activities | 8 305 | 6.0% |
| 43 | Specialised construction activities | 7 838 | 5.7% |
| 46 | Wholesale trade, except of motor vehicles and motorcycles | 7 004 | 5.1% |
| 82 | Office administrative, office support and other business support activities | 6 623 | 4.8% |
| 10 | Manufacture of food products | 6 553 | 4.8% |
| 41 | Construction of buildings | 6 255 | 4.5% |
Product transformation
Tier C: no flush of its own.
Domestic material consumption
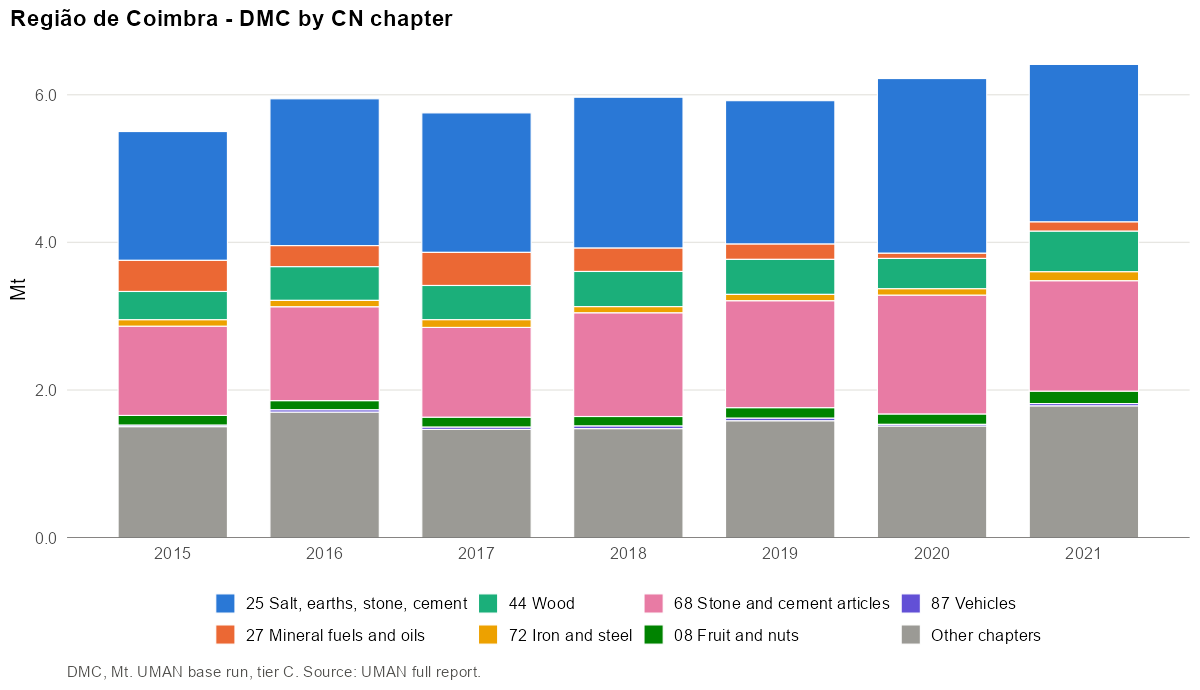
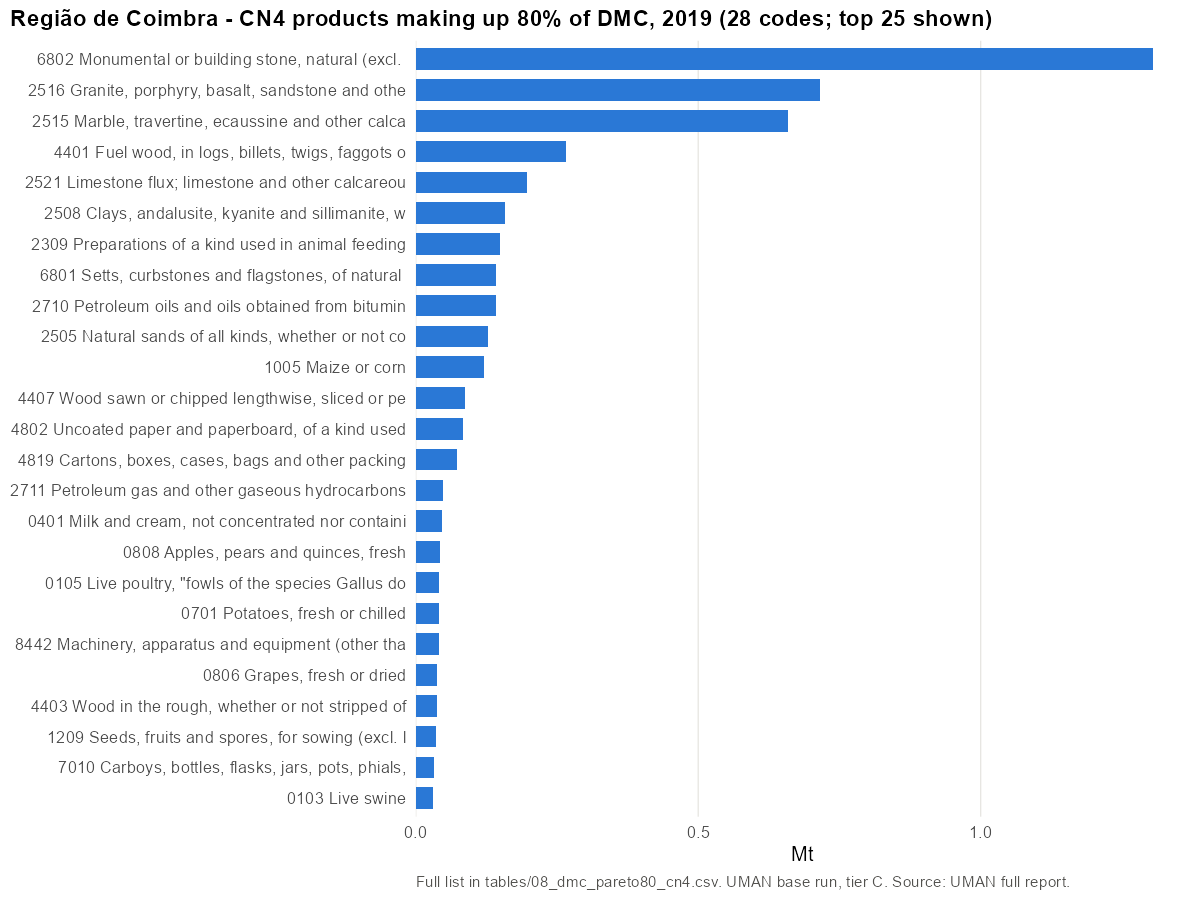
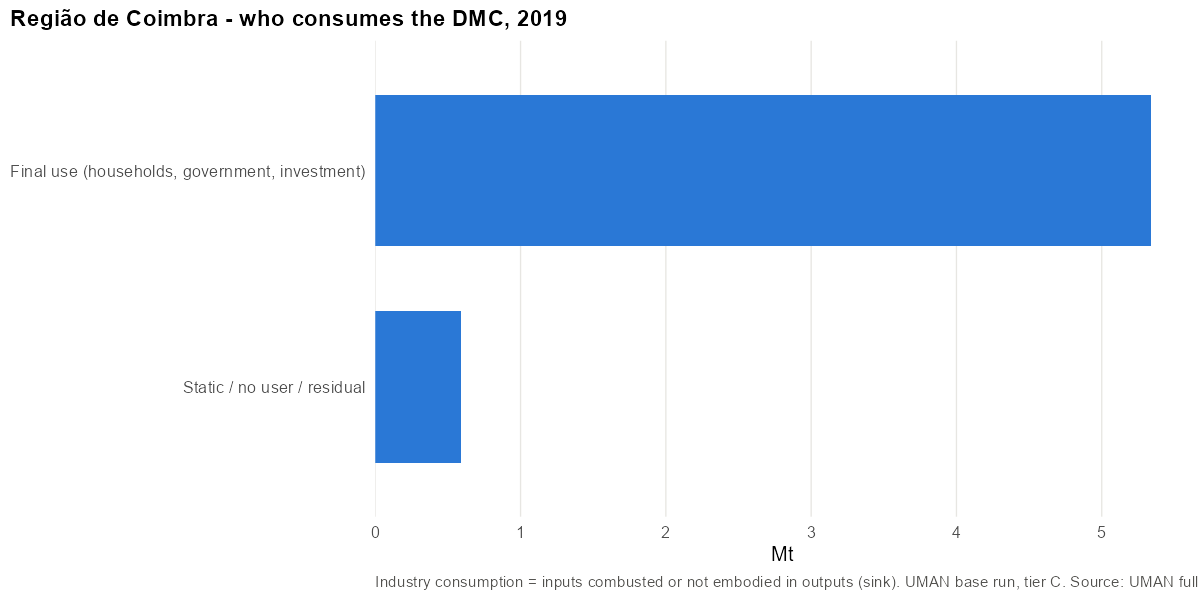
- Main CN4 codes (2019): 6802 Monumental or building stone, natural (excl. slate)… (22%); 2516 Granite, porphyry, basalt, sandstone and other monumental… (12%); 2515 Marble, travertine, ecaussine and other calcareous… (11%); 4401 Fuel wood, in logs, billets, twigs, faggots or similar… (5%); 2521 Limestone flux; limestone and other calcareous stone, of a… (3%).
- Main materials: Stone (48%); Agriculture biomass (11%); Wood and wood fuels (9%).
28 CN4 codes make up 80% of DMC in 2019. Top 10:
| Rank | CN4 | Product | Mt | Share | Cumulative |
|---|---|---|---|---|---|
| 1 | 6802 | Monumental or building stone, natural (excl. slate)… | 1.30 | 22.0% | 22% |
| 2 | 2516 | Granite, porphyry, basalt, sandstone and other monumental… | 0.72 | 12.1% | 34% |
| 3 | 2515 | Marble, travertine, ecaussine and other calcareous… | 0.66 | 11.1% | 45% |
| 4 | 4401 | Fuel wood, in logs, billets, twigs, faggots or similar… | 0.27 | 4.5% | 50% |
| 5 | 2521 | Limestone flux; limestone and other calcareous stone, of a… | 0.20 | 3.3% | 53% |
| 6 | 2508 | Clays, andalusite, kyanite and sillimanite, whether or not… | 0.16 | 2.7% | 56% |
| 7 | 2309 | Preparations of a kind used in animal feeding | 0.15 | 2.5% | 58% |
| 8 | 6801 | Setts, curbstones and flagstones, of natural stone (excl.… | 0.14 | 2.4% | 61% |
| 9 | 2710 | Petroleum oils and oils obtained from bituminous minerals… | 0.14 | 2.4% | 63% |
| 10 | 2505 | Natural sands of all kinds, whether or not coloured (excl.… | 0.13 | 2.2% | 65% |
Metrics
| Year | DMC/cap | AR/cap | DE/cap | Import dep. | Intl import dep. | Self-suff. | Export int. |
|---|---|---|---|---|---|---|---|
| 2015 | 11.0 | – | – | – | – | – | – |
| 2016 | 12.0 | – | – | – | – | – | – |
| 2017 | 11.6 | – | – | – | – | – | – |
| 2018 | 12.1 | – | – | – | – | – | – |
| 2019 | 12.1 | – | – | – | – | – | – |
| 2020 | 12.7 | – | – | – | – | – | – |
| 2021 | 13.0 | – | – | – | – | – | – |
Rest of Portugal (PT - PT16)
Portugal · rest-of · code PT-PT16 · rest (PT - PT16) · years 2015–2021
Findings
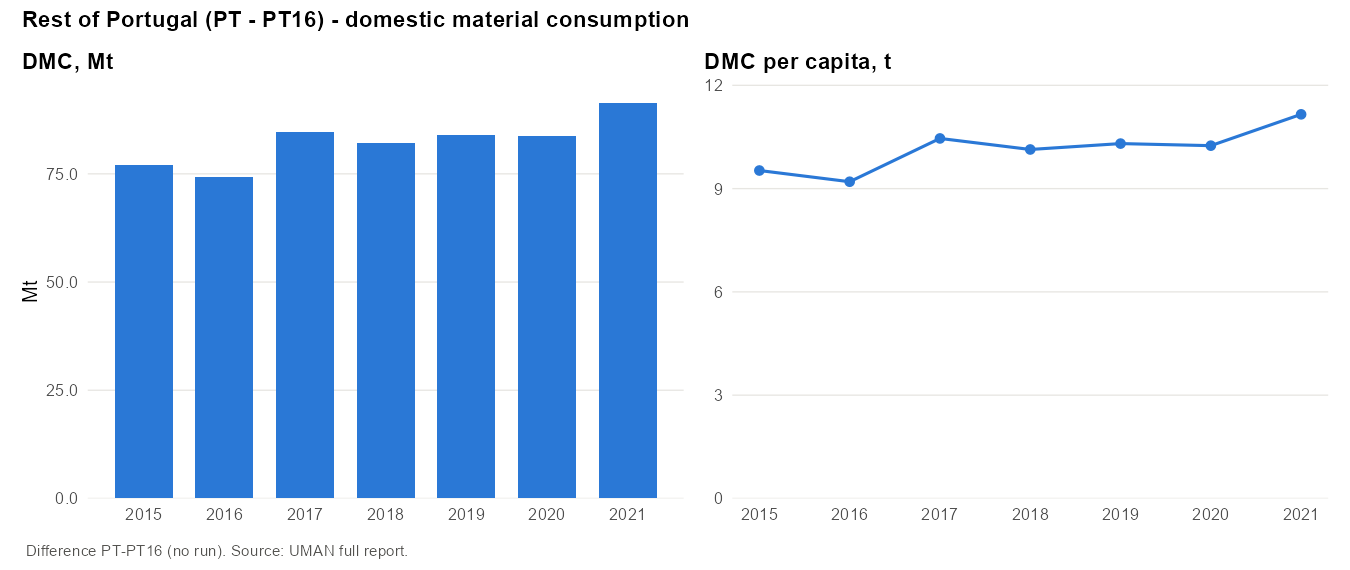
- Portugal without Centro (8.15 million people) consumes 84.0 Mt or 10.3 t/cap in 2019, below Centro (12.8).
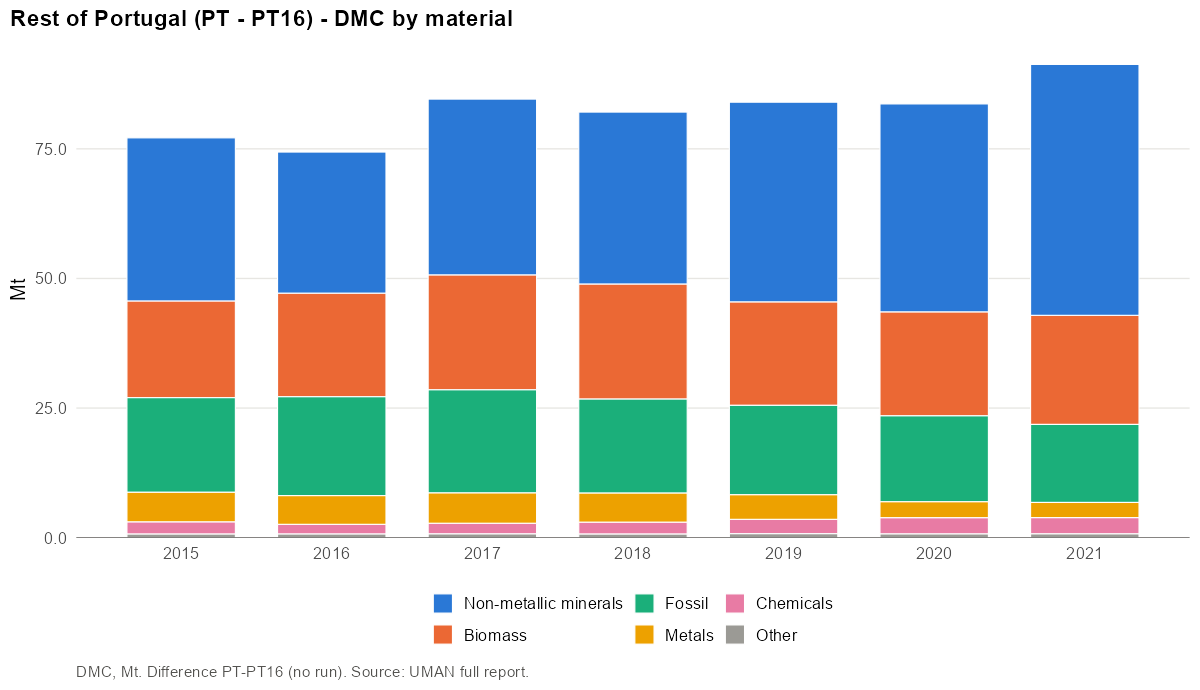
- More fossil, less stone: fossil materials are 21% of DMC (crude oil is the largest item, 13%) against 7% in Centro. The rest of Portugal hosts the refineries and the main energy import ports.
- More dependent on imports: international import dependency is 52%, against 20% in Centro.
- Negative DMC cells are 2.4 Mt (2.8% of DMC).
Overview
| 2015 | 2019 | 2021 | |
|---|---|---|---|
| Population | 8 096 037 | 8 149 207 | 8 181 431 |
| DE (Mt) | 44.0 | 50.8 | 61.5 |
| Imports M (Mt) | 52.6 | 54.6 | 50.5 |
| Exports X (Mt) | 31.7 | 31.2 | 29.8 |
| Domestic in NI (Mt) | – | – | – |
| Domestic out NO (Mt) | – | – | – |
| AR (Mt) | 65.6 | 77.1 | 86.1 |
| DMC (Mt) | 77.1 | 84.0 | 91.3 |
| DMC (t/cap) | 9.5 | 10.3 | 11.2 |
| Unbalanced (% of gross AR) | 12.5% | 7.0% | 4.9% |
Domestic extraction
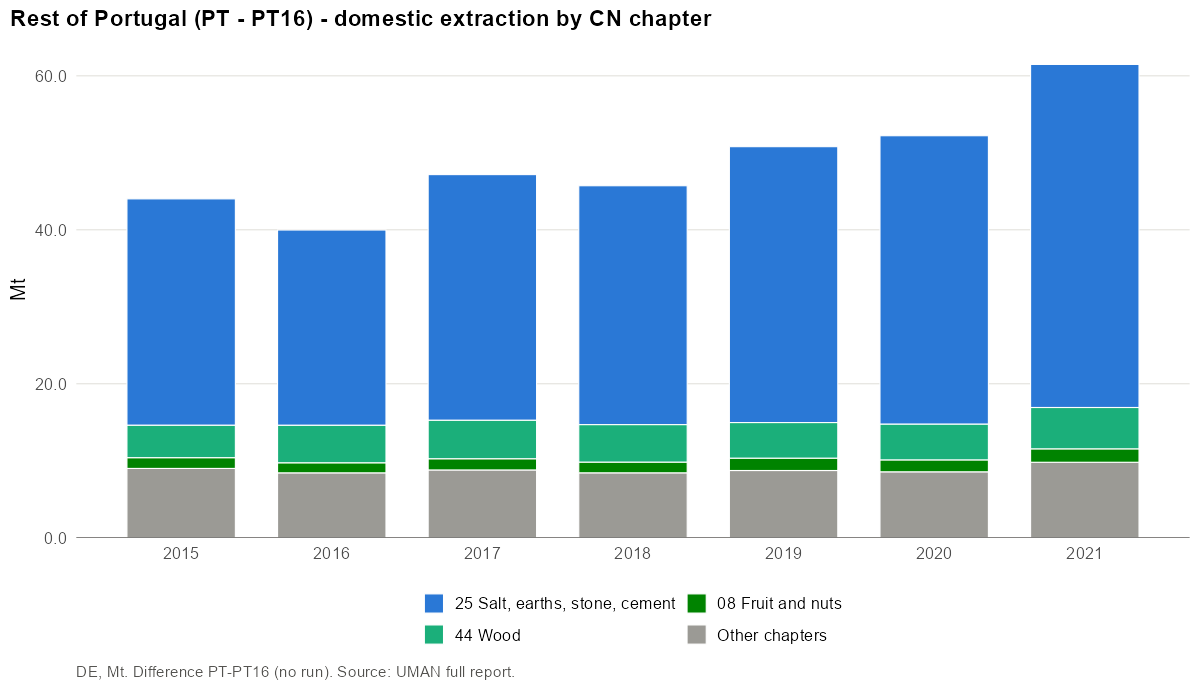
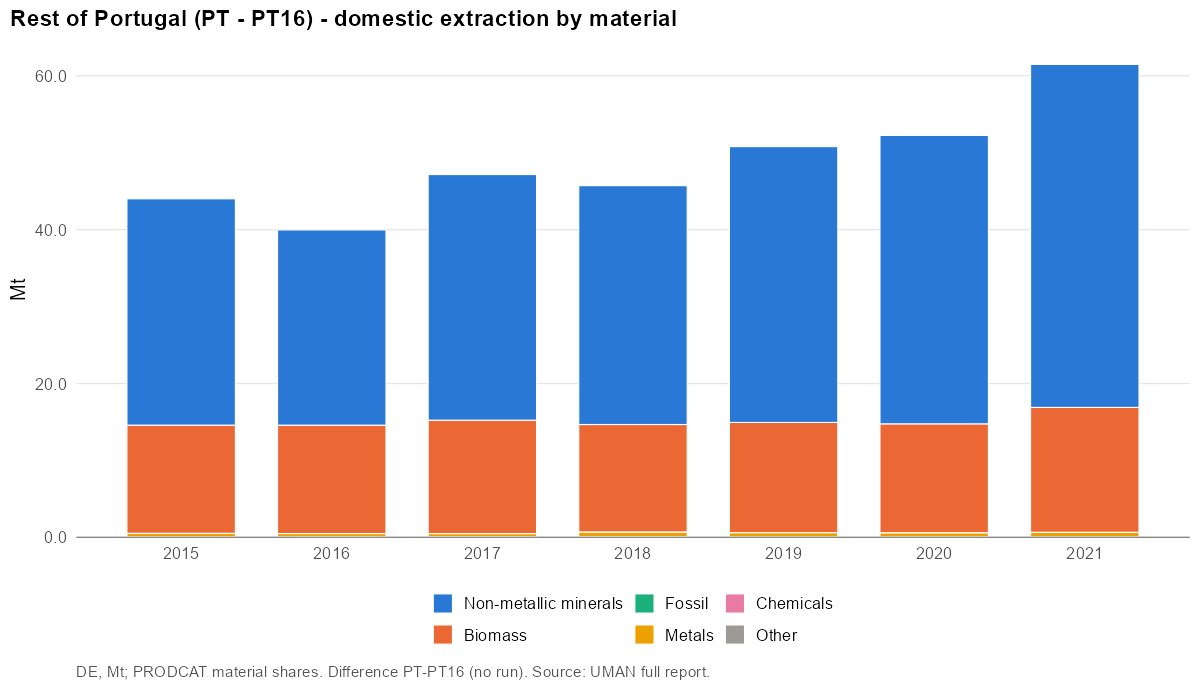
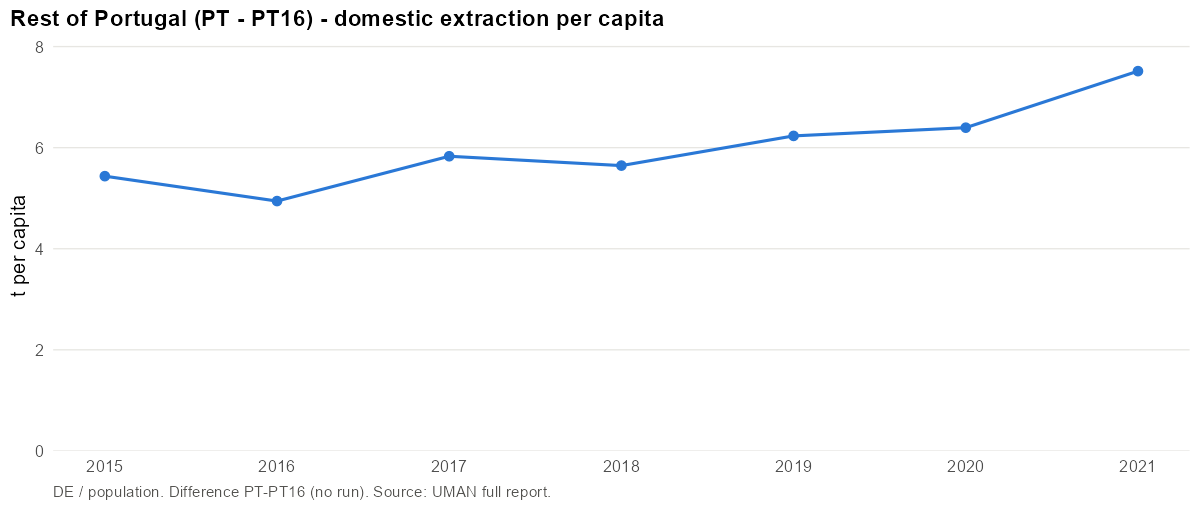
- Main CN4 codes (2019): 2515 Marble, travertine, ecaussine and other calcareous… (30%); 2516 Granite, porphyry, basalt, sandstone and other monumental… (24%); 2521 Limestone flux; limestone and other calcareous stone, of a… (13%); 4403 Wood in the rough, whether or not stripped of bark or… (8%); 0401 Milk and cream, not concentrated nor containing added sugar… (4%).
- Main materials: Stone (54%); Cement (13%); Agriculture biomass (12%).
International trade
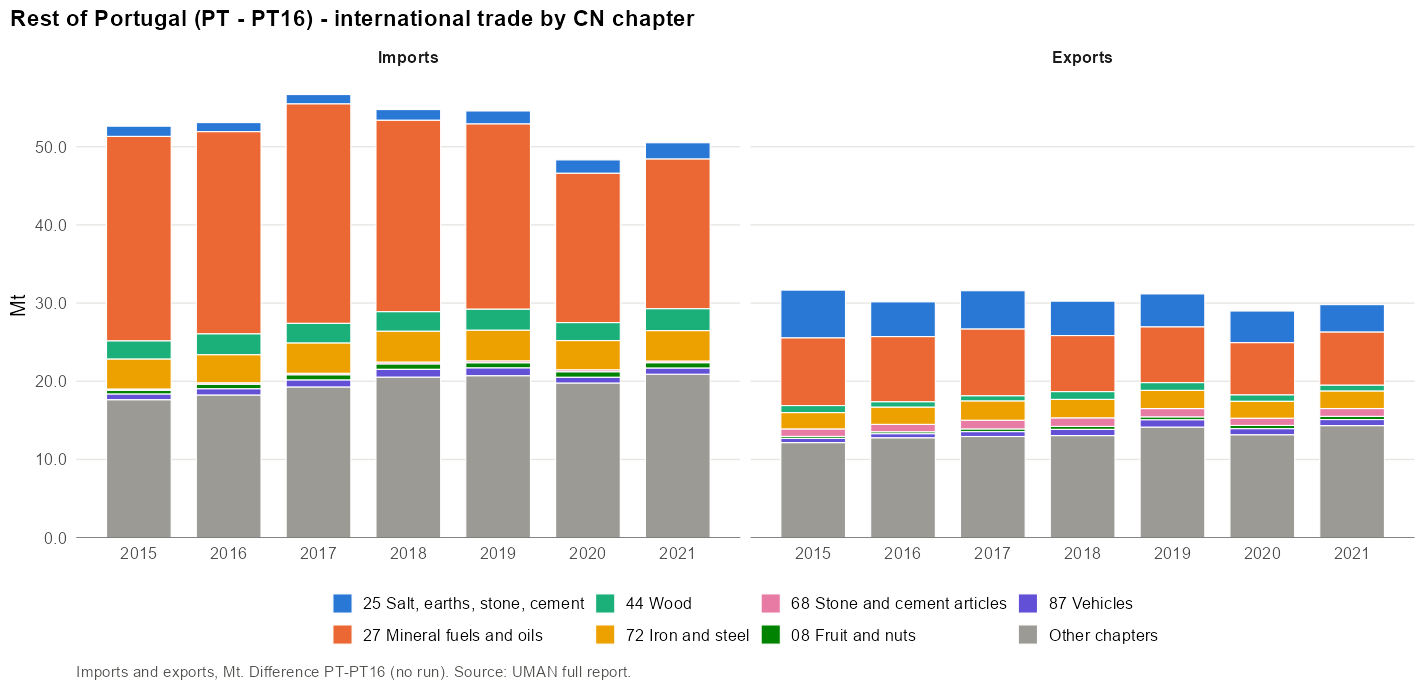
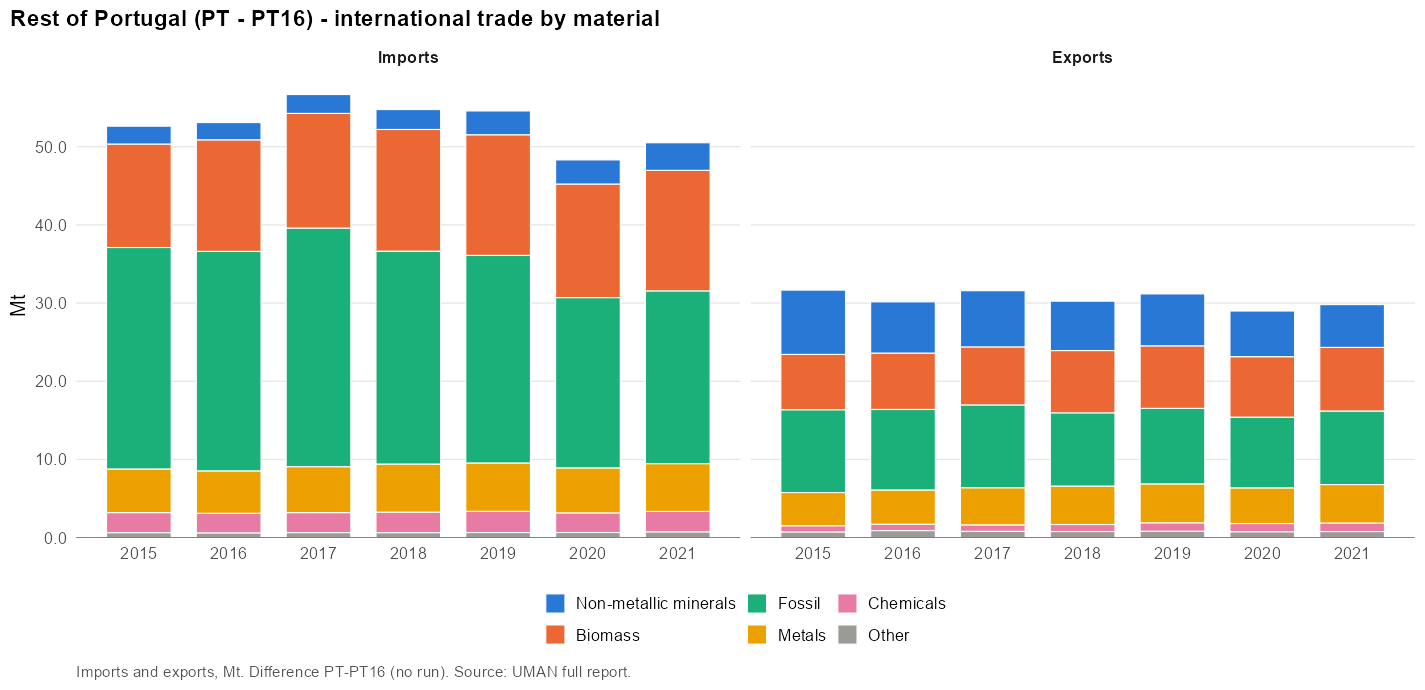
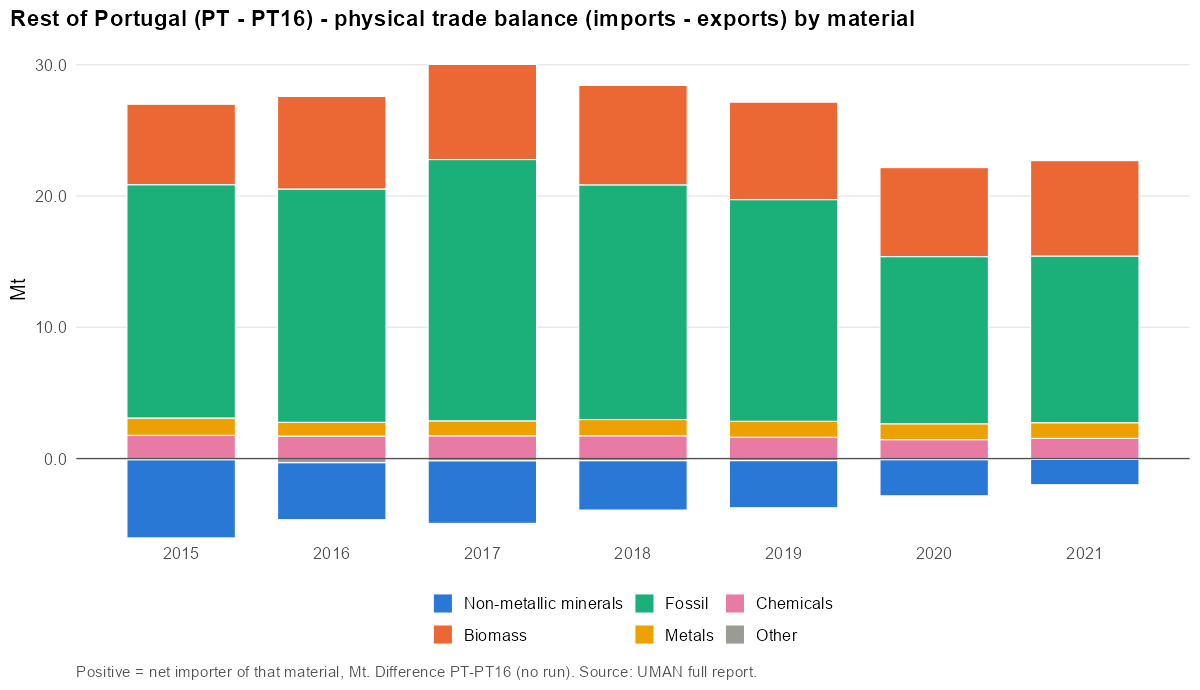
Imports:
- Main CN4 codes (2019): 2709 Petroleum oils and oils obtained from bituminous minerals… (21%); 2711 Petroleum gas and other gaseous hydrocarbons (10%); 2710 Petroleum oils and oils obtained from bituminous minerals… (6%); 2701 Coal; briquettes, ovoids and similar solid fuels… (5%); 1005 Maize or corn (4%).
- Main materials: Fuels (26%); Agriculture biomass (15%); Iron, steel and ferro-alloys (10%).
Exports:
- Main CN4 codes (2019): 2710 Petroleum oils and oils obtained from bituminous minerals… (20%); 2523 Cement, incl. cement clinkers, whether or not coloured (7%); 4802 Uncoated paper and paperboard, of a kind used for writing… (4%); 7010 Carboys, bottles, flasks, jars, pots, phials, ampoules and… (3%); 7214 Bars and rods, of iron or non-alloy steel, not further… (3%).
- Main materials: Fuels (19%); Iron, steel and ferro-alloys (13%); Paper and board (9%).
Domestic movement of goods
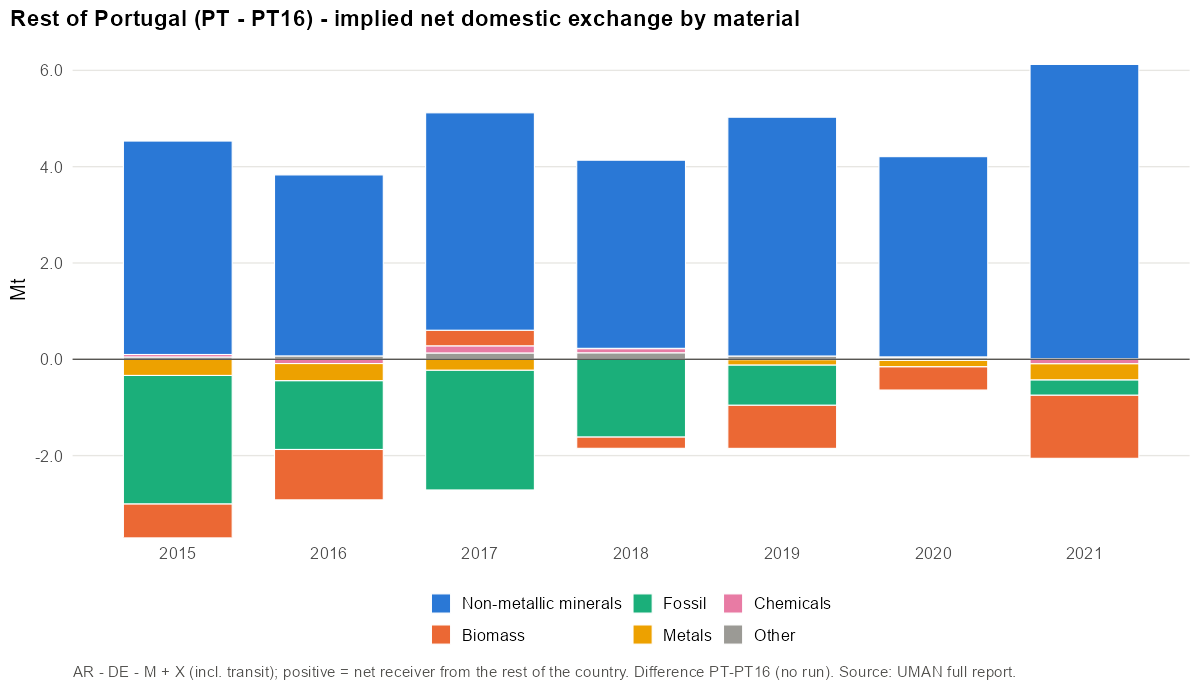
Gross domestic flows of a rest-of territory cannot be obtained by difference; only the implied net exchange is shown.
Available resources
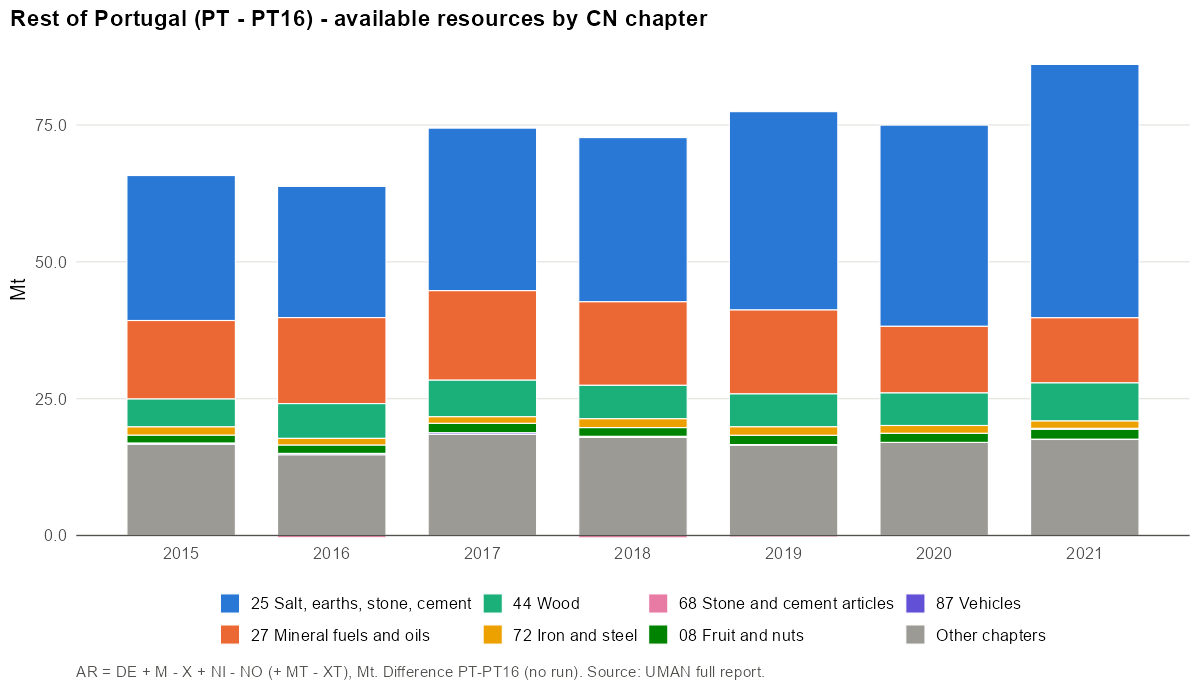
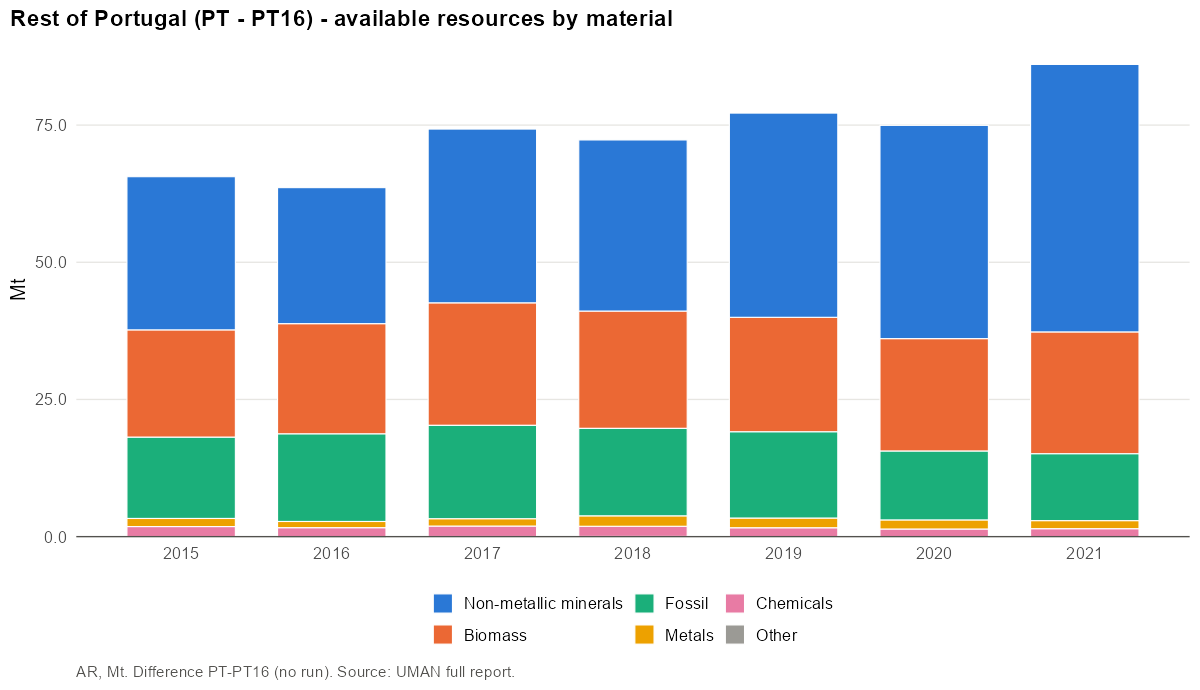
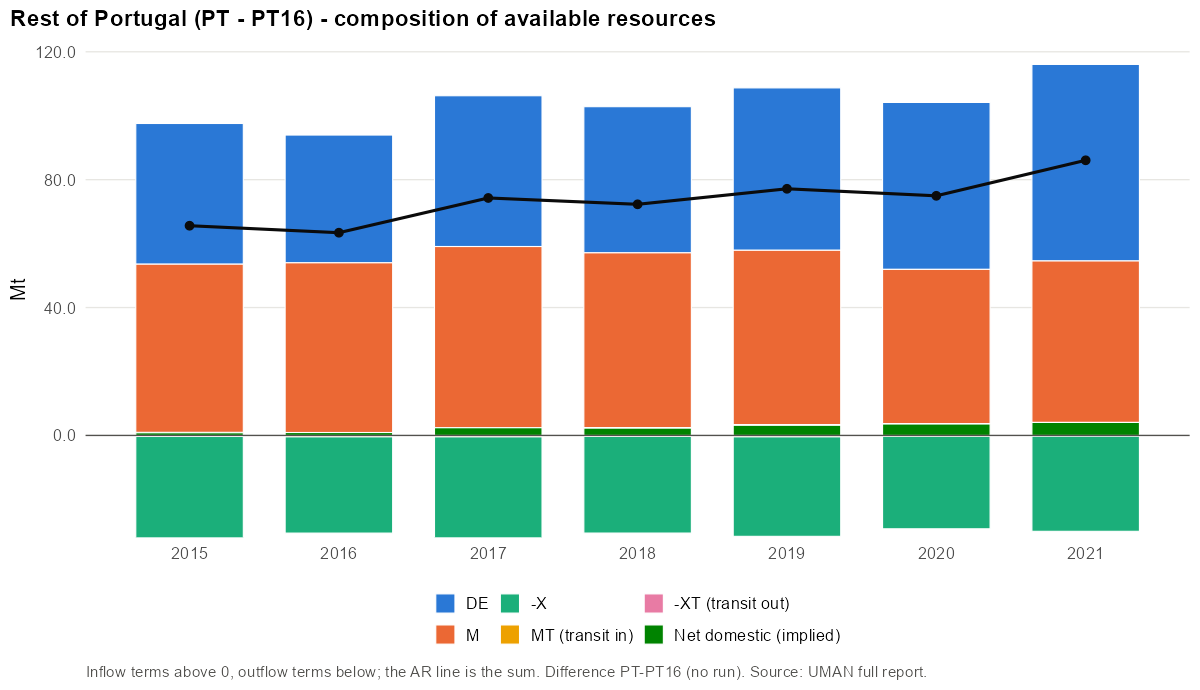
- Main CN4 codes (2019): 2515 Marble, travertine, ecaussine and other calcareous… (21%); 2516 Granite, porphyry, basalt, sandstone and other monumental… (17%); 2709 Petroleum oils and oils obtained from bituminous minerals… (15%); 2521 Limestone flux; limestone and other calcareous stone, of a… (9%); 4403 Wood in the rough, whether or not stripped of bark or… (7%).
- Main materials: Stone (37%); Agriculture biomass (14%); Fuels (9%).
Industrial production
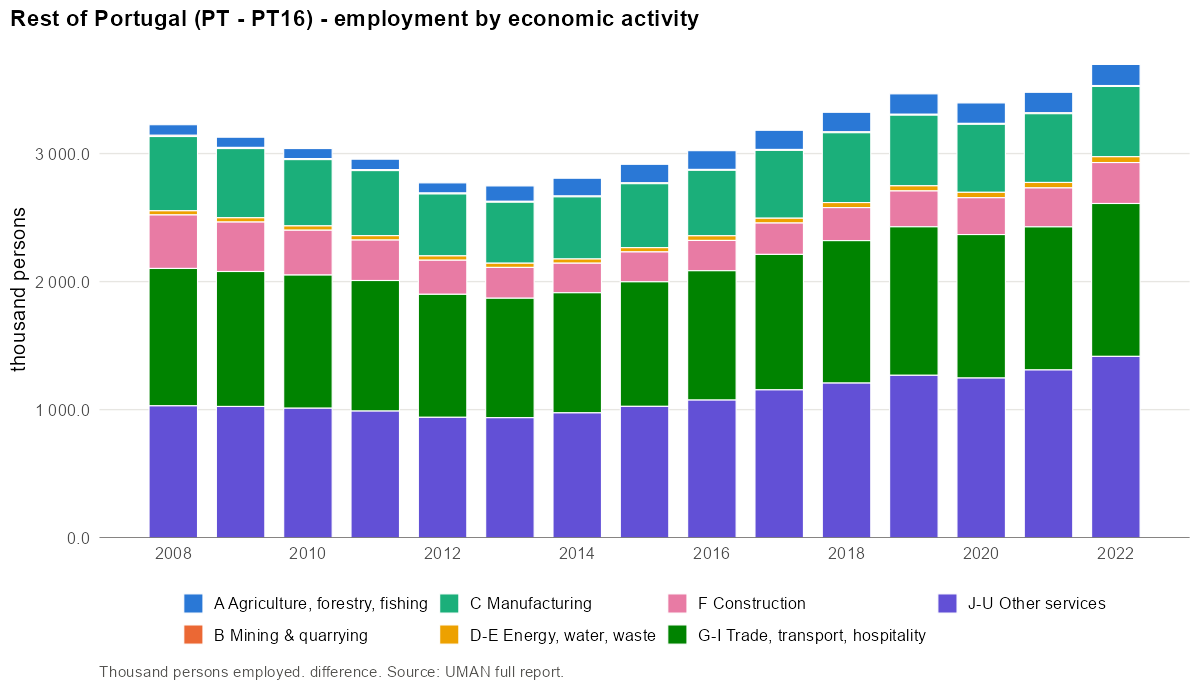
Production and the NACE-CN Sankey require a run; not available for a rest-of territory.
Largest employers (NACE divisions):
| NACE | Activity | Persons | Share |
|---|---|---|---|
| 47 | Retail trade, except of motor vehicles and motorcycles | 389 840 | 11.2% |
| 56 | Food and beverage service activities | 241 991 | 7.0% |
| 82 | Office administrative, office support and other business support activities | 201 387 | 5.8% |
| 46 | Wholesale trade, except of motor vehicles and motorcycles | 192 253 | 5.5% |
| 86 | Human health activities | 144 119 | 4.2% |
| 01 | Crop and animal production, hunting and related service activities | 137 973 | 4.0% |
| 41 | Construction of buildings | 135 838 | 3.9% |
| 78 | Employment activities | 118 609 | 3.4% |
Product transformation
Product transformation requires a run; not available for a rest-of territory.
Domestic material consumption
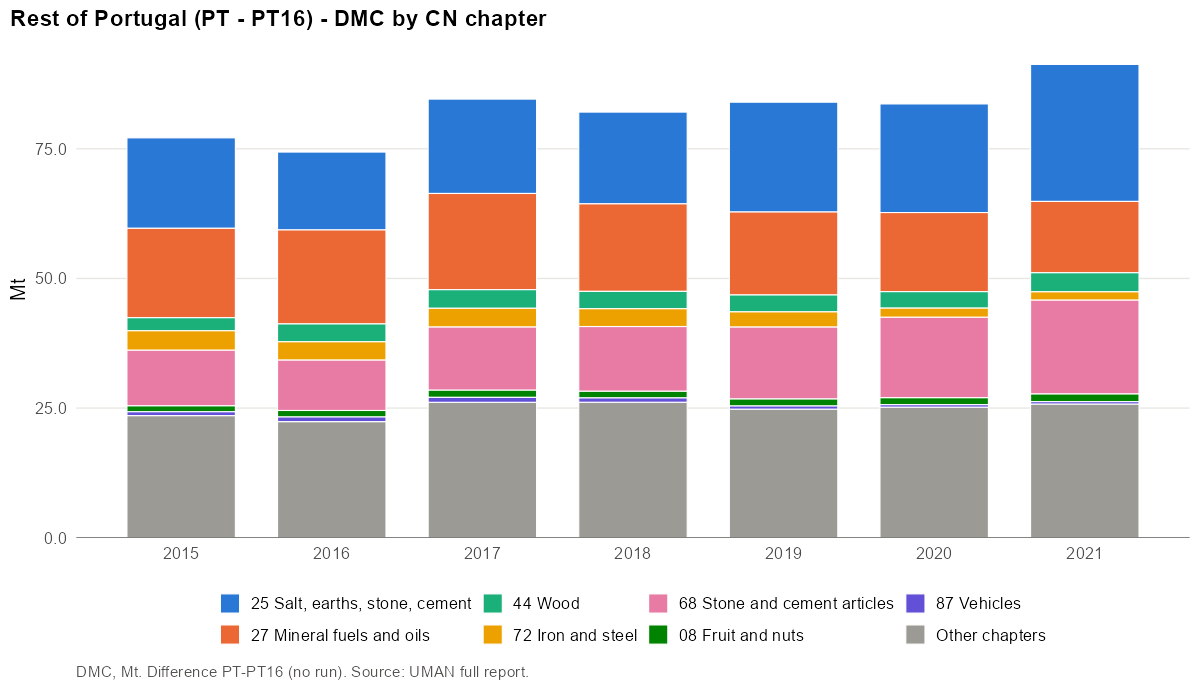
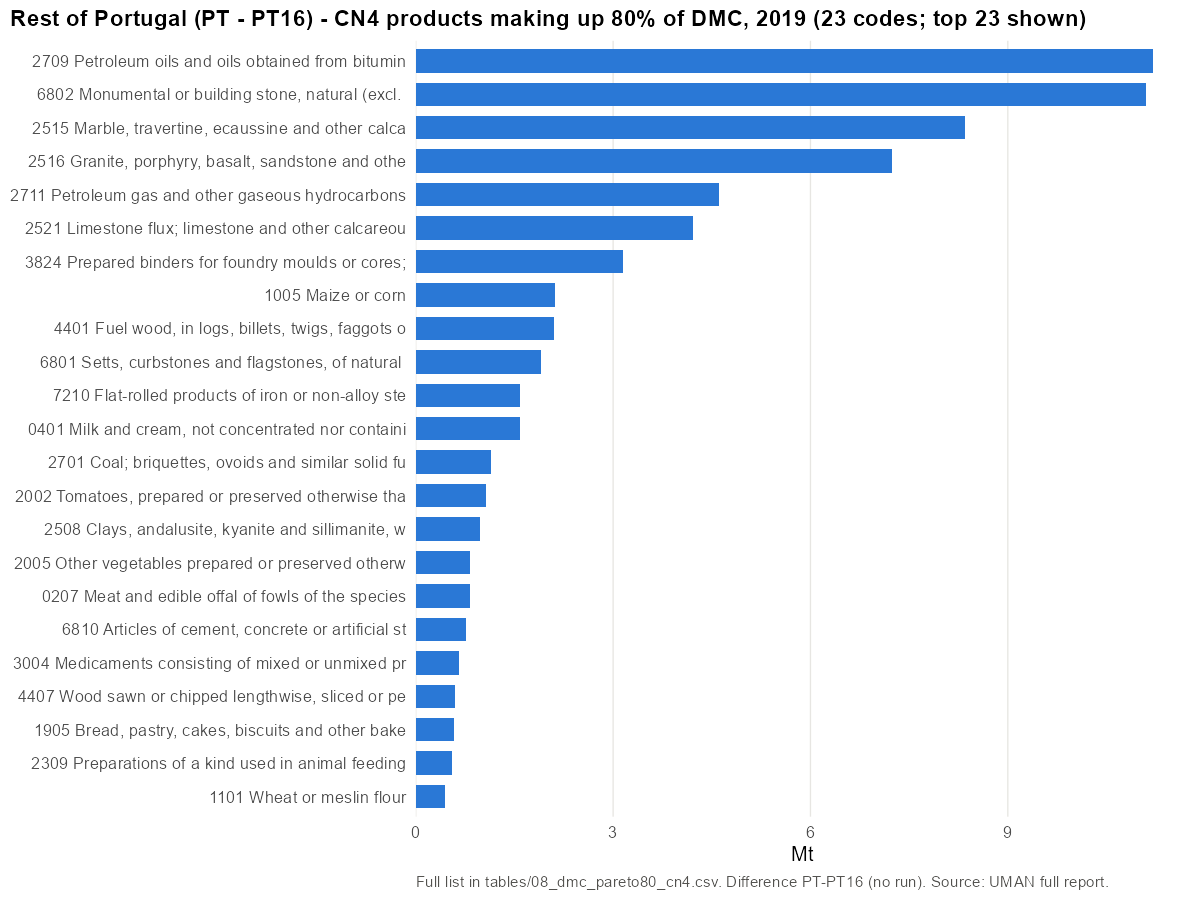
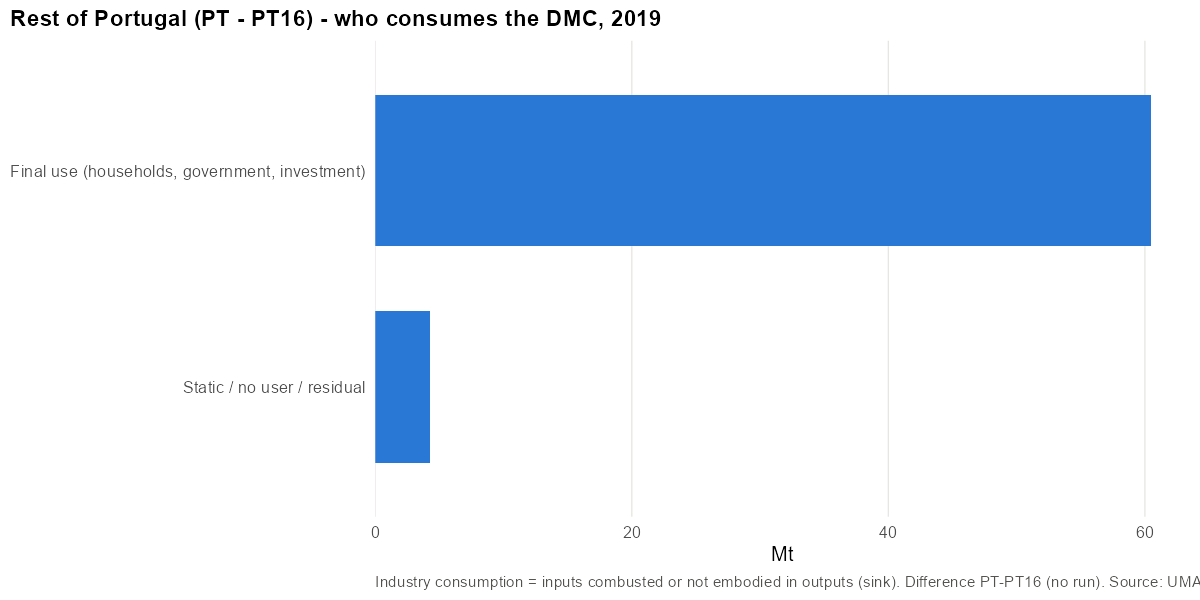
- Main CN4 codes (2019): 2709 Petroleum oils and oils obtained from bituminous minerals… (13%); 6802 Monumental or building stone, natural (excl. slate)… (13%); 2515 Marble, travertine, ecaussine and other calcareous… (10%); 2516 Granite, porphyry, basalt, sandstone and other monumental… (9%); 2711 Petroleum gas and other gaseous hydrocarbons (5%).
- Main materials: Stone (37%); Agriculture biomass (12%); Fuels (9%).
23 CN4 codes make up 80% of DMC in 2019. Top 10:
| Rank | CN4 | Product | Mt | Share | Cumulative |
|---|---|---|---|---|---|
| 1 | 2709 | Petroleum oils and oils obtained from bituminous minerals… | 11.20 | 13.3% | 13% |
| 2 | 6802 | Monumental or building stone, natural (excl. slate)… | 11.10 | 13.2% | 27% |
| 3 | 2515 | Marble, travertine, ecaussine and other calcareous… | 8.35 | 9.9% | 36% |
| 4 | 2516 | Granite, porphyry, basalt, sandstone and other monumental… | 7.24 | 8.6% | 45% |
| 5 | 2711 | Petroleum gas and other gaseous hydrocarbons | 4.61 | 5.5% | 51% |
| 6 | 2521 | Limestone flux; limestone and other calcareous stone, of a… | 4.22 | 5.0% | 56% |
| 7 | 3824 | Prepared binders for foundry moulds or cores; chemical… | 3.15 | 3.7% | 59% |
| 8 | 1005 | Maize or corn | 2.12 | 2.5% | 62% |
| 9 | 4401 | Fuel wood, in logs, billets, twigs, faggots or similar… | 2.11 | 2.5% | 64% |
| 10 | 6801 | Setts, curbstones and flagstones, of natural stone (excl.… | 1.90 | 2.3% | 67% |
Metrics
| Year | DMC/cap | AR/cap | DE/cap | Import dep. | Intl import dep. | Self-suff. | Export int. |
|---|---|---|---|---|---|---|---|
| 2015 | 9.5 | 8.1 | 5.4 | – | 54% | 57% | – |
| 2016 | 9.2 | 7.8 | 4.9 | – | 57% | 54% | – |
| 2017 | 10.5 | 9.2 | 5.8 | – | 55% | 56% | – |
| 2018 | 10.1 | 8.9 | 5.6 | – | 54% | 56% | – |
| 2019 | 10.3 | 9.5 | 6.2 | – | 52% | 60% | – |
| 2020 | 10.2 | 9.2 | 6.4 | – | 48% | 62% | – |
| 2021 | 11.2 | 10.5 | 7.5 | – | 45% | 67% | – |
Negative cells in 2019 (child > parent for a CN code): DE -0.08 Mt; M -0.08 Mt; X -0.04 Mt; dmc -2.39 Mt.
Rest of Centro (PT16 - PT16E)
Portugal · rest-of · code PT16-PT16E · rest (PT16 - PT16E) · years 2015–2021
Findings
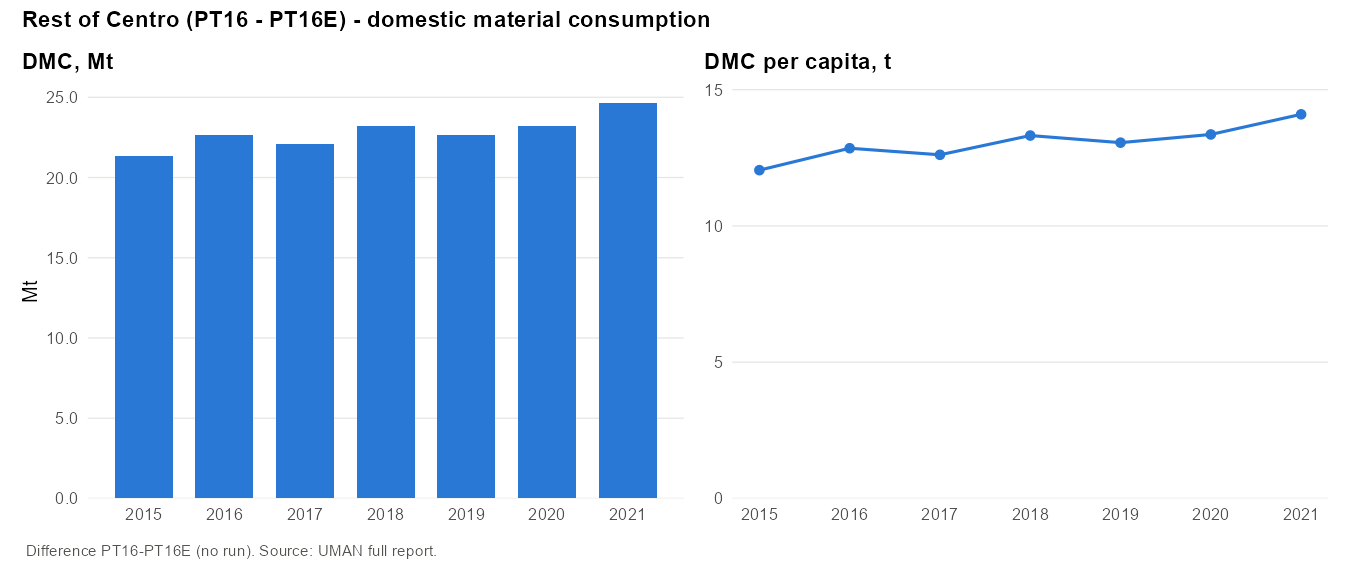
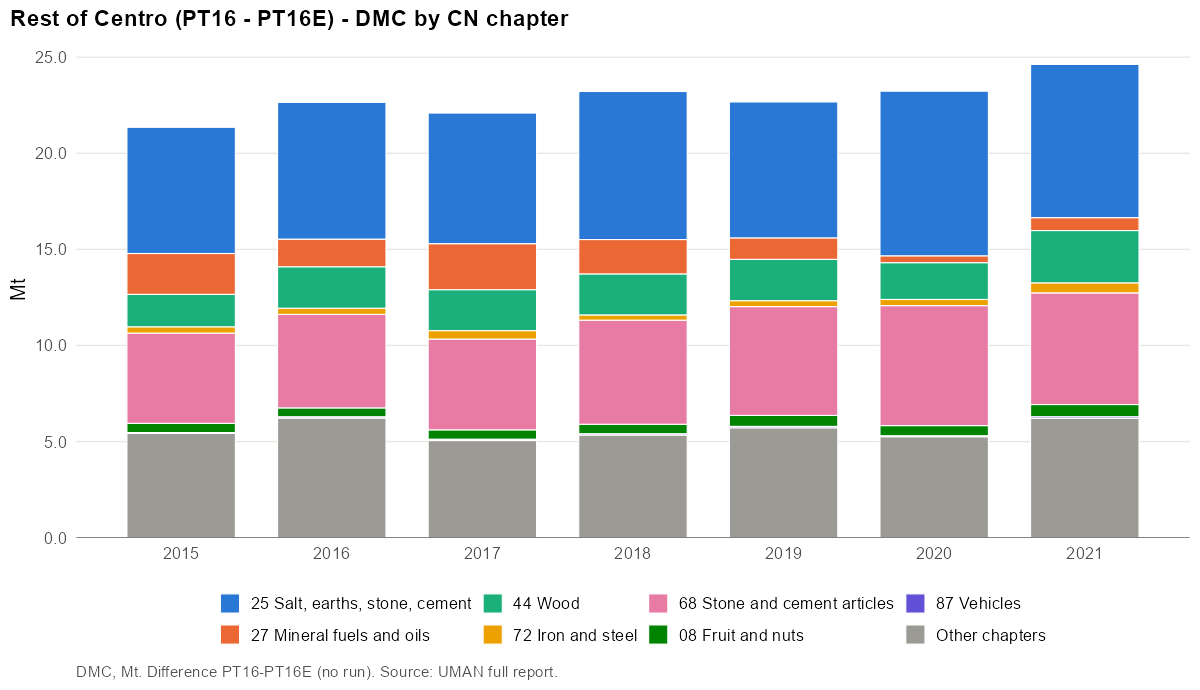
- Centro without Coimbra (1.74 million people) consumes 22.7 Mt or 13.1 t/cap in 2019.
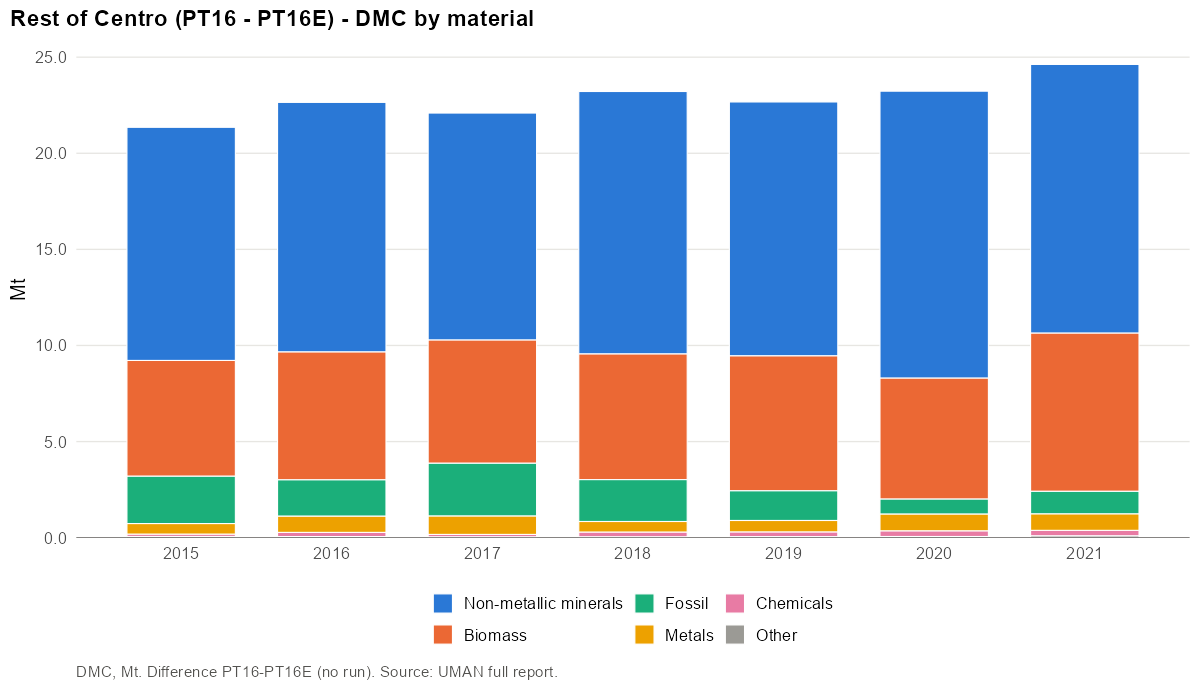
- Coimbra is tier C, so this difference only redistributes Centro's DMC. Composition is identical to Centro's, and per capita values differ only through the consumer job structure and the population figures.
Overview
| 2015 | 2019 | 2021 | |
|---|---|---|---|
| Population | 1 772 563 | 1 736 427 | 1 746 955 |
| DE (Mt) | – | – | – |
| Imports M (Mt) | – | – | – |
| Exports X (Mt) | – | – | – |
| Domestic in NI (Mt) | – | – | – |
| Domestic out NO (Mt) | – | – | – |
| AR (Mt) | – | – | – |
| DMC (Mt) | 21.4 | 22.7 | 24.6 |
| DMC (t/cap) | 12.0 | 13.1 | 14.1 |
| Unbalanced (% of gross AR) | – | – | – |
Domestic extraction
Tier C: the DMC is downscaled from the parent; no own DE, trade or domestic-flow accounts.
- Main CN4 codes (2019): NA NA (–).
- Main materials: NA (–).
International trade
Tier C: the DMC is downscaled from the parent; no own DE, trade or domestic-flow accounts.
Imports:
- Main CN4 codes (2019): NA NA (–).
- Main materials: NA (–).
Exports:
- Main CN4 codes (2019): NA NA (–).
- Main materials: NA (–).
Domestic movement of goods
Tier C: the DMC is downscaled from the parent; no own DE, trade or domestic-flow accounts.
Available resources
Tier C: the DMC is downscaled from the parent; no own DE, trade or domestic-flow accounts.
- Main CN4 codes (2019): NA NA (–).
- Main materials: NA (–).
Industrial production
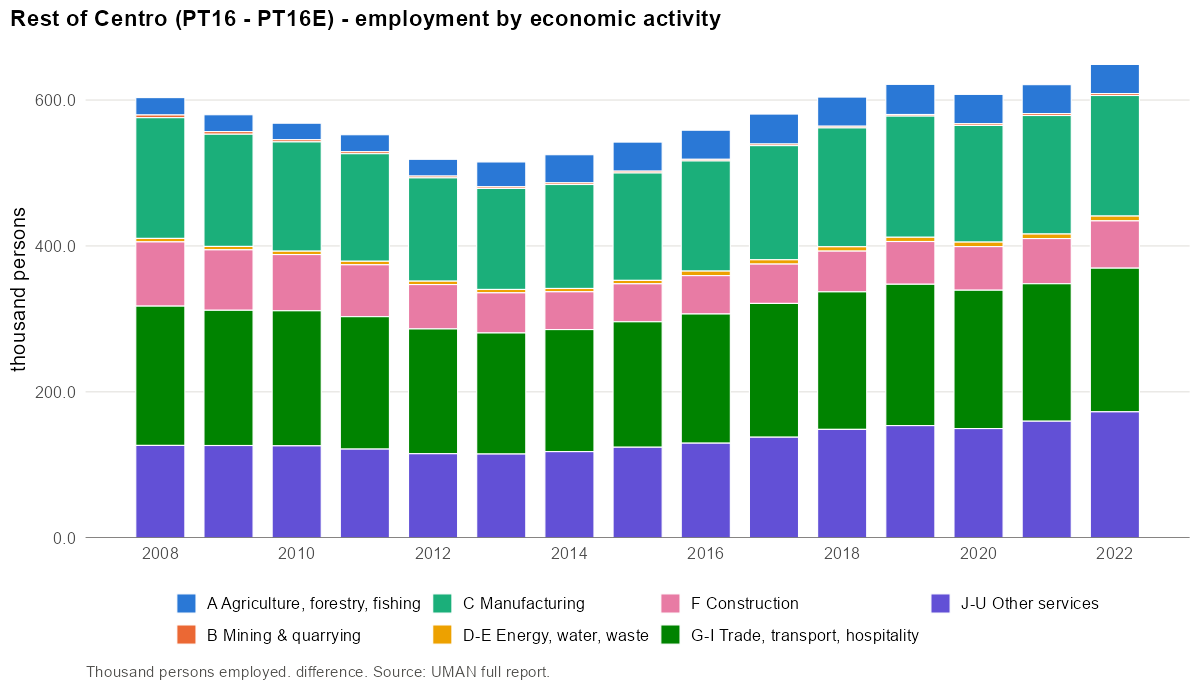
Production and the NACE-CN Sankey require a run; not available for a rest-of territory.
Largest employers (NACE divisions):
| NACE | Activity | Persons | Share |
|---|---|---|---|
| 47 | Retail trade, except of motor vehicles and motorcycles | 57 836 | 9.3% |
| 46 | Wholesale trade, except of motor vehicles and motorcycles | 43 409 | 7.0% |
| 01 | Crop and animal production, hunting and related service activities | 33 974 | 5.5% |
| 25 | Manufacture of fabricated metal products, except machinery and equipment | 33 381 | 5.4% |
| 56 | Food and beverage service activities | 33 142 | 5.3% |
| 41 | Construction of buildings | 27 191 | 4.4% |
| 49 | Land transport and transport via pipelines | 25 811 | 4.2% |
| 82 | Office administrative, office support and other business support activities | 25 498 | 4.1% |
Product transformation
Product transformation requires a run; not available for a rest-of territory.
Domestic material consumption
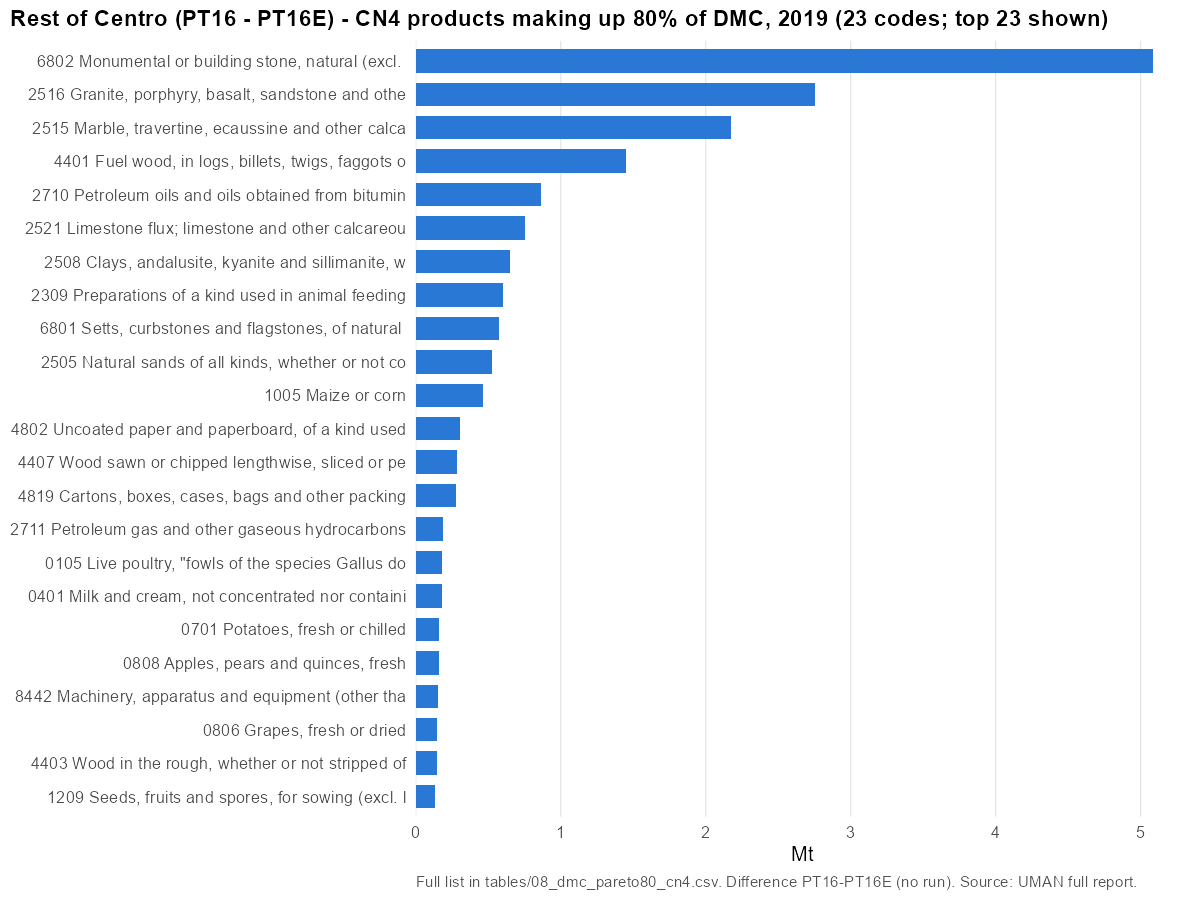
- Main CN4 codes (2019): 6802 Monumental or building stone, natural (excl. slate)… (22%); 2516 Granite, porphyry, basalt, sandstone and other monumental… (12%); 2515 Marble, travertine, ecaussine and other calcareous… (10%); 4401 Fuel wood, in logs, billets, twigs, faggots or similar… (6%); 2710 Petroleum oils and oils obtained from bituminous minerals… (4%).
- Main materials: Stone (47%); Agriculture biomass (11%); Wood and wood fuels (10%).
23 CN4 codes make up 80% of DMC in 2019. Top 10:
| Rank | CN4 | Product | Mt | Share | Cumulative |
|---|---|---|---|---|---|
| 1 | 6802 | Monumental or building stone, natural (excl. slate)… | 5.08 | 22.4% | 22% |
| 2 | 2516 | Granite, porphyry, basalt, sandstone and other monumental… | 2.75 | 12.1% | 35% |
| 3 | 2515 | Marble, travertine, ecaussine and other calcareous… | 2.17 | 9.6% | 44% |
| 4 | 4401 | Fuel wood, in logs, billets, twigs, faggots or similar… | 1.45 | 6.4% | 51% |
| 5 | 2710 | Petroleum oils and oils obtained from bituminous minerals… | 0.87 | 3.8% | 54% |
| 6 | 2521 | Limestone flux; limestone and other calcareous stone, of a… | 0.76 | 3.3% | 58% |
| 7 | 2508 | Clays, andalusite, kyanite and sillimanite, whether or not… | 0.65 | 2.9% | 61% |
| 8 | 2309 | Preparations of a kind used in animal feeding | 0.60 | 2.6% | 63% |
| 9 | 6801 | Setts, curbstones and flagstones, of natural stone (excl.… | 0.57 | 2.5% | 66% |
| 10 | 2505 | Natural sands of all kinds, whether or not coloured (excl.… | 0.53 | 2.3% | 68% |
Metrics
| Year | DMC/cap | AR/cap | DE/cap | Import dep. | Intl import dep. | Self-suff. | Export int. |
|---|---|---|---|---|---|---|---|
| 2015 | 12.0 | – | – | – | – | – | – |
| 2016 | 12.9 | – | – | – | – | – | – |
| 2017 | 12.6 | – | – | – | – | – | – |
| 2018 | 13.3 | – | – | – | – | – | – |
| 2019 | 13.1 | – | – | – | – | – | – |
| 2020 | 13.4 | – | – | – | – | – | – |
| 2021 | 14.1 | – | – | – | – | – | – |
Negative cells in 2019 (child > parent for a CN code): DE 0.00 Mt; M 0.00 Mt; X 0.00 Mt; dmc -0.10 Mt.
Sweden
Method · Italy · Portugal · Sweden · Comparison · About
In this chapter: Sweden · Södra Sverige · Västsverige · Västra Götalands län · Göteborgs kommun · Rest of Sweden (SE - SE2) · Rest of Södra Sverige (SE2 - SE23) · Rest of Västsverige (SE23 - SE232) · Rest of Västra Götaland (SE232 - 1480)
Sweden (SE)
Sweden · NUTS 0 · code SE · tier A · years 2013–2022
Findings
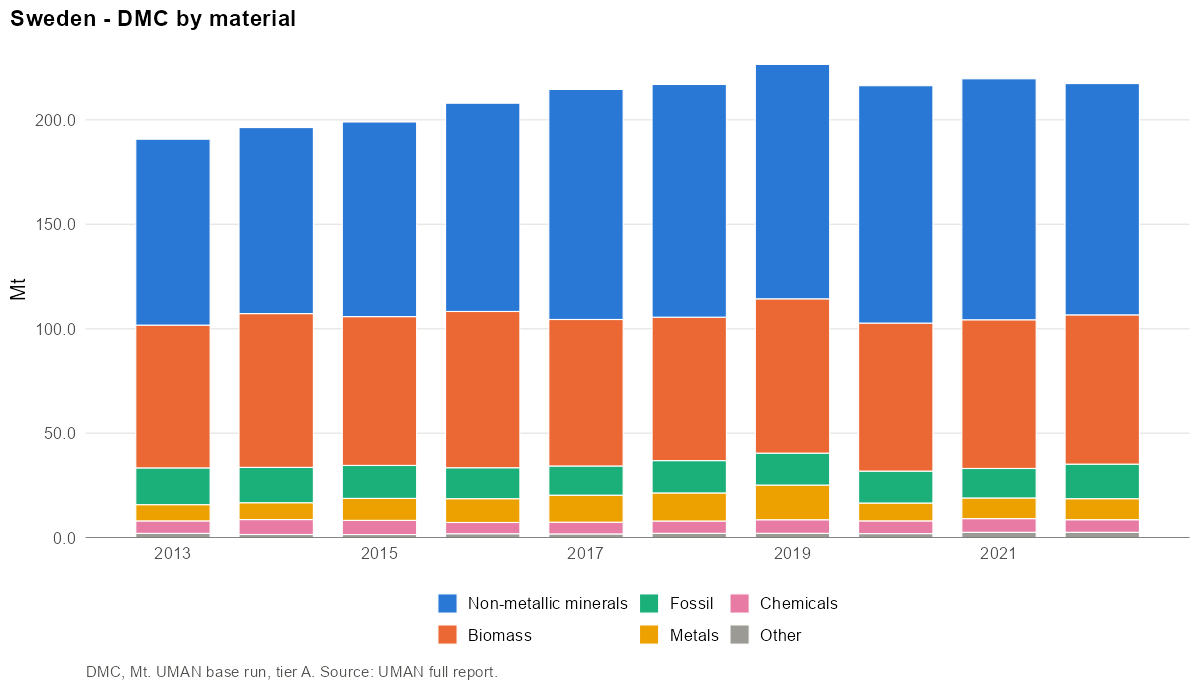
- DMC is 226.5 Mt or 21.9 t/cap in 2019, the highest per capita value in the report. Over 2013–2022 it moves between 19.8 and 21.9 t/cap (20.7 in 2022).
- Sweden consumes roughly what it extracts: DE is 21.5 t/cap and self-sufficiency (DE/DMC) is 0.98. Crushed stone is 48% of DE, roundwood 25% and iron ore 13%.
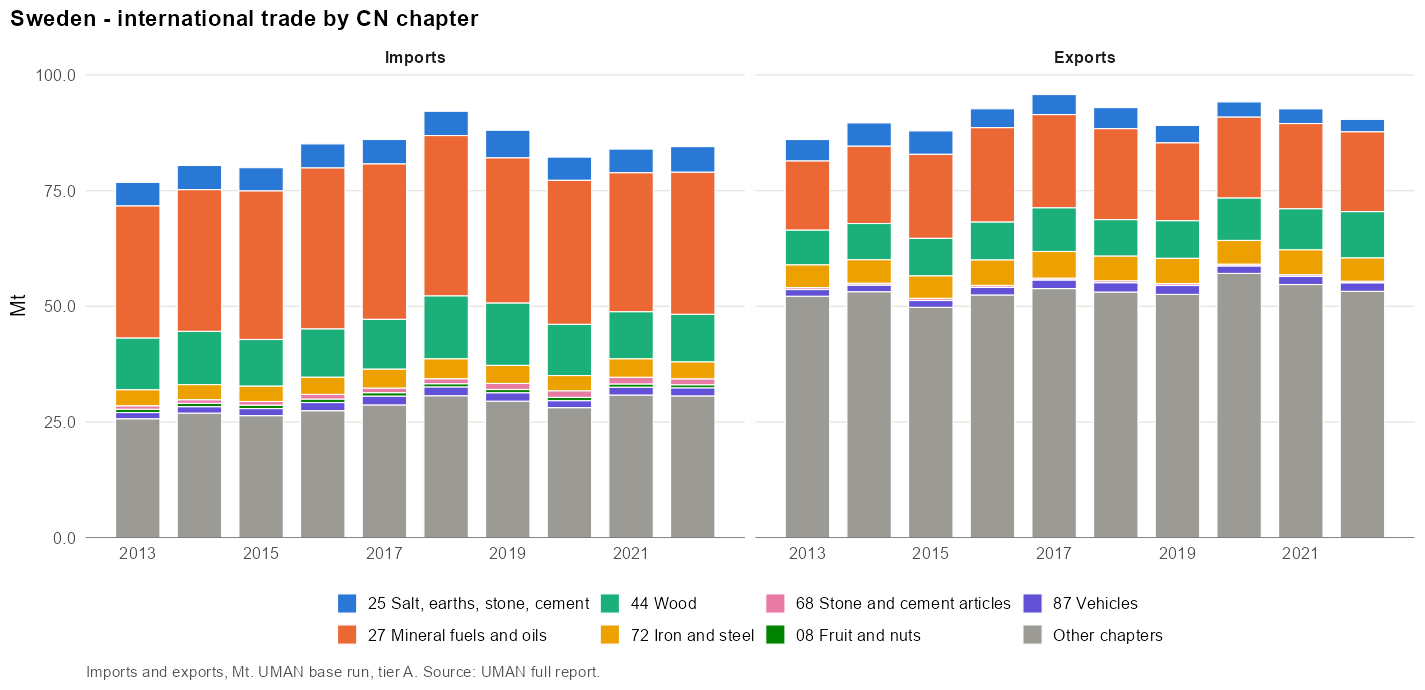
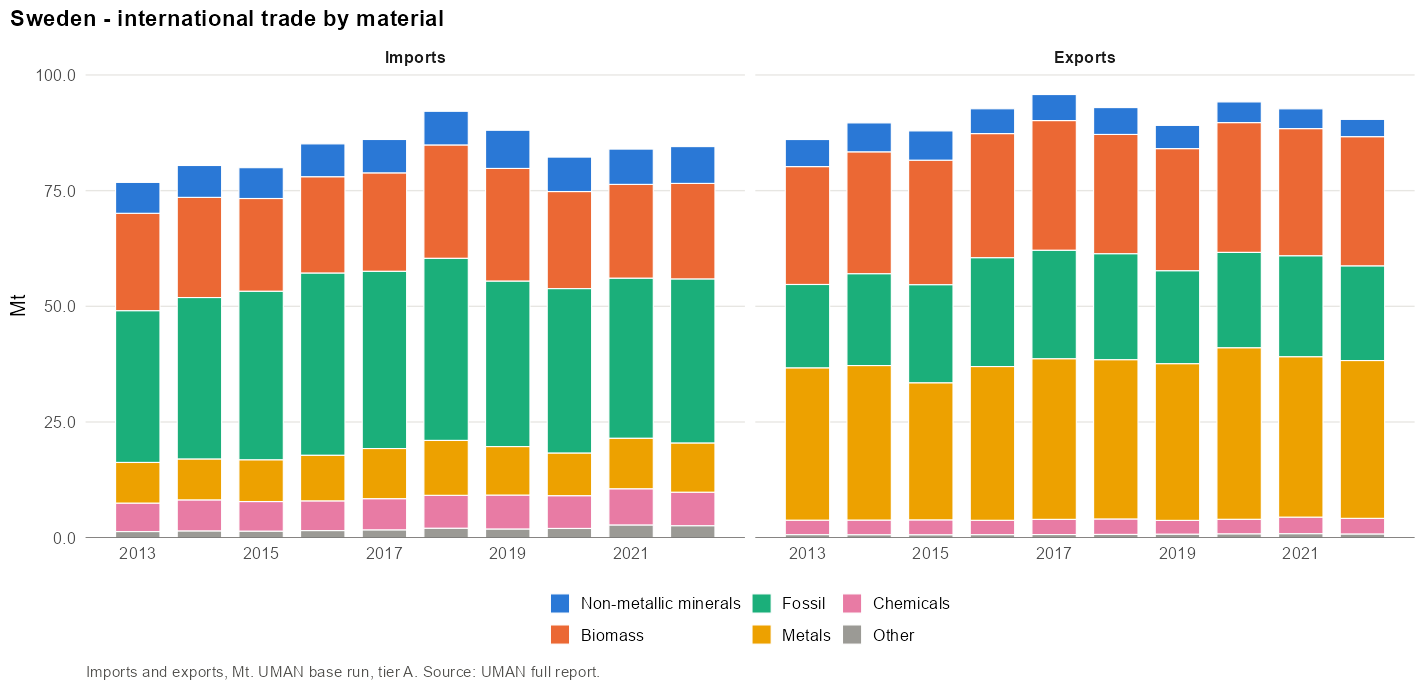
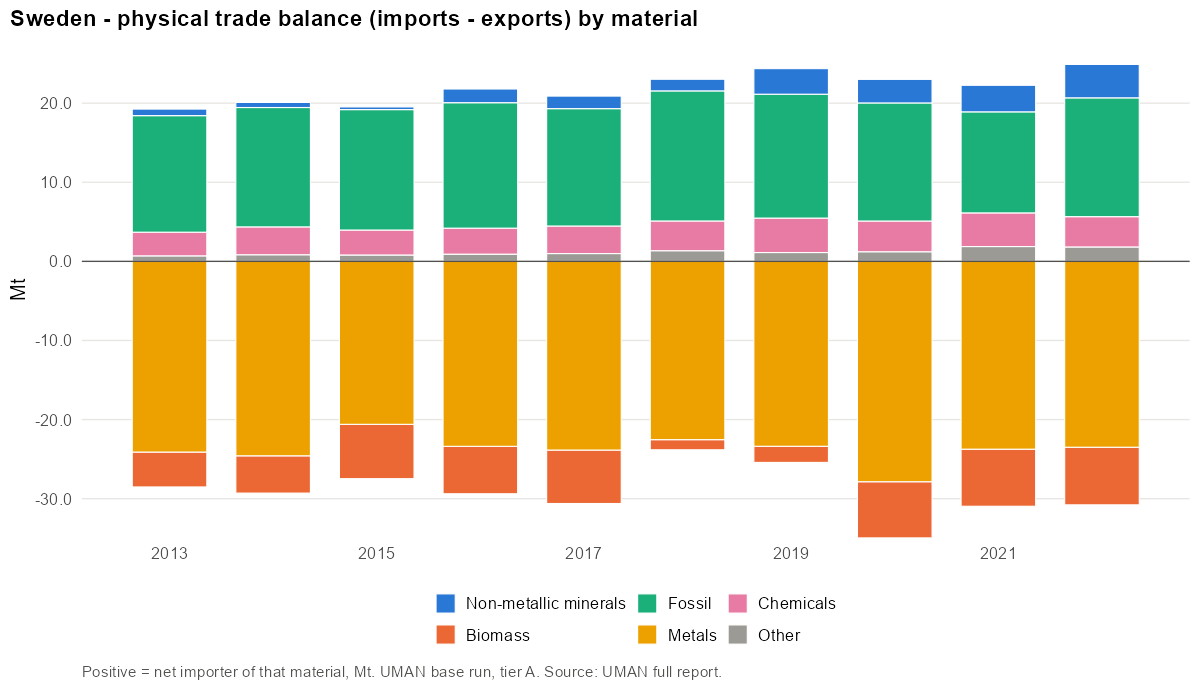
- Trade is balanced in mass (88.0 Mt imports, 89.1 Mt exports). Imports are crude oil (19%), refined products (10%) and roundwood (10%). Exports are iron ore (25%), refined products (17%) and sawn wood (7%). International import dependency is 28%.
- DMC is half non-metallic minerals (50%) and one third biomass (33%). Only 13 CN4 codes make up 80% of DMC. Crushed stone alone is 46% and fuel wood 14%.
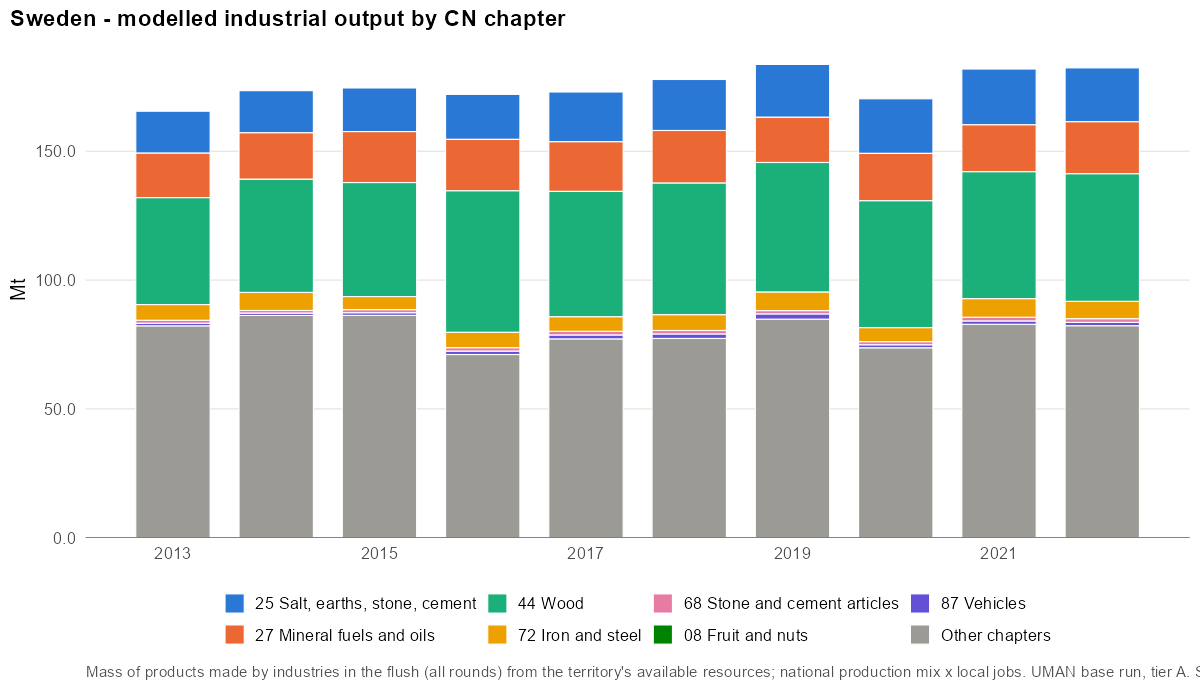
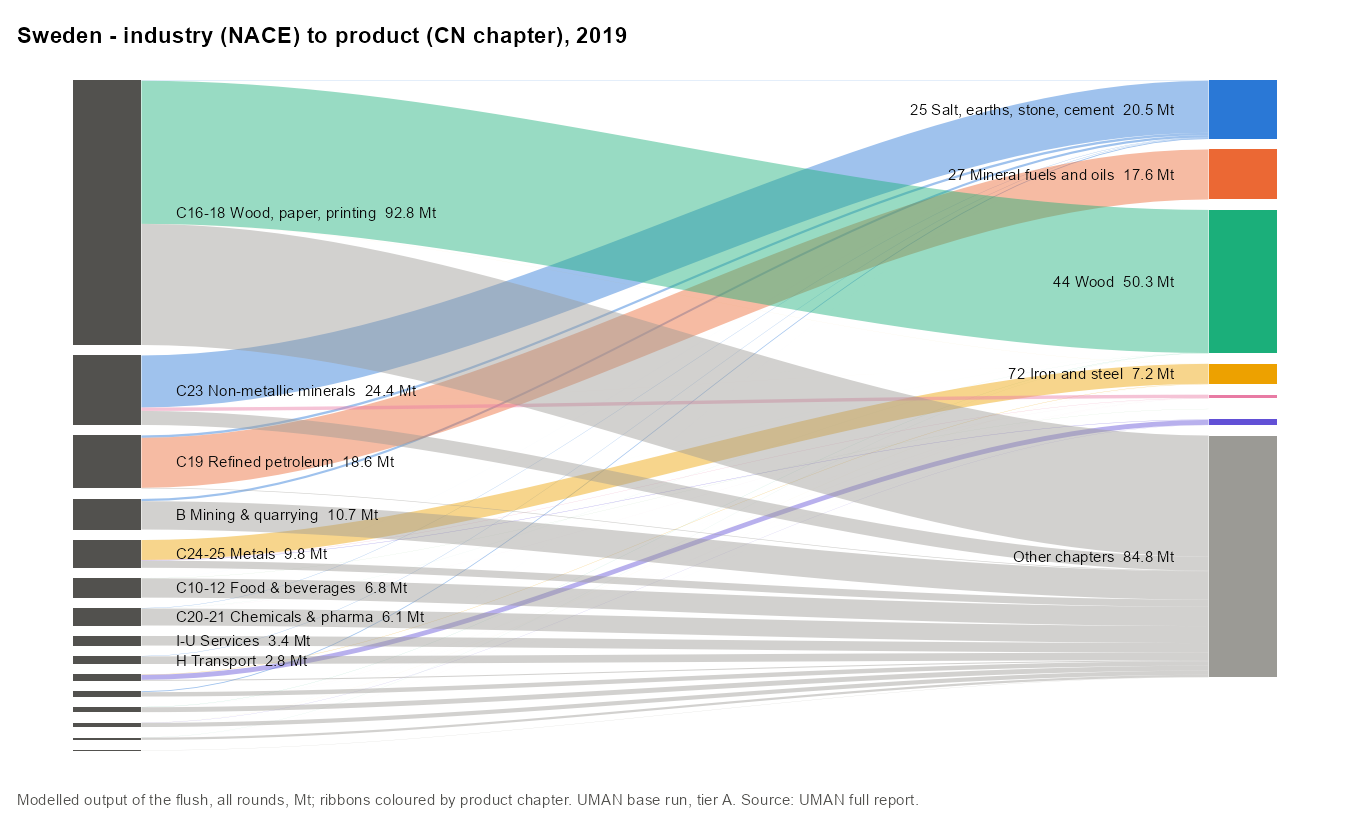
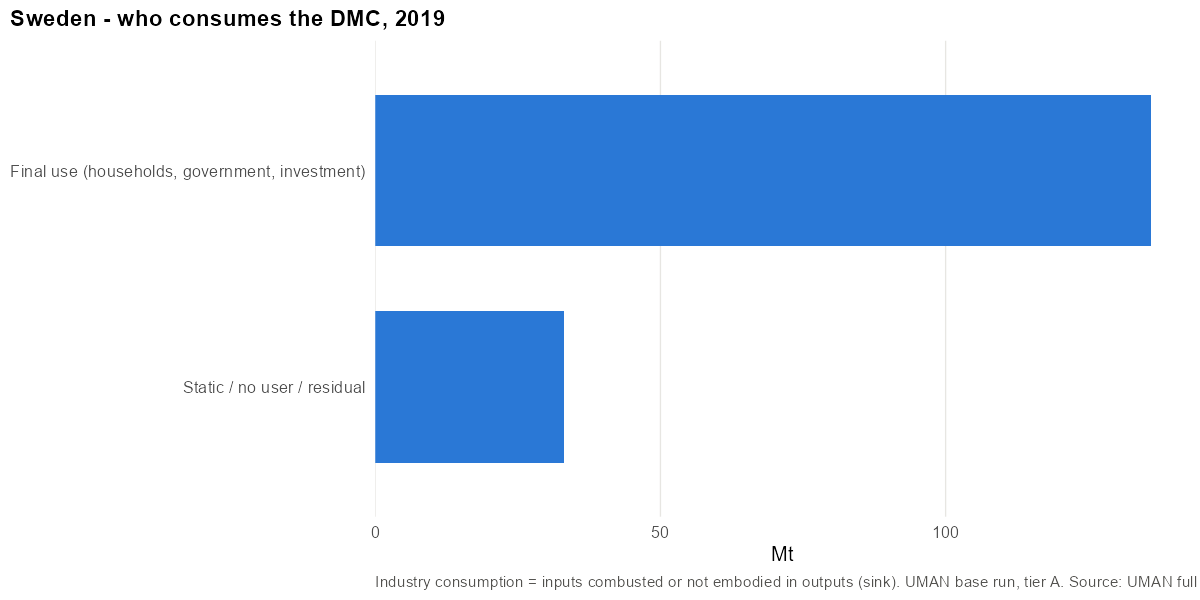
- Transformation: 40% of the 268 Mt entering round 1 is transformed by industry. Industry consumes 64 Mt as sink (energy, combustion) and keeps 33 Mt as static stock. 32 Mt leaves again as exports after processing (pulp, paper, sawn wood, steel).
- The unbalanced share is 2.0%, the lowest in the report, reflecting firm-level trade and production data.
Overview
| 2013 | 2019 | 2022 | |
|---|---|---|---|
| Population | 9 644 864 | 10 327 589 | 10 521 556 |
| DE (Mt) | 194.6 | 222.2 | 219.1 |
| Imports M (Mt) | 76.8 | 88.0 | 84.5 |
| Exports X (Mt) | 86.0 | 89.1 | 90.4 |
| Domestic in NI (Mt) | 0.0 | 0.0 | 0.0 |
| Domestic out NO (Mt) | 0.0 | 0.0 | 0.0 |
| AR (Mt) | 185.3 | 221.2 | 213.2 |
| DMC (Mt) | 190.7 | 226.5 | 217.3 |
| DMC (t/cap) | 19.8 | 21.9 | 20.7 |
| Unbalanced (% of gross AR) | 2.3% | 2.0% | 1.6% |
Domestic extraction
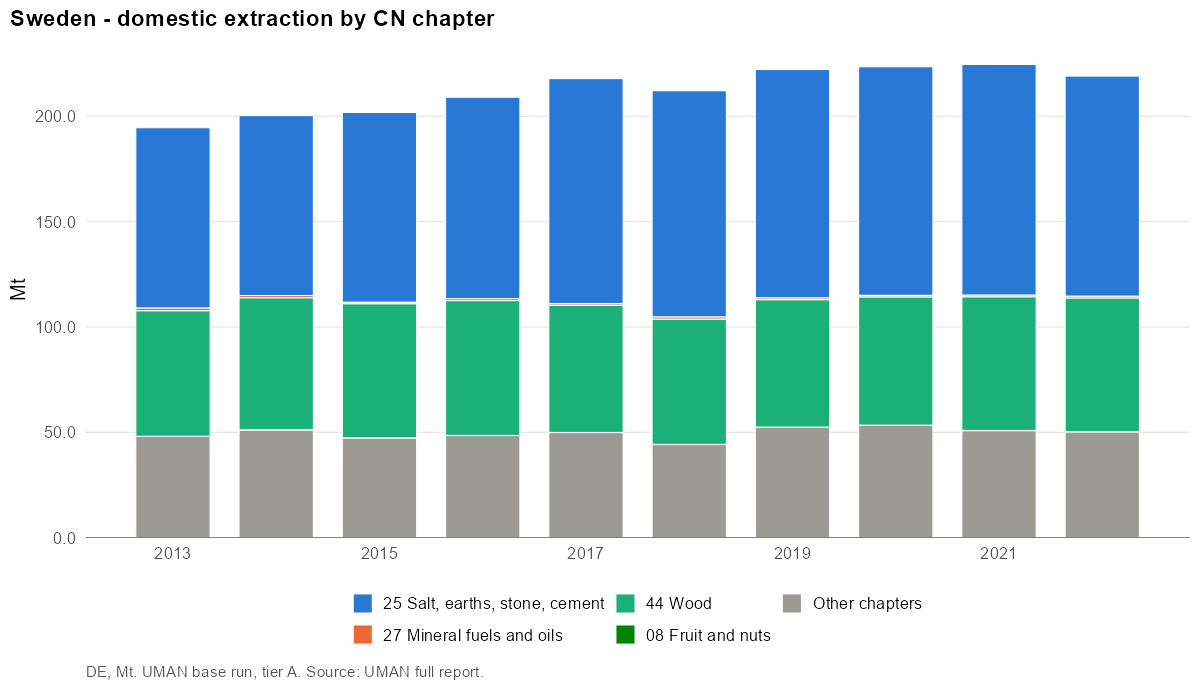
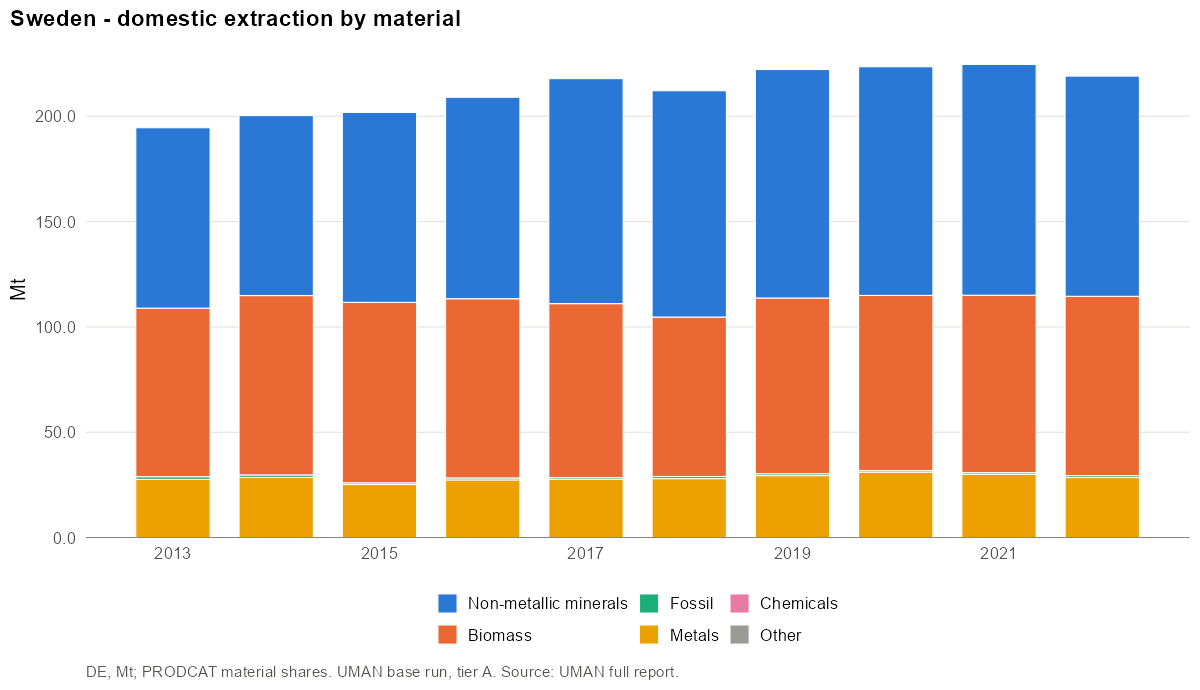
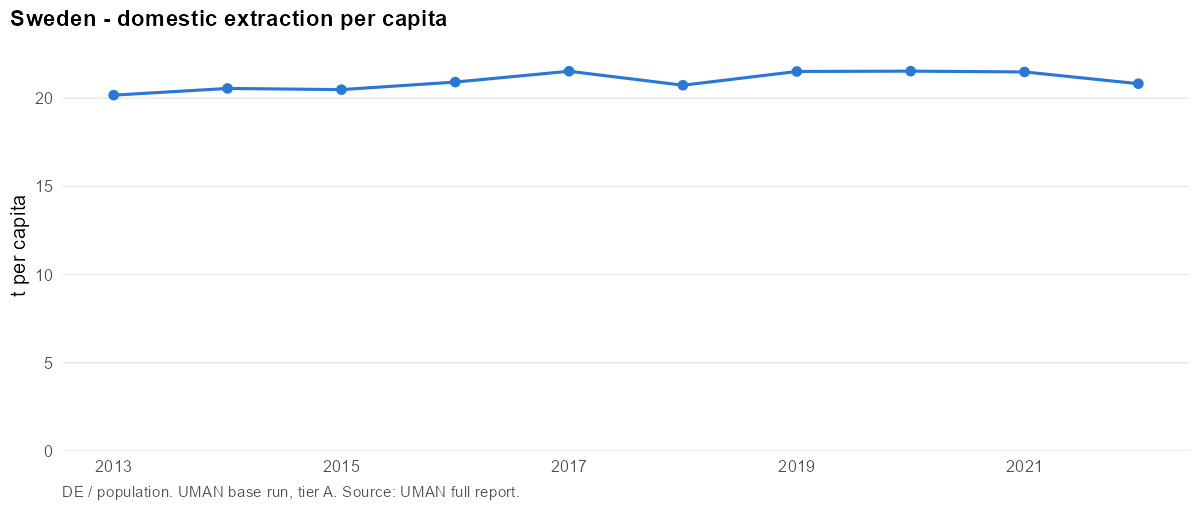
- Main CN4 codes (2019): 2517 Pebbles, gravel, broken or crushed stone, for concrete… (48%); 4403 Wood in the rough, whether or not stripped of bark or… (25%); 2601 Iron ores and concentrates, incl. roasted iron pyrites (13%); 1214 Swedes, mangolds, fodder roots, hay, alfalfa, clover… (3%); 4401 Fuel wood, in logs, billets, twigs, faggots or similar… (2%).
- Main materials: Stone (48%); Wood and wood fuels (27%); Iron, steel and ferro-alloys (13%).
International trade
Imports:
- Main CN4 codes (2019): 2709 Petroleum oils and oils obtained from bituminous minerals… (19%); 2710 Petroleum oils and oils obtained from bituminous minerals… (10%); 4403 Wood in the rough, whether or not stripped of bark or… (10%); 4401 Fuel wood, in logs, billets, twigs, faggots or similar… (4%); 3824 Prepared binders for foundry moulds or cores; chemical… (3%).
- Main materials: Fuels (18%); Wood and wood fuels (16%); Iron, steel and ferro-alloys (10%).
Exports:
- Main CN4 codes (2019): 2601 Iron ores and concentrates, incl. roasted iron pyrites (25%); 2710 Petroleum oils and oils obtained from bituminous minerals… (17%); 4407 Wood sawn or chipped lengthwise, sliced or peeled, whether… (7%); 4703 Chemical wood pulp, soda or sulphate (excl. dissolving… (4%); 4810 Paper and paperboard, coated on one or both sides with… (4%).
- Main materials: Iron, steel and ferro-alloys (36%); Fuels (16%); Wood and wood fuels (13%).
Domestic movement of goods
National territory: no domestic border, NI = NO = 0.
Available resources
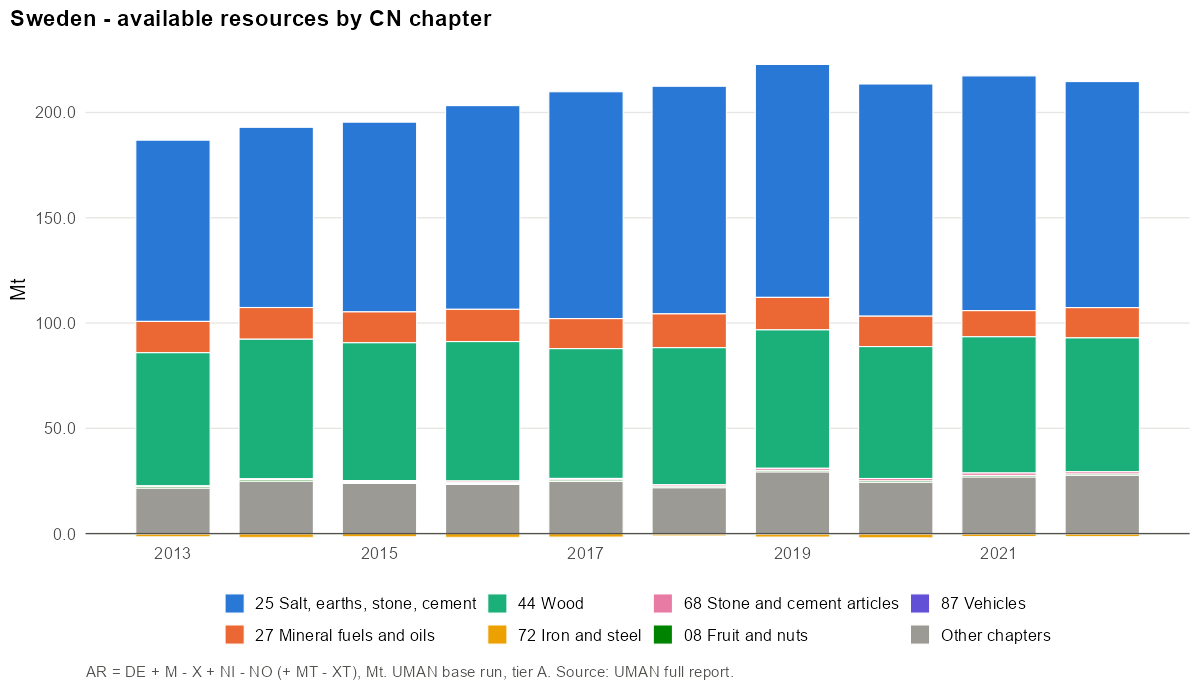
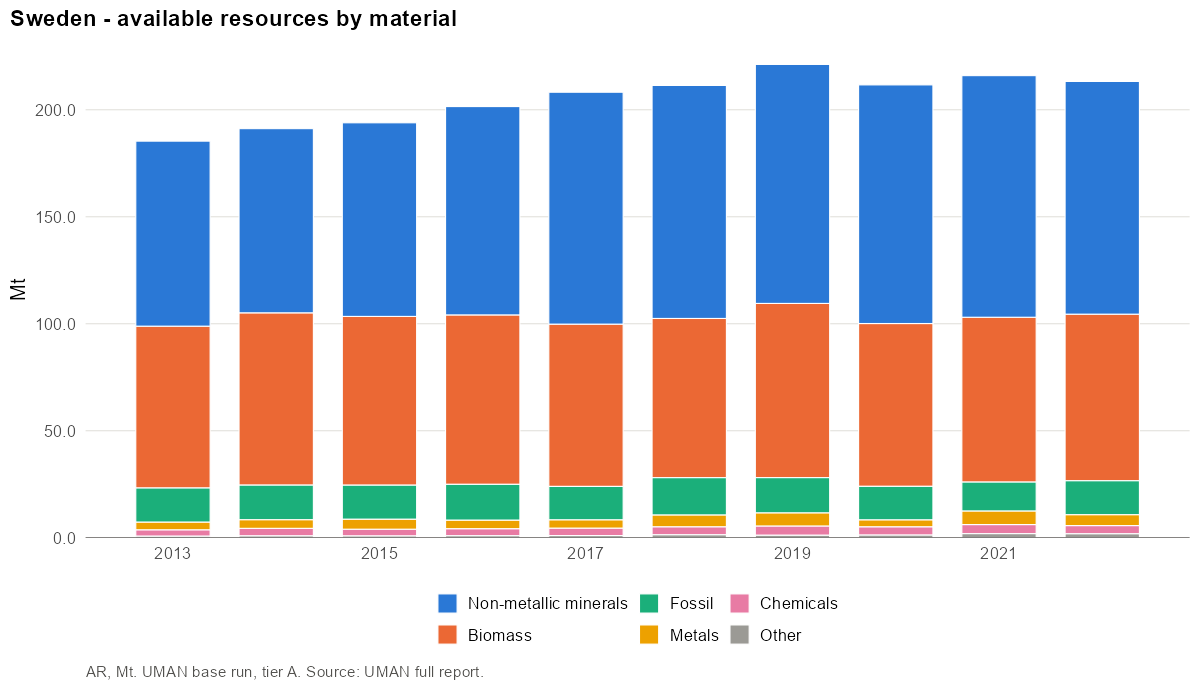
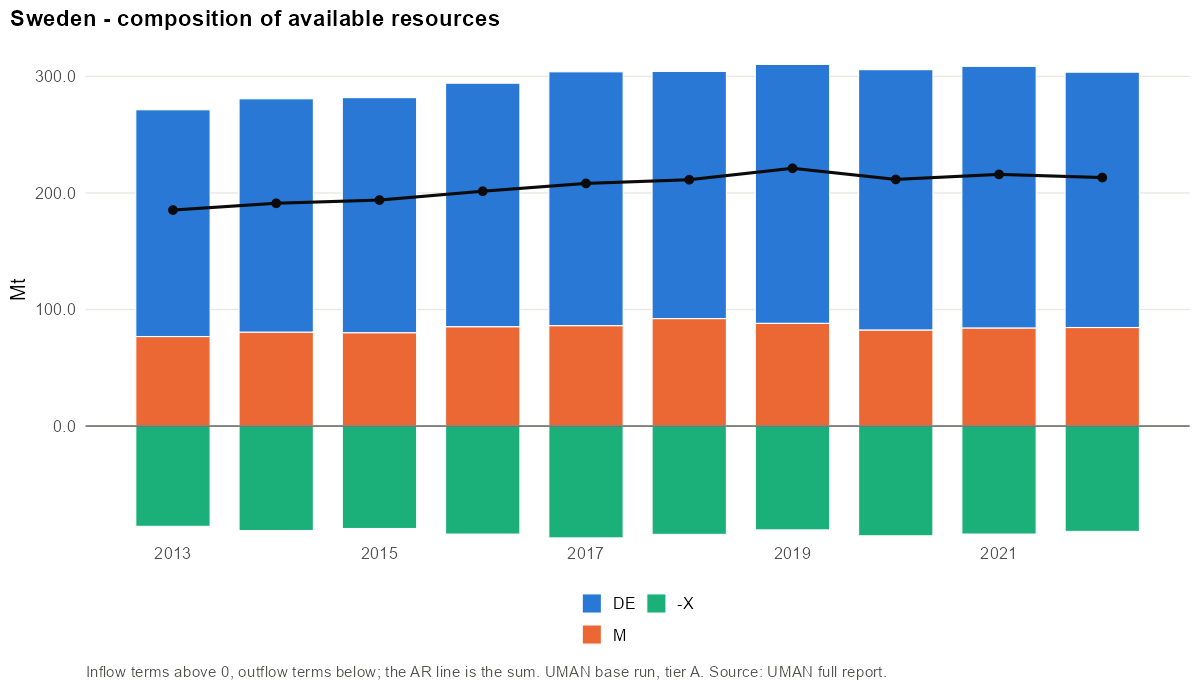
- Main CN4 codes (2019): 2517 Pebbles, gravel, broken or crushed stone, for concrete… (48%); 4403 Wood in the rough, whether or not stripped of bark or… (29%); 2709 Petroleum oils and oils obtained from bituminous minerals… (8%); 4401 Fuel wood, in logs, billets, twigs, faggots or similar… (3%); 2601 Iron ores and concentrates, incl. roasted iron pyrites (3%).
- Main materials: Stone (49%); Wood and wood fuels (28%); Agriculture biomass (10%).
Industrial production
Largest employers (NACE divisions):
| NACE | Activity | Persons | Share |
|---|---|---|---|
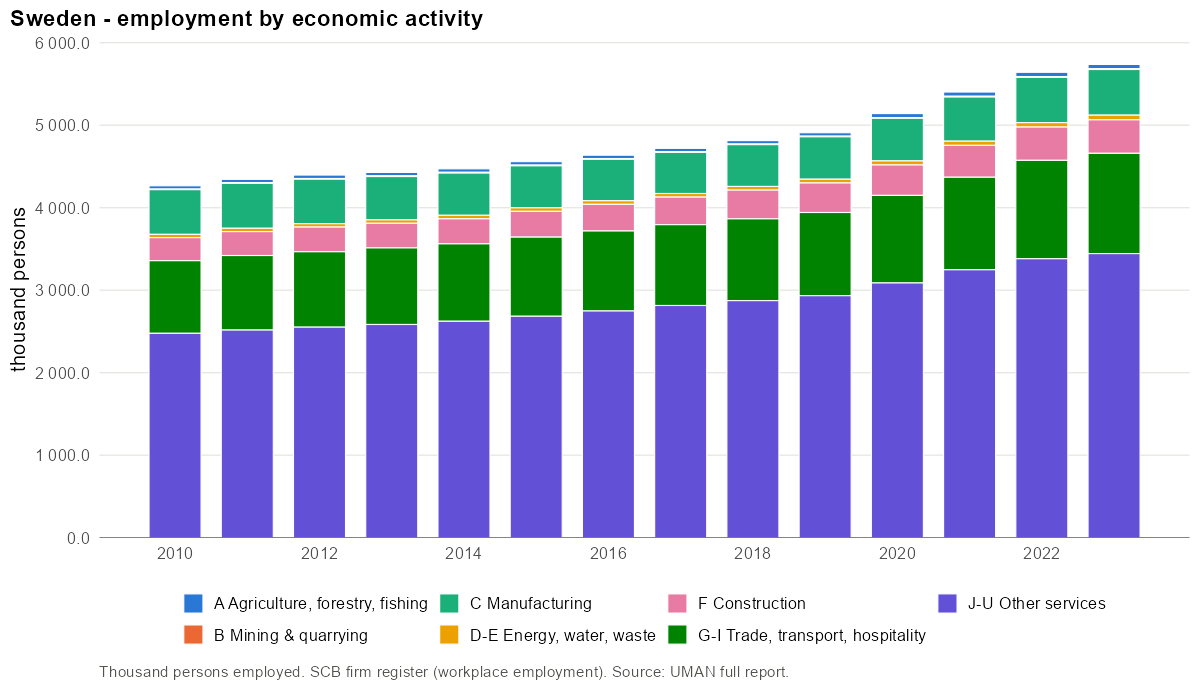
| 85 | Education | 516 872 | 10.5% |
| 86 | Human health activities | 317 563 | 6.5% |
| 88 | Social work activities without accommodation | 292 914 | 6.0% |
| 84 | Public administration and defence; compulsory social security | 290 399 | 5.9% |
| 47 | Retail trade, except of motor vehicles and motorcycles | 286 430 | 5.8% |
| 87 | Residential care activities | 248 644 | 5.1% |
| 43 | Specialised construction activities | 230 473 | 4.7% |
| 46 | Wholesale trade, except of motor vehicles and motorcycles | 213 153 | 4.3% |
Product transformation
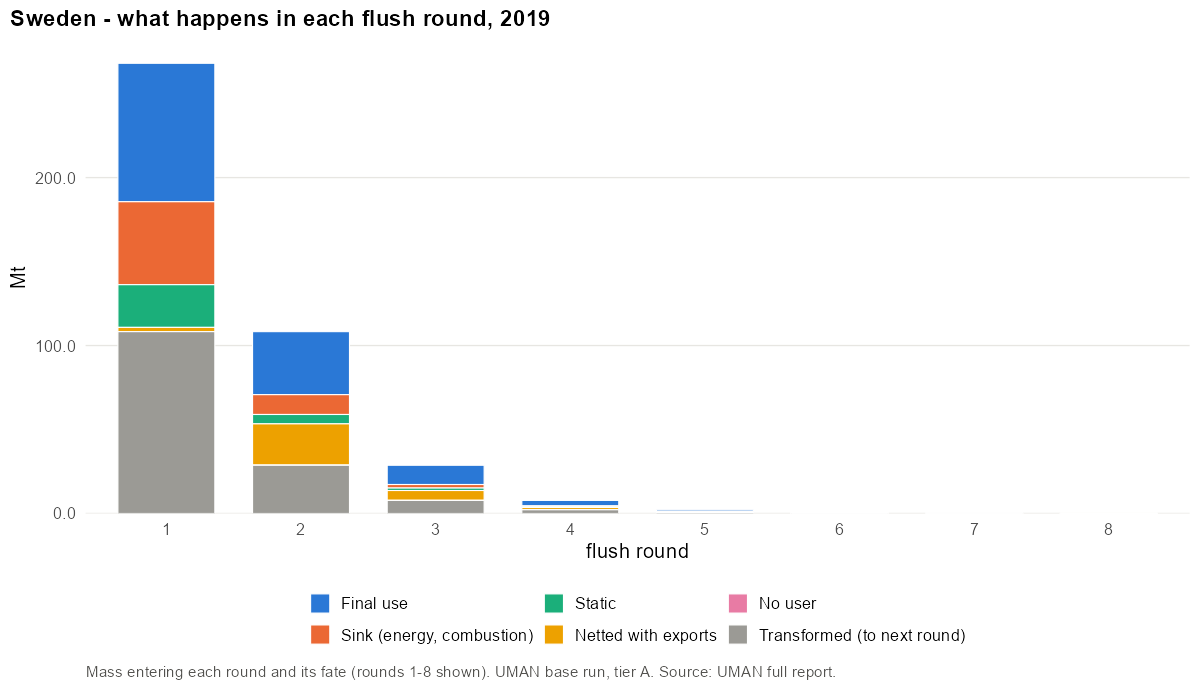
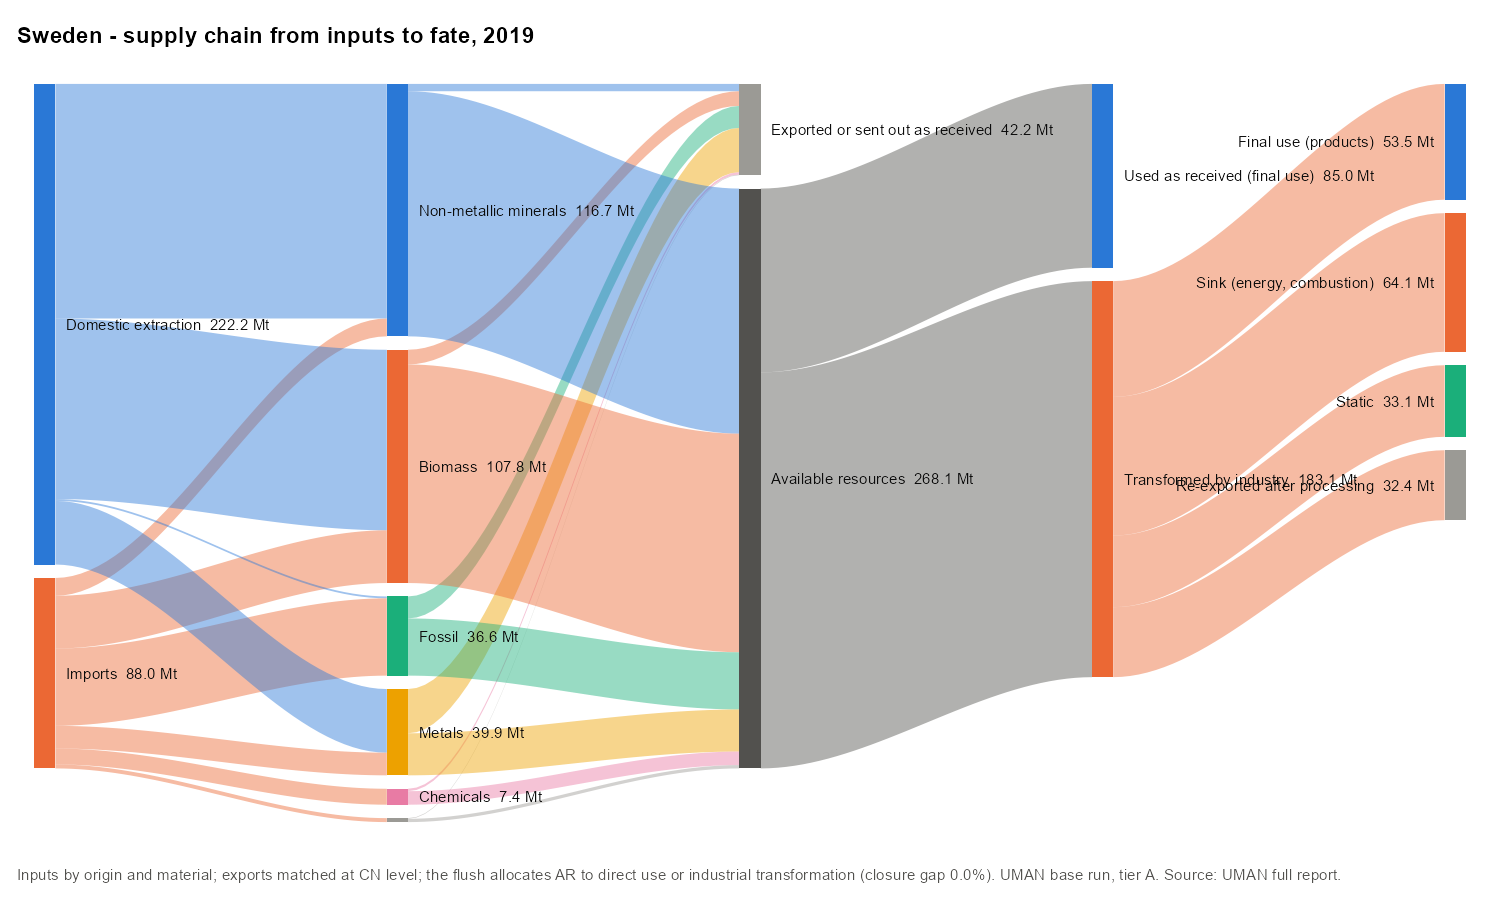
The flush needed 12 rounds. Round 1 handled 268.1 Mt; 40% of it was transformed into other products and re-entered round 2.
Domestic material consumption
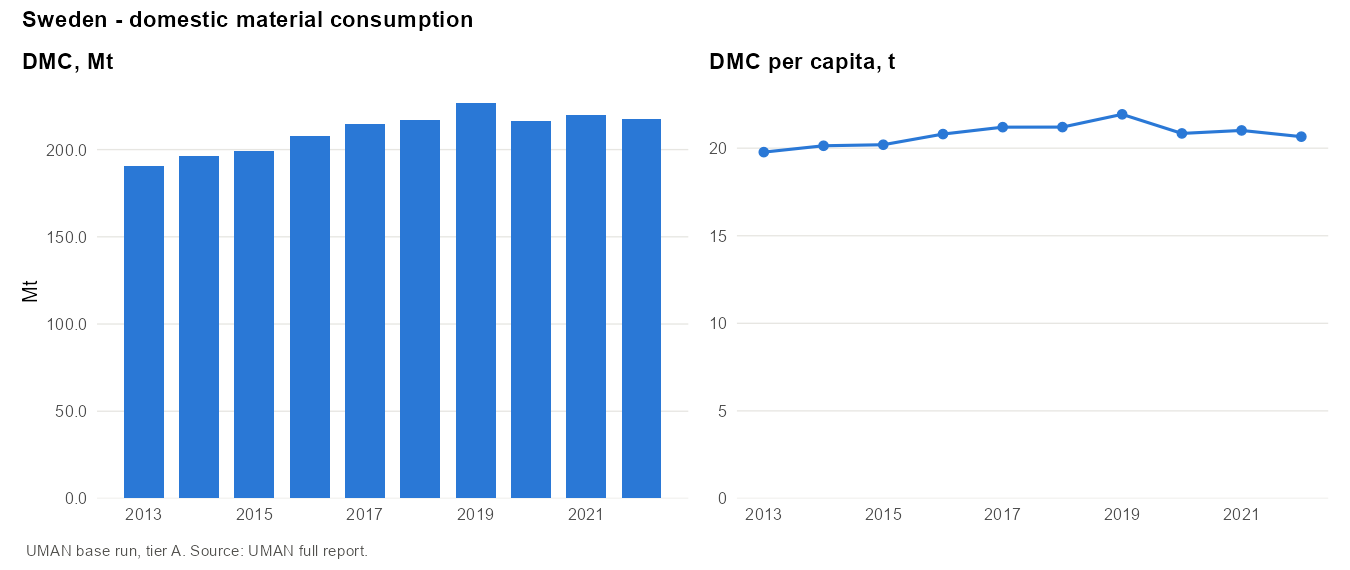
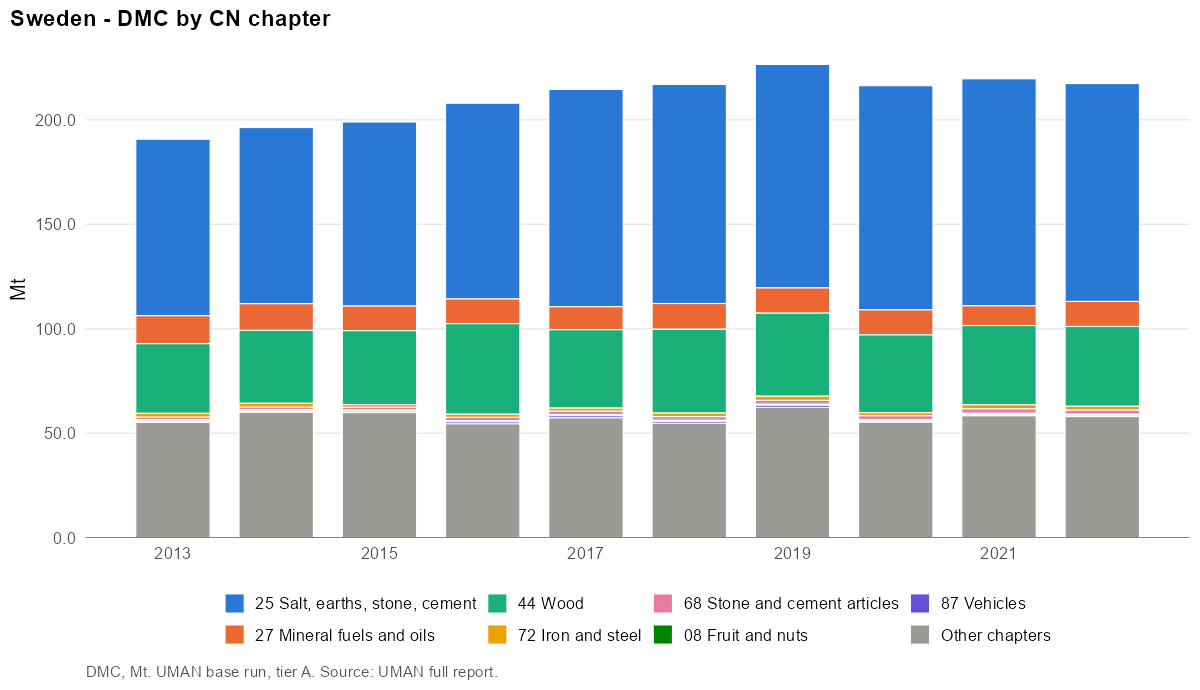
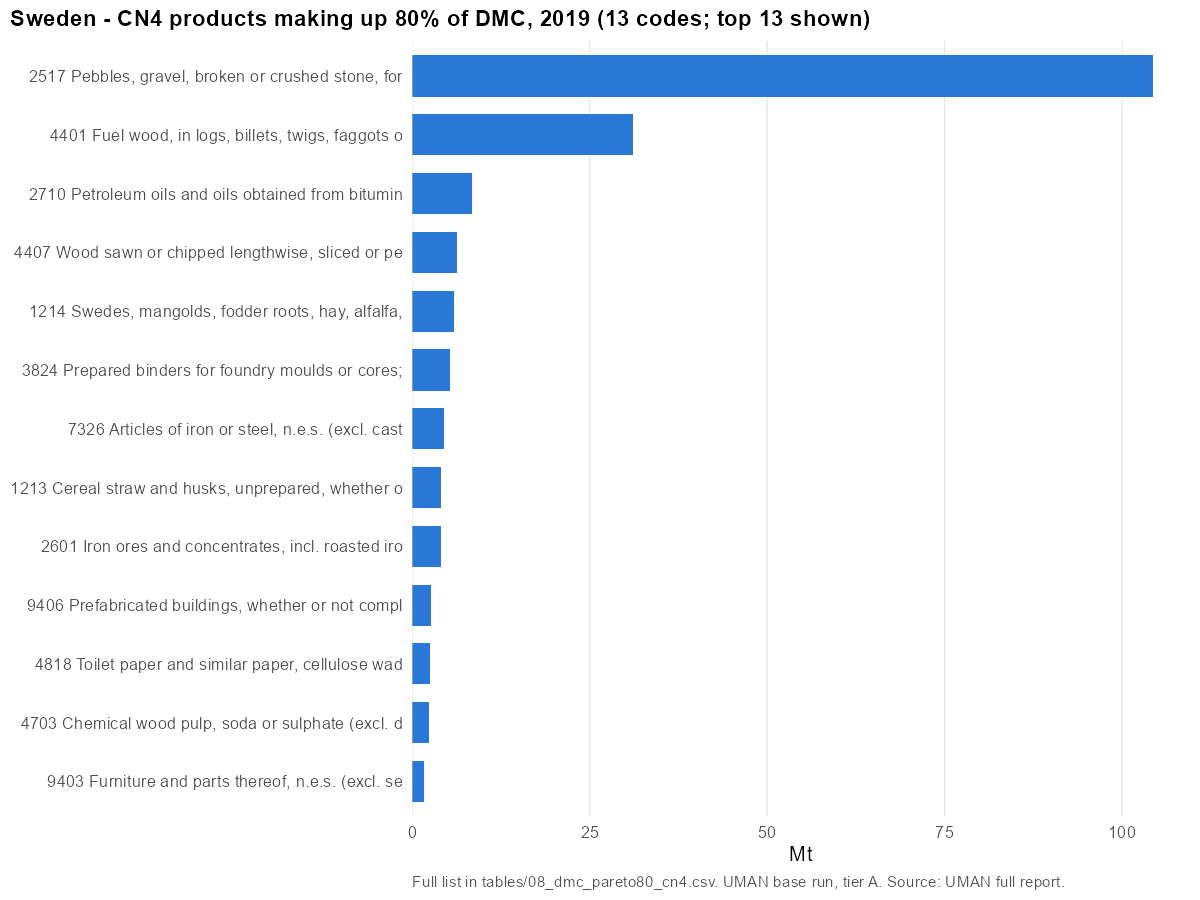
- Main CN4 codes (2019): 2517 Pebbles, gravel, broken or crushed stone, for concrete… (46%); 4401 Fuel wood, in logs, billets, twigs, faggots or similar… (14%); 2710 Petroleum oils and oils obtained from bituminous minerals… (4%); 4407 Wood sawn or chipped lengthwise, sliced or peeled, whether… (3%); 1214 Swedes, mangolds, fodder roots, hay, alfalfa, clover… (3%).
- Main materials: Stone (47%); Wood and wood fuels (19%); Agriculture biomass (8%).
13 CN4 codes make up 80% of DMC in 2019. Top 10:
| Rank | CN4 | Product | Mt | Share | Cumulative |
|---|---|---|---|---|---|
| 1 | 2517 | Pebbles, gravel, broken or crushed stone, for concrete… | 104.31 | 46.0% | 46% |
| 2 | 4401 | Fuel wood, in logs, billets, twigs, faggots or similar… | 31.06 | 13.7% | 60% |
| 3 | 2710 | Petroleum oils and oils obtained from bituminous minerals… | 8.40 | 3.7% | 63% |
| 4 | 4407 | Wood sawn or chipped lengthwise, sliced or peeled, whether… | 6.25 | 2.8% | 66% |
| 5 | 1214 | Swedes, mangolds, fodder roots, hay, alfalfa, clover… | 5.92 | 2.6% | 69% |
| 6 | 3824 | Prepared binders for foundry moulds or cores; chemical… | 5.28 | 2.3% | 71% |
| 7 | 7326 | Articles of iron or steel, n.e.s. (excl. cast articles) | 4.41 | 1.9% | 73% |
| 8 | 1213 | Cereal straw and husks, unprepared, whether or not chopped… | 4.03 | 1.8% | 75% |
| 9 | 2601 | Iron ores and concentrates, incl. roasted iron pyrites | 4.01 | 1.8% | 77% |
| 10 | 9406 | Prefabricated buildings, whether or not complete or already… | 2.63 | 1.2% | 78% |
Metrics
| Year | DMC/cap | AR/cap | DE/cap | Import dep. | Intl import dep. | Self-suff. | Export int. |
|---|---|---|---|---|---|---|---|
| 2013 | 19.8 | 19.2 | 20.2 | 28% | 28% | 102% | 32% |
| 2014 | 20.1 | 19.6 | 20.6 | 29% | 29% | 102% | 32% |
| 2015 | 20.2 | 19.7 | 20.5 | 28% | 28% | 101% | 31% |
| 2016 | 20.8 | 20.2 | 20.9 | 29% | 29% | 101% | 32% |
| 2017 | 21.2 | 20.6 | 21.5 | 28% | 28% | 102% | 32% |
| 2018 | 21.2 | 20.7 | 20.7 | 30% | 30% | 98% | 31% |
| 2019 | 21.9 | 21.4 | 21.5 | 28% | 28% | 98% | 29% |
| 2020 | 20.8 | 20.4 | 21.5 | 27% | 27% | 103% | 31% |
| 2021 | 21.0 | 20.7 | 21.5 | 27% | 27% | 102% | 30% |
| 2022 | 20.7 | 20.3 | 20.8 | 28% | 28% | 101% | 30% |
Södra Sverige (SE2)
Sweden · NUTS 1 · code SE2 · tier A · years 2013–2022
Findings
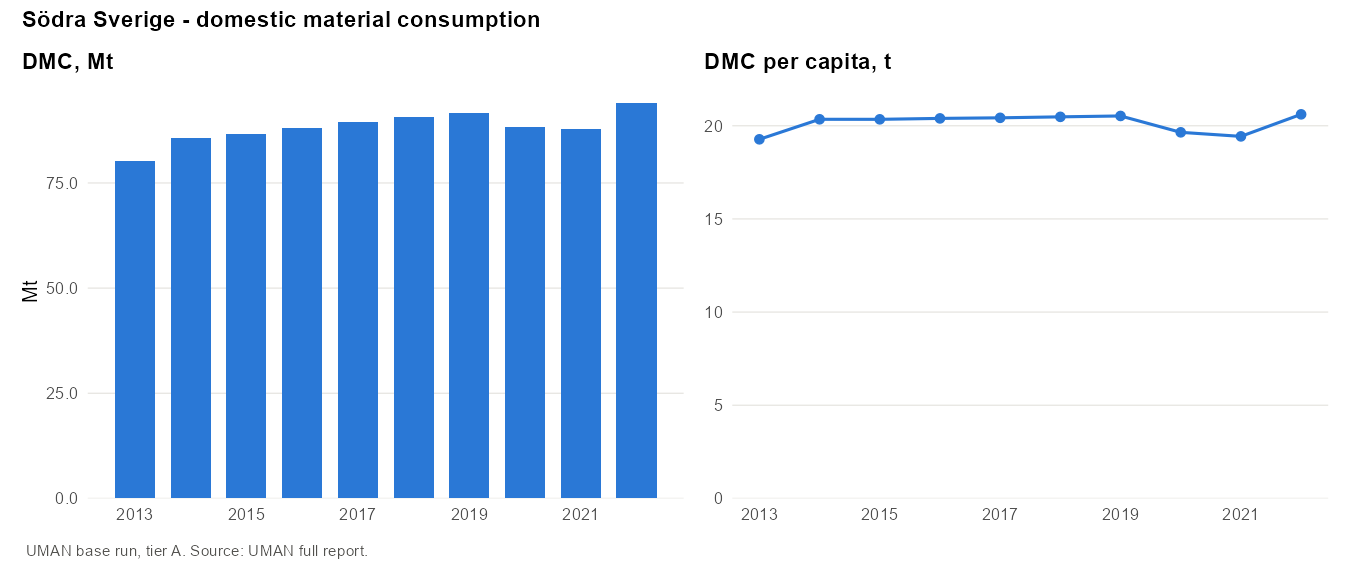
- Södra Sverige was calculated for this report. It has 4.47 million inhabitants, 43% of Sweden. DMC is 91.7 Mt or 20.5 t/cap in 2019, stable between 19.3 and 20.6 t/cap over 2013–2022 and slightly below the national level.
- Extraction covers most of consumption: DE is 18.3 t/cap (self-sufficiency 0.89), 61% crushed stone and 20% roundwood. Outside Västra Götaland, DE is downscaled from Sweden by jobs.
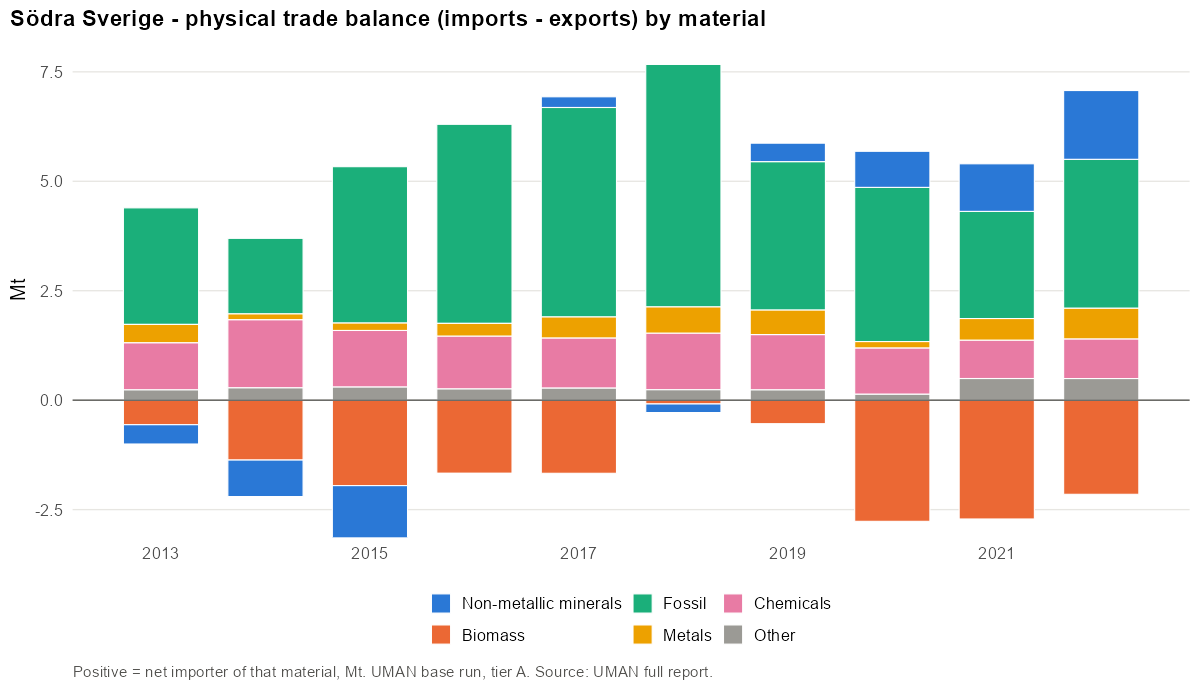
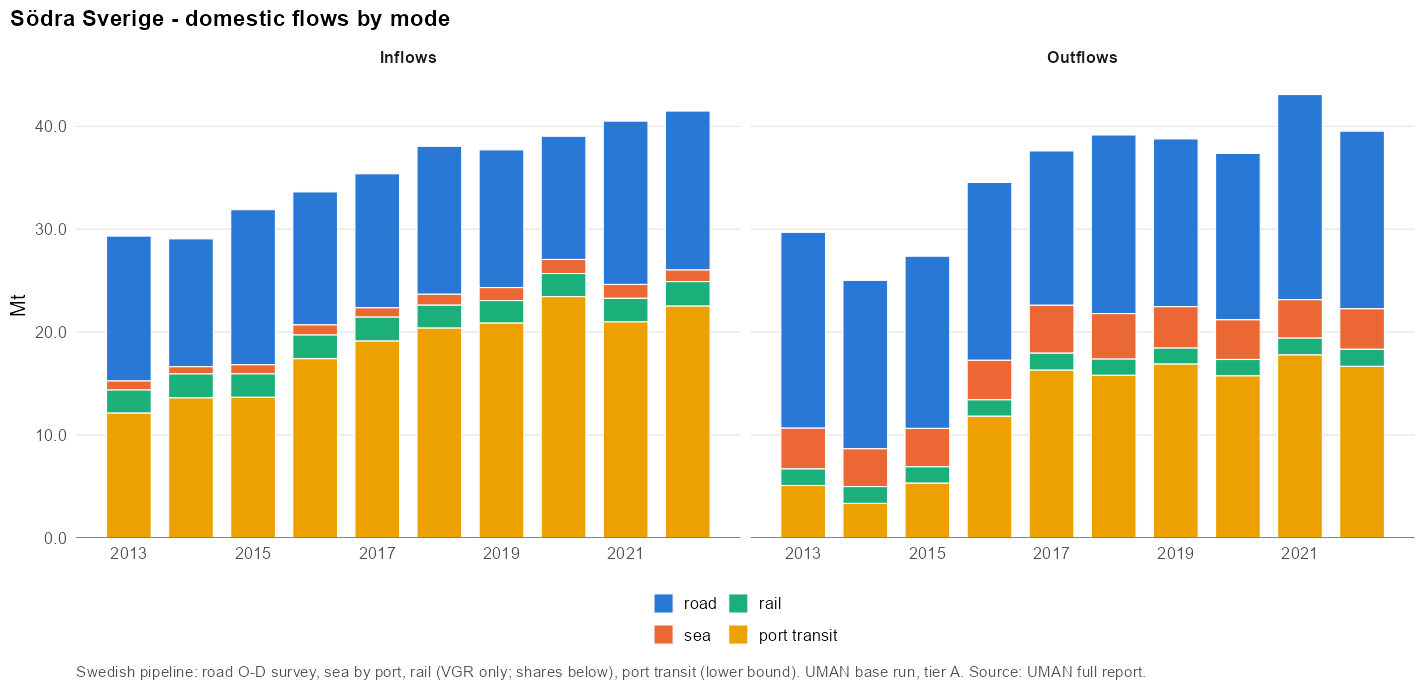
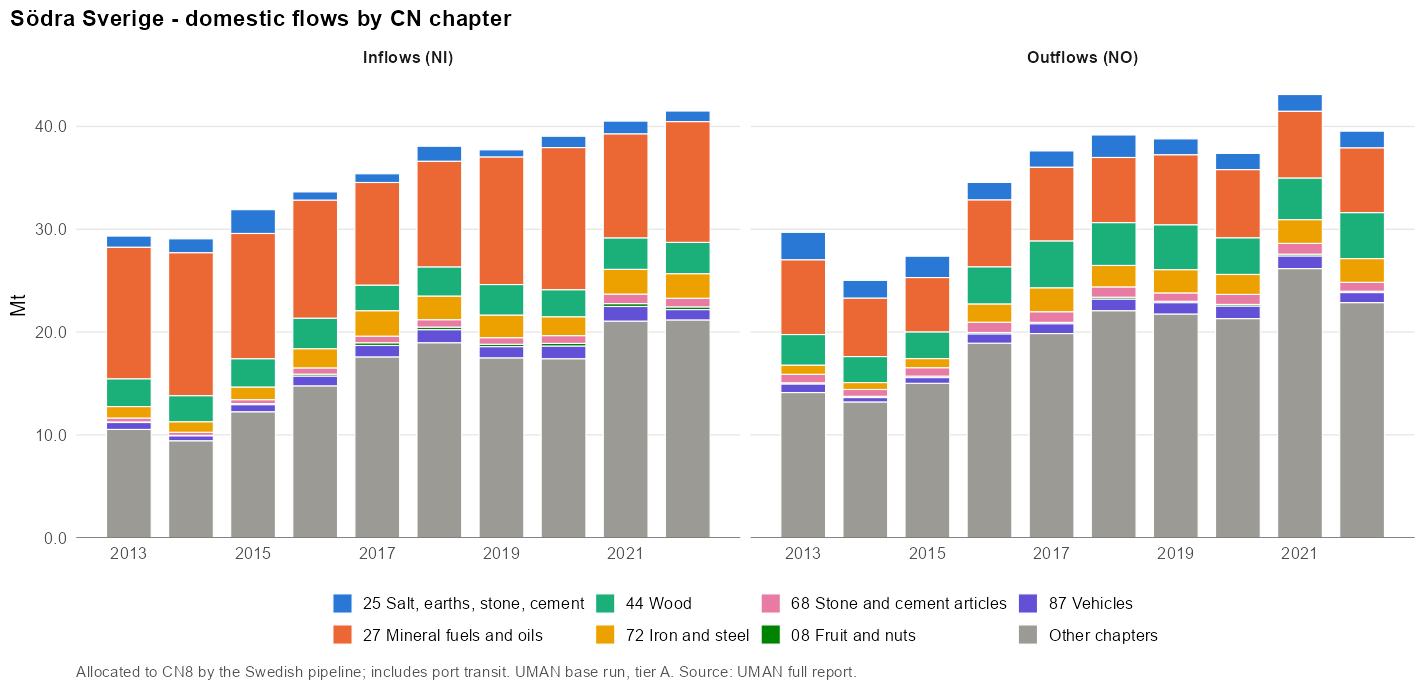
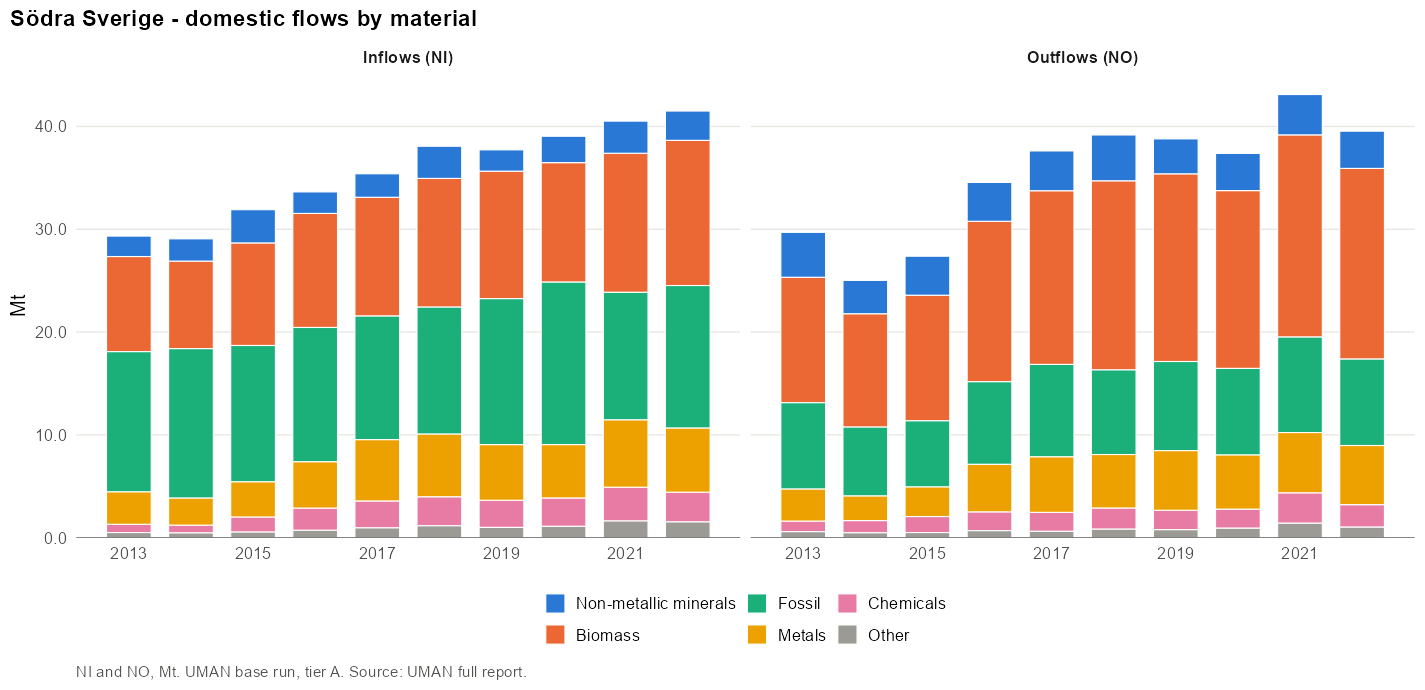
- Domestic exchange with the rest of Sweden is large and balanced: 37.7 Mt in and 38.8 Mt out, about as large as international trade (34.6 Mt imports, 29.2 Mt exports). Refined petroleum products lead both directions (14–15%), followed by wood and pulp. Import dependency is 47%, of which international 30%.
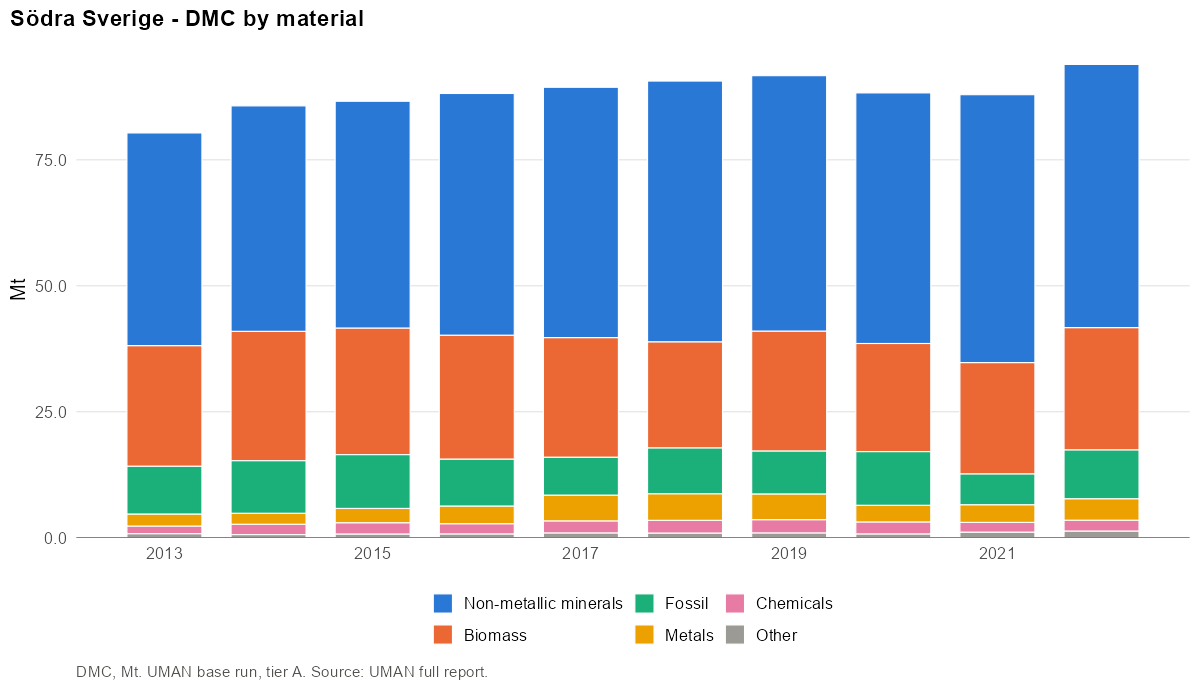
- DMC composition: 55% non-metallic minerals, 26% biomass, 9% fossil. Crushed stone is 52% of DMC; 14 CN4 codes make up 80%.
- Re-exports after processing are high (20.7 Mt) compared with final use of manufactured products (18.4 Mt), pointing to an export-oriented processing industry (refining, sawmills, pulp).
- Caveats: rail is observed only for Västra Götaland; the port of Löten (0.6 Mt) could not be located; DE outside VGR is modelled.
Overview
| 2013 | 2019 | 2022 | |
|---|---|---|---|
| Population | 4 168 176 | 4 467 362 | 4 556 857 |
| DE (Mt) | 72.8 | 81.9 | 81.7 |
| Imports M (Mt) | 31.7 | 34.6 | 35.8 |
| Exports X (Mt) | 28.3 | 29.2 | 30.9 |
| Domestic in NI (Mt) | 29.3 | 37.7 | 41.5 |
| Domestic out NO (Mt) | 29.7 | 38.8 | 39.5 |
| AR (Mt) | 75.8 | 86.2 | 88.6 |
| DMC (Mt) | 80.3 | 91.7 | 93.9 |
| DMC (t/cap) | 19.3 | 20.5 | 20.6 |
| Unbalanced (% of gross AR) | 4.4% | 4.8% | 4.4% |
Domestic extraction
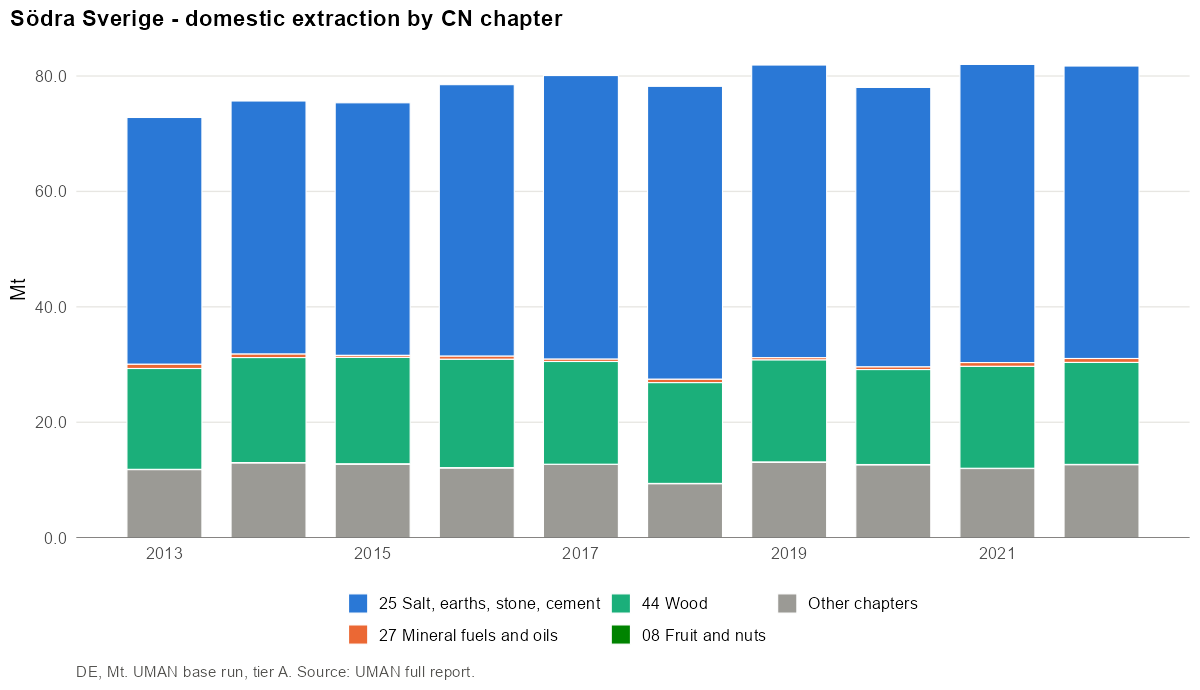
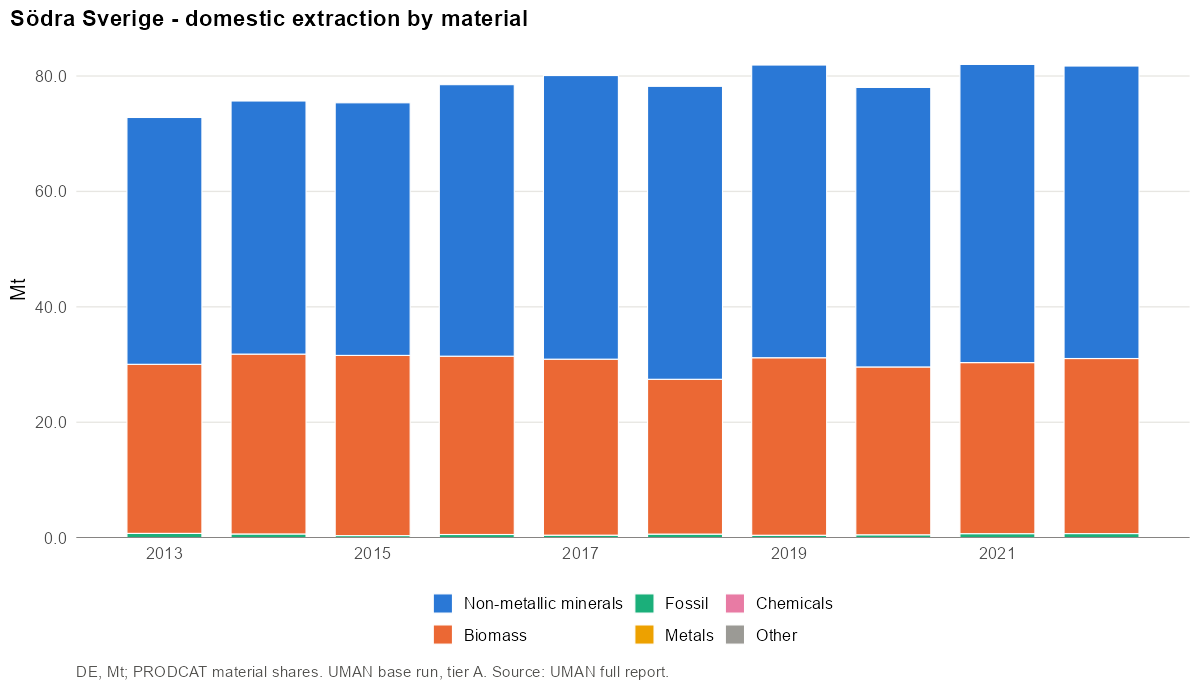
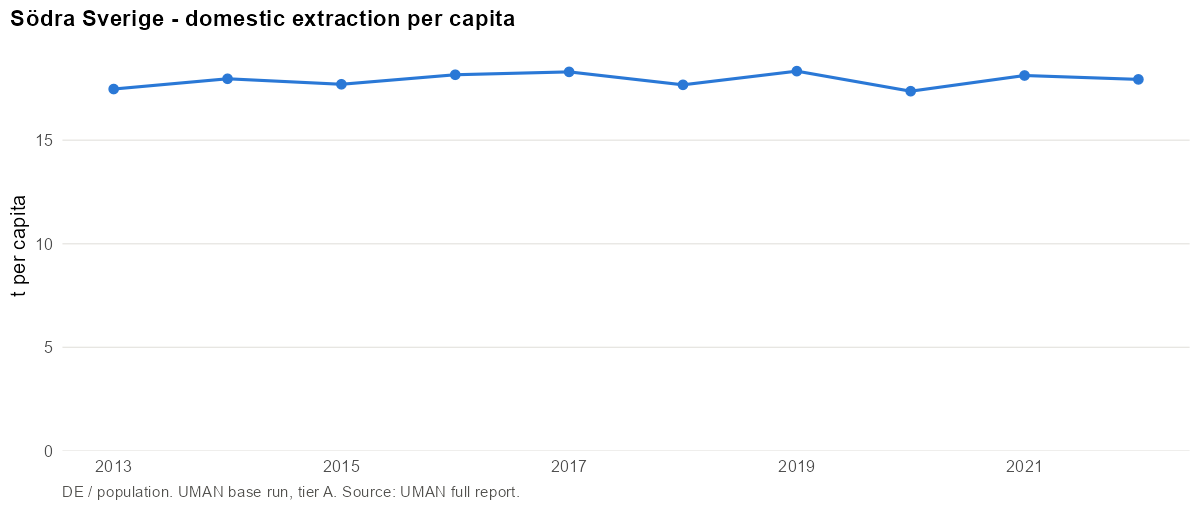
- Main CN4 codes (2019): 2517 Pebbles, gravel, broken or crushed stone, for concrete… (61%); 4403 Wood in the rough, whether or not stripped of bark or… (20%); 1214 Swedes, mangolds, fodder roots, hay, alfalfa, clover… (4%); 1213 Cereal straw and husks, unprepared, whether or not chopped… (3%); 1001 Wheat and meslin (2%).
- Main materials: Stone (61%); Wood and wood fuels (22%); Agriculture biomass (13%).
International trade
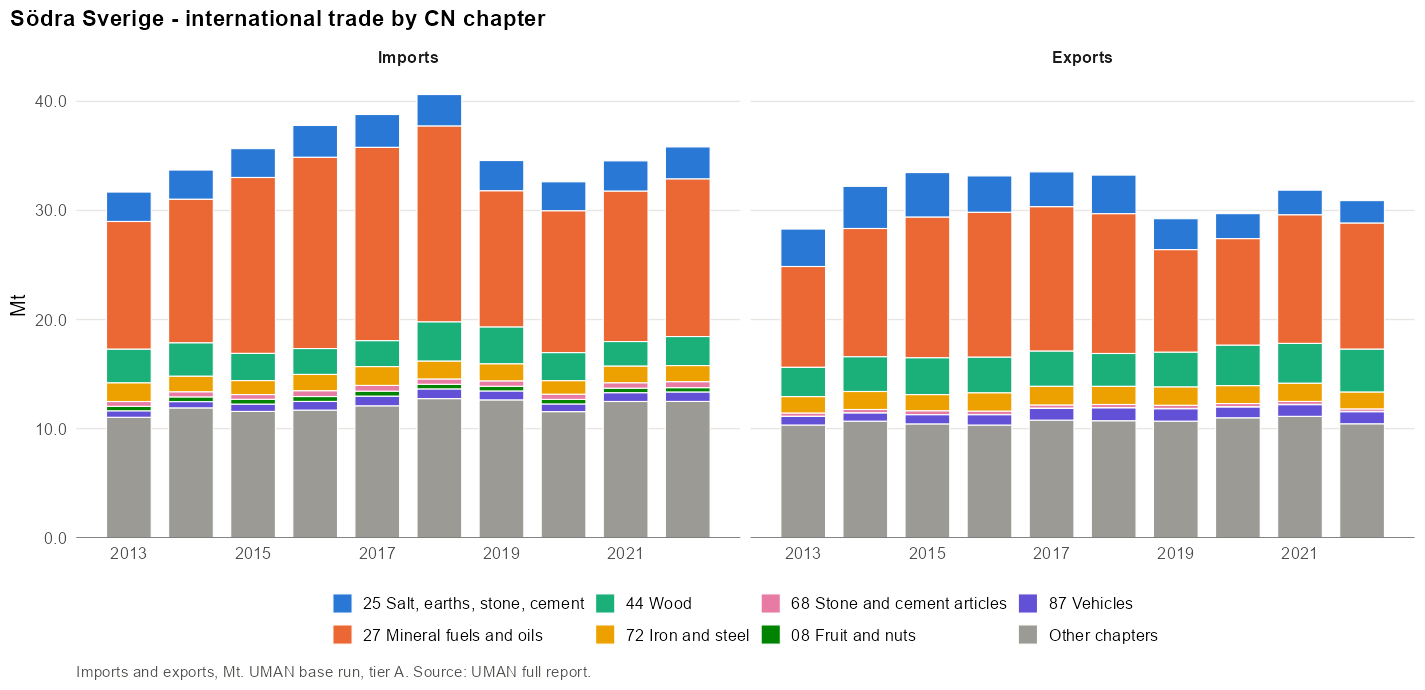
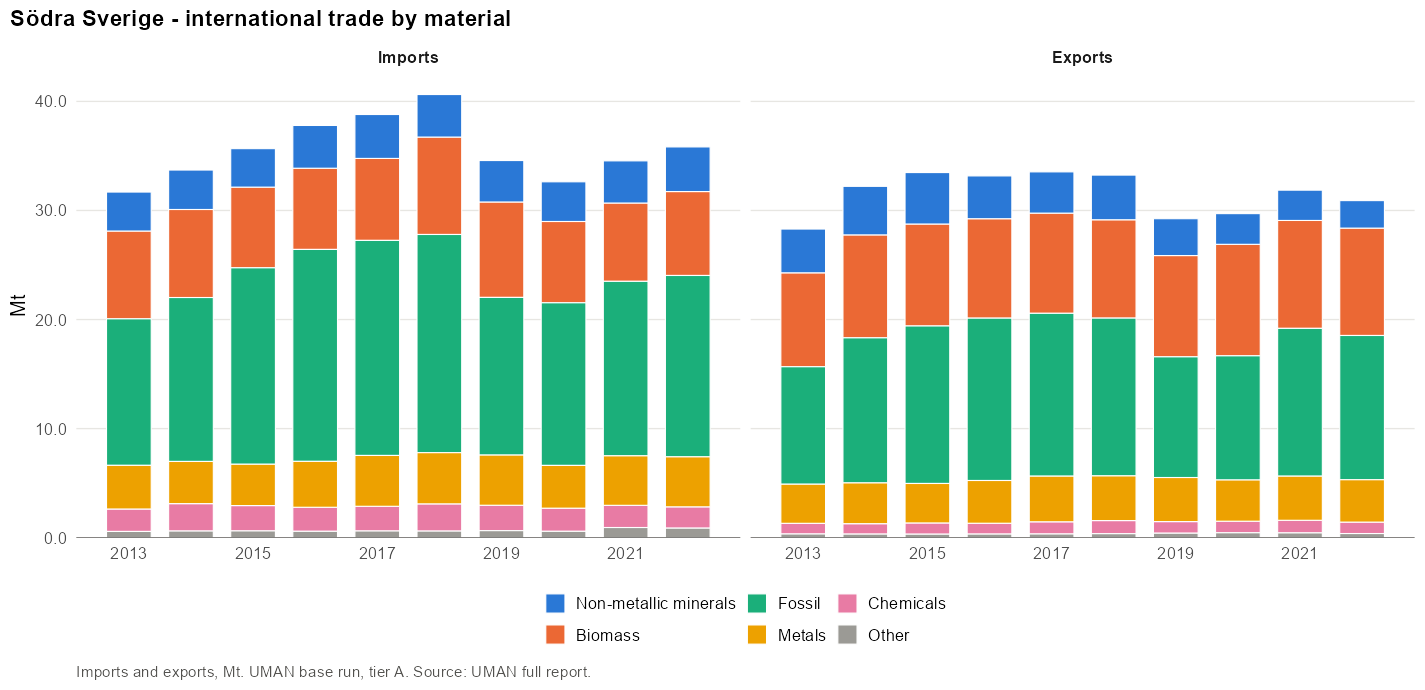
Imports:
- Main CN4 codes (2019): 2709 Petroleum oils and oils obtained from bituminous minerals… (26%); 2710 Petroleum oils and oils obtained from bituminous minerals… (6%); 4403 Wood in the rough, whether or not stripped of bark or… (6%); 2711 Petroleum gas and other gaseous hydrocarbons (3%); 4401 Fuel wood, in logs, billets, twigs, faggots or similar… (2%).
- Main materials: Fuels (15%); Plastics and rubbers (12%); Iron, steel and ferro-alloys (11%).
Exports:
- Main CN4 codes (2019): 2710 Petroleum oils and oils obtained from bituminous minerals… (30%); 4407 Wood sawn or chipped lengthwise, sliced or peeled, whether… (8%); 4703 Chemical wood pulp, soda or sulphate (excl. dissolving… (5%); 2517 Pebbles, gravel, broken or crushed stone, for concrete… (4%); 7204 Ferrous waste and scrap; remelting scrap ingots of iron or… (4%).
- Main materials: Fuels (29%); Wood and wood fuels (16%); Iron, steel and ferro-alloys (12%).
Domestic movement of goods
Inflows:
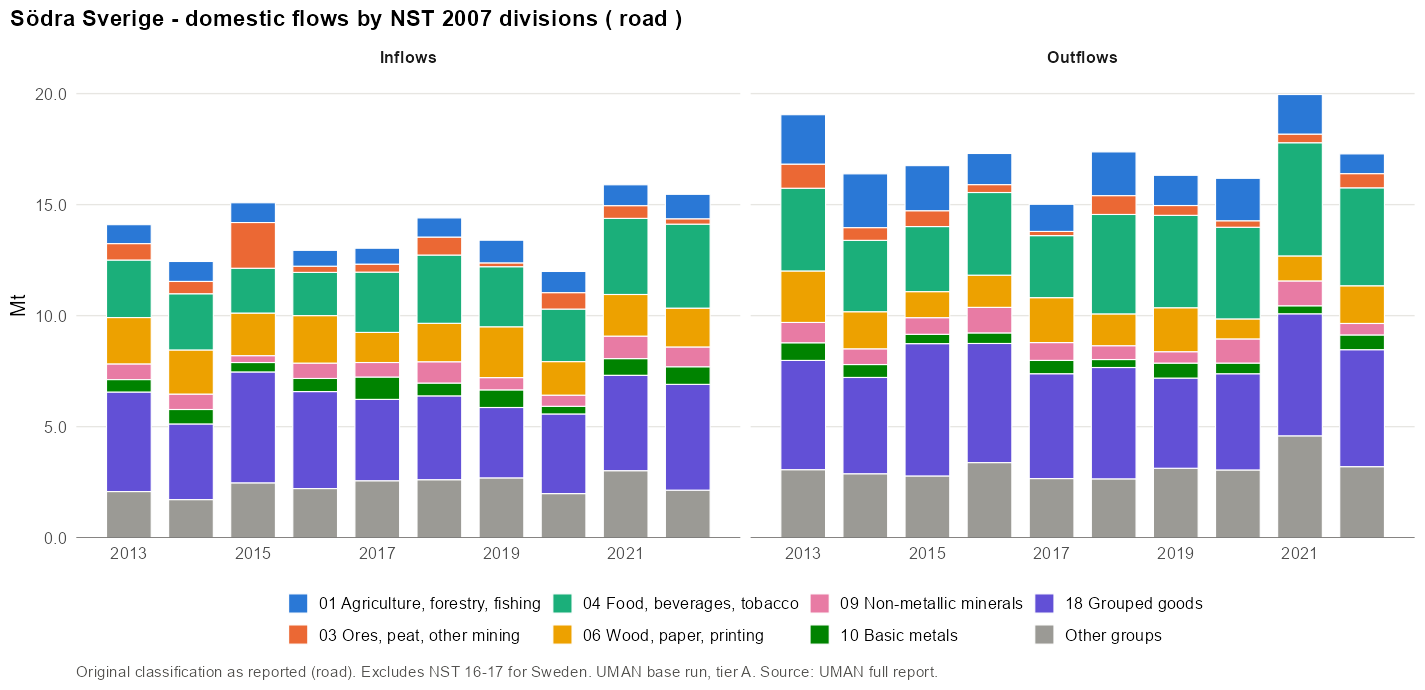
- Main CN4 codes (2019): 2710 Petroleum oils and oils obtained from bituminous minerals… (14%); 2709 Petroleum oils and oils obtained from bituminous minerals… (13%); 4403 Wood in the rough, whether or not stripped of bark or… (3%); 3824 Prepared binders for foundry moulds or cores; chemical… (3%); 4407 Wood sawn or chipped lengthwise, sliced or peeled, whether… (2%).
- Main materials: Fuels (19%); Iron, steel and ferro-alloys (12%); Wood and wood fuels (10%).
Outflows:
- Main CN4 codes (2019): 2710 Petroleum oils and oils obtained from bituminous minerals… (15%); 4407 Wood sawn or chipped lengthwise, sliced or peeled, whether… (6%); 4703 Chemical wood pulp, soda or sulphate (excl. dissolving… (4%); 4403 Wood in the rough, whether or not stripped of bark or… (3%); 4810 Paper and paperboard, coated on one or both sides with… (2%).
- Main materials: Wood and wood fuels (16%); Fuels (15%); Agriculture biomass (13%).
Available resources
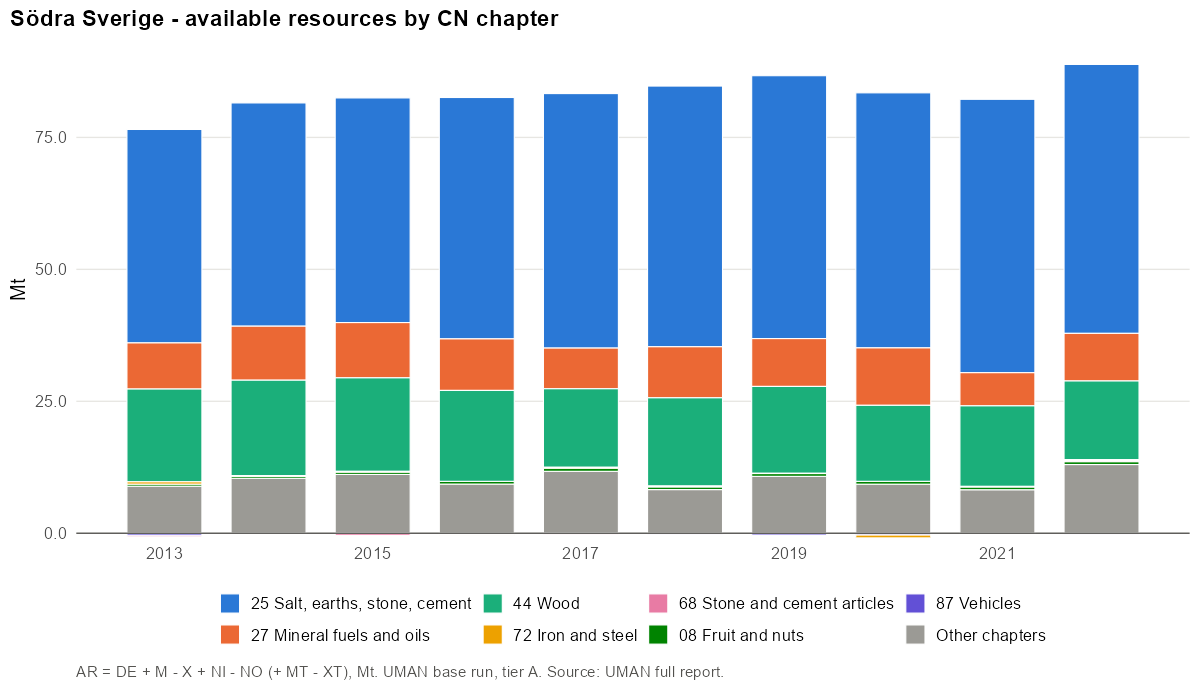
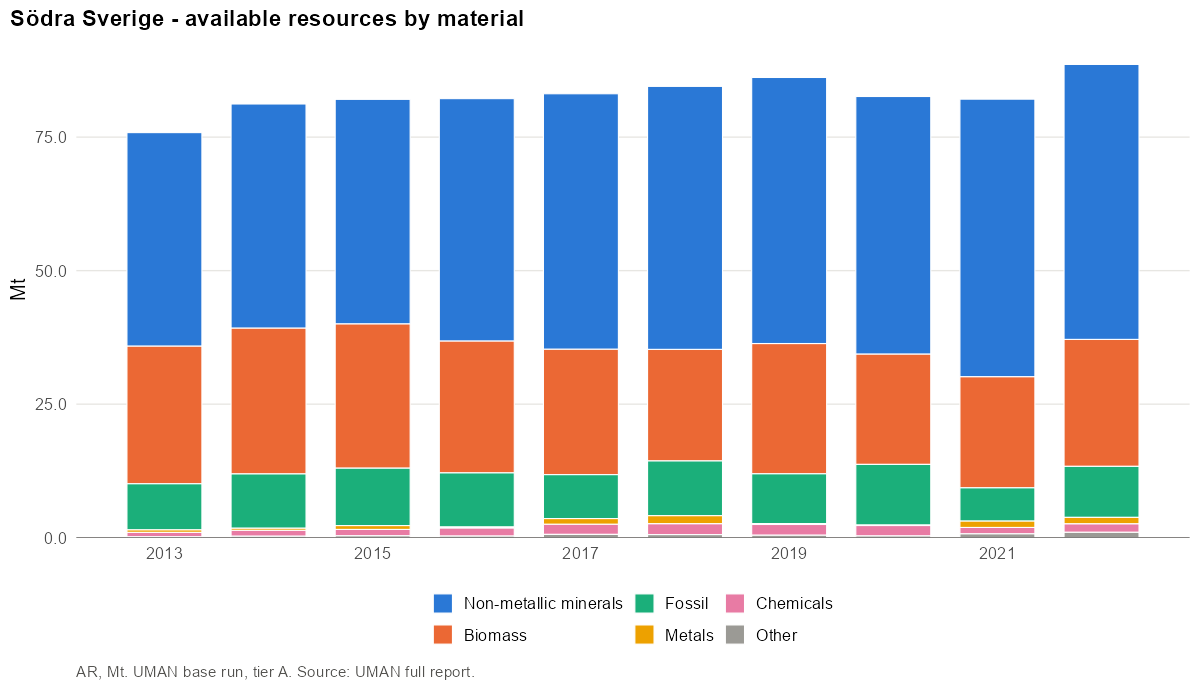
- Main CN4 codes (2019): 2517 Pebbles, gravel, broken or crushed stone, for concrete… (56%); 4403 Wood in the rough, whether or not stripped of bark or… (21%); 2709 Petroleum oils and oils obtained from bituminous minerals… (16%); 1214 Swedes, mangolds, fodder roots, hay, alfalfa, clover… (3%); 1213 Cereal straw and husks, unprepared, whether or not chopped… (2%).
- Main materials: Stone (56%); Wood and wood fuels (16%); Agriculture biomass (13%).
Industrial production
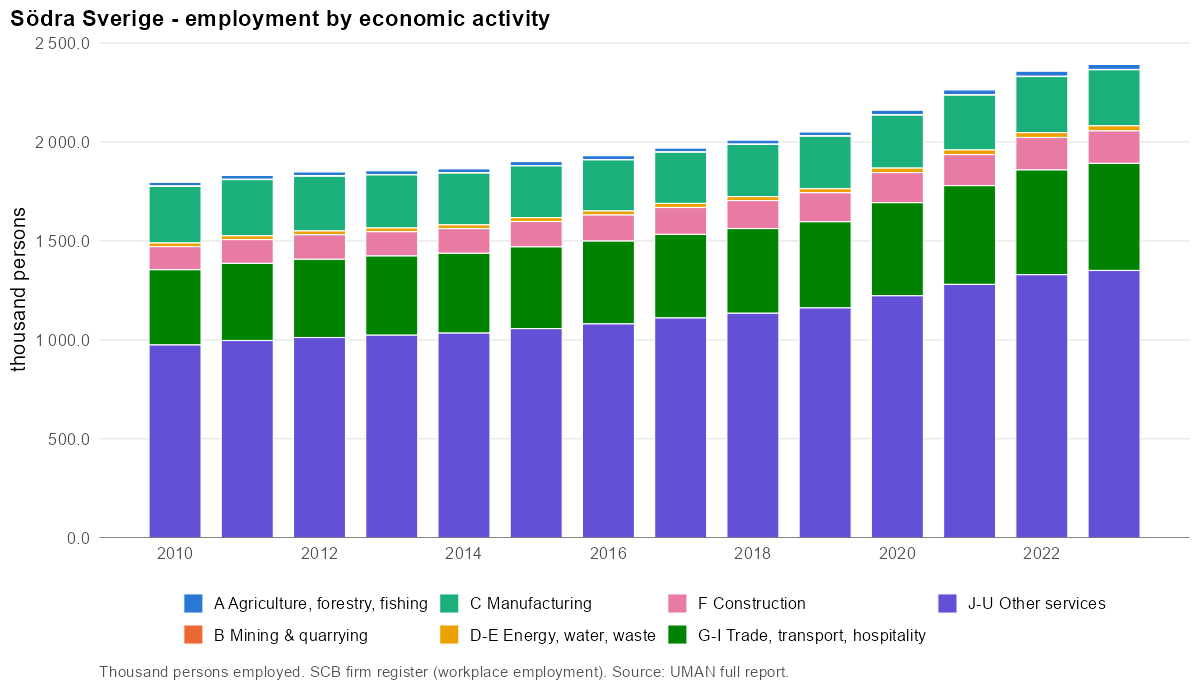
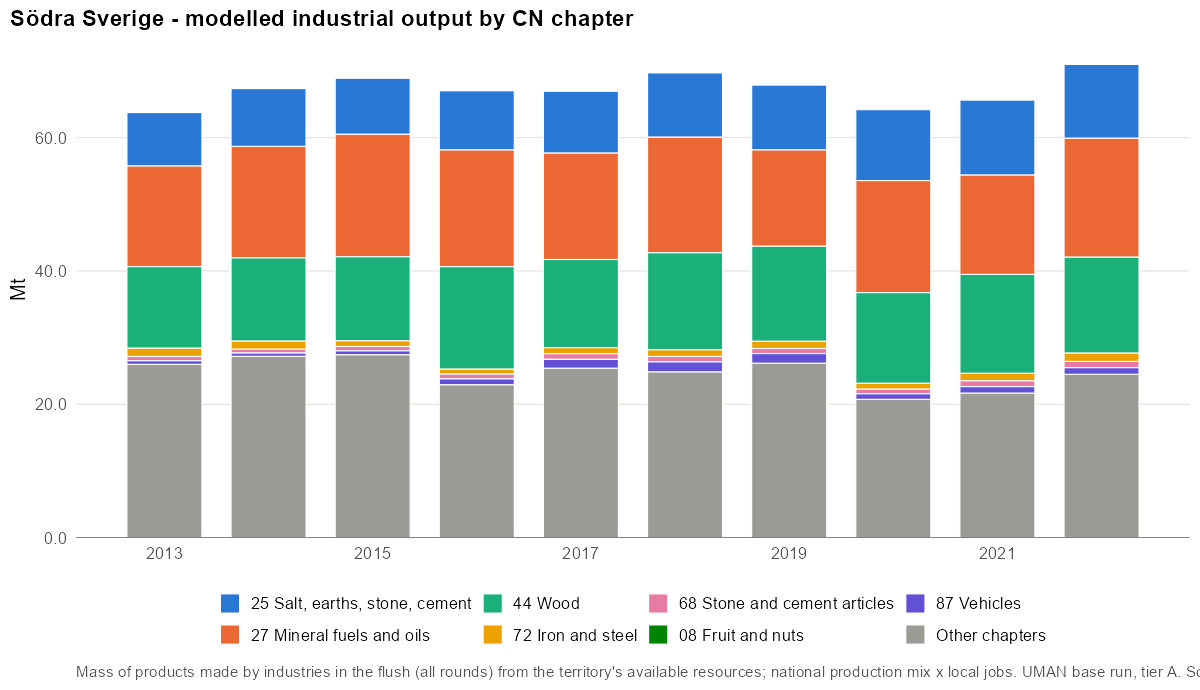
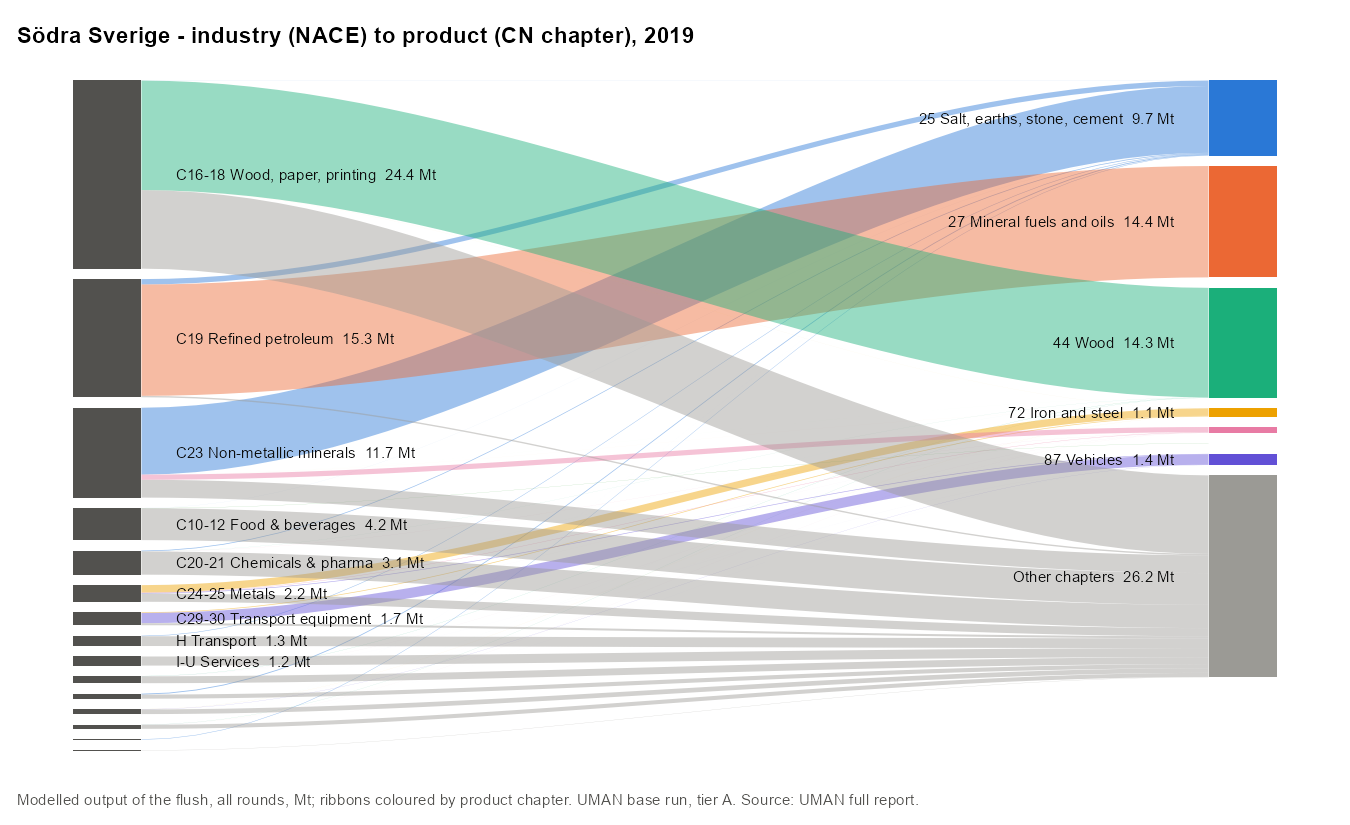
Largest employers (NACE divisions):
| NACE | Activity | Persons | Share |
|---|---|---|---|
| 85 | Education | 218 141 | 10.6% |
| 86 | Human health activities | 138 431 | 6.8% |
| 47 | Retail trade, except of motor vehicles and motorcycles | 123 274 | 6.0% |
| 88 | Social work activities without accommodation | 122 541 | 6.0% |
| 84 | Public administration and defence; compulsory social security | 112 889 | 5.5% |
| 87 | Residential care activities | 109 351 | 5.3% |
| 46 | Wholesale trade, except of motor vehicles and motorcycles | 98 429 | 4.8% |
| 43 | Specialised construction activities | 93 157 | 4.5% |
Product transformation
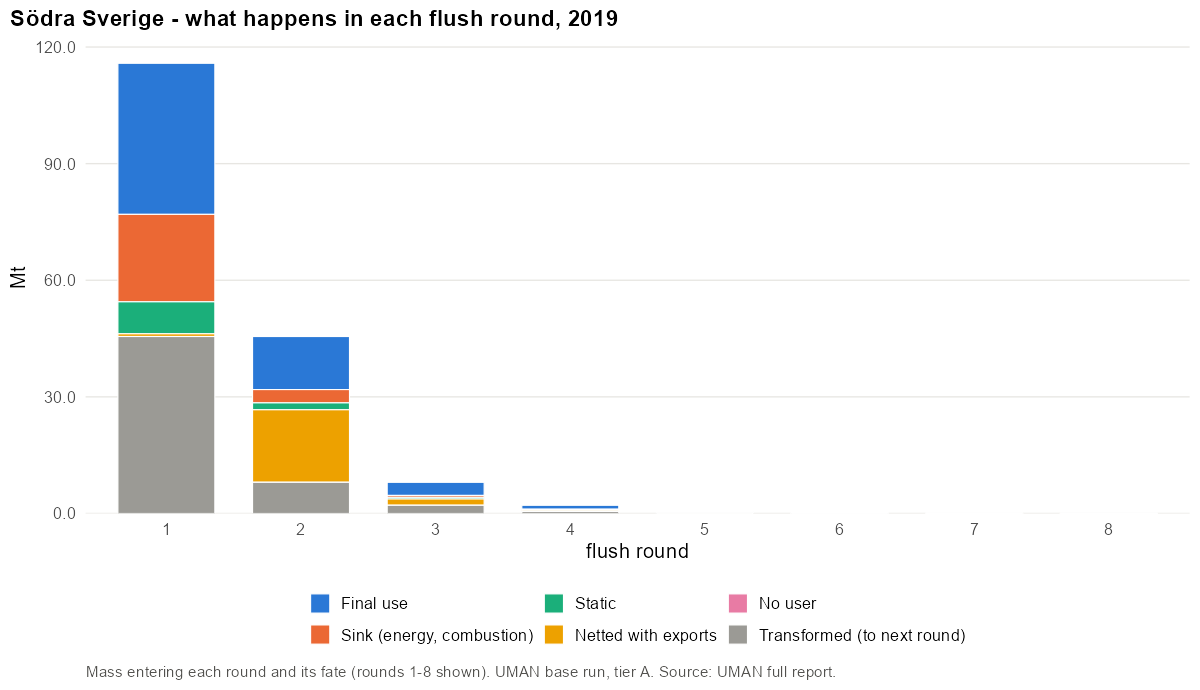
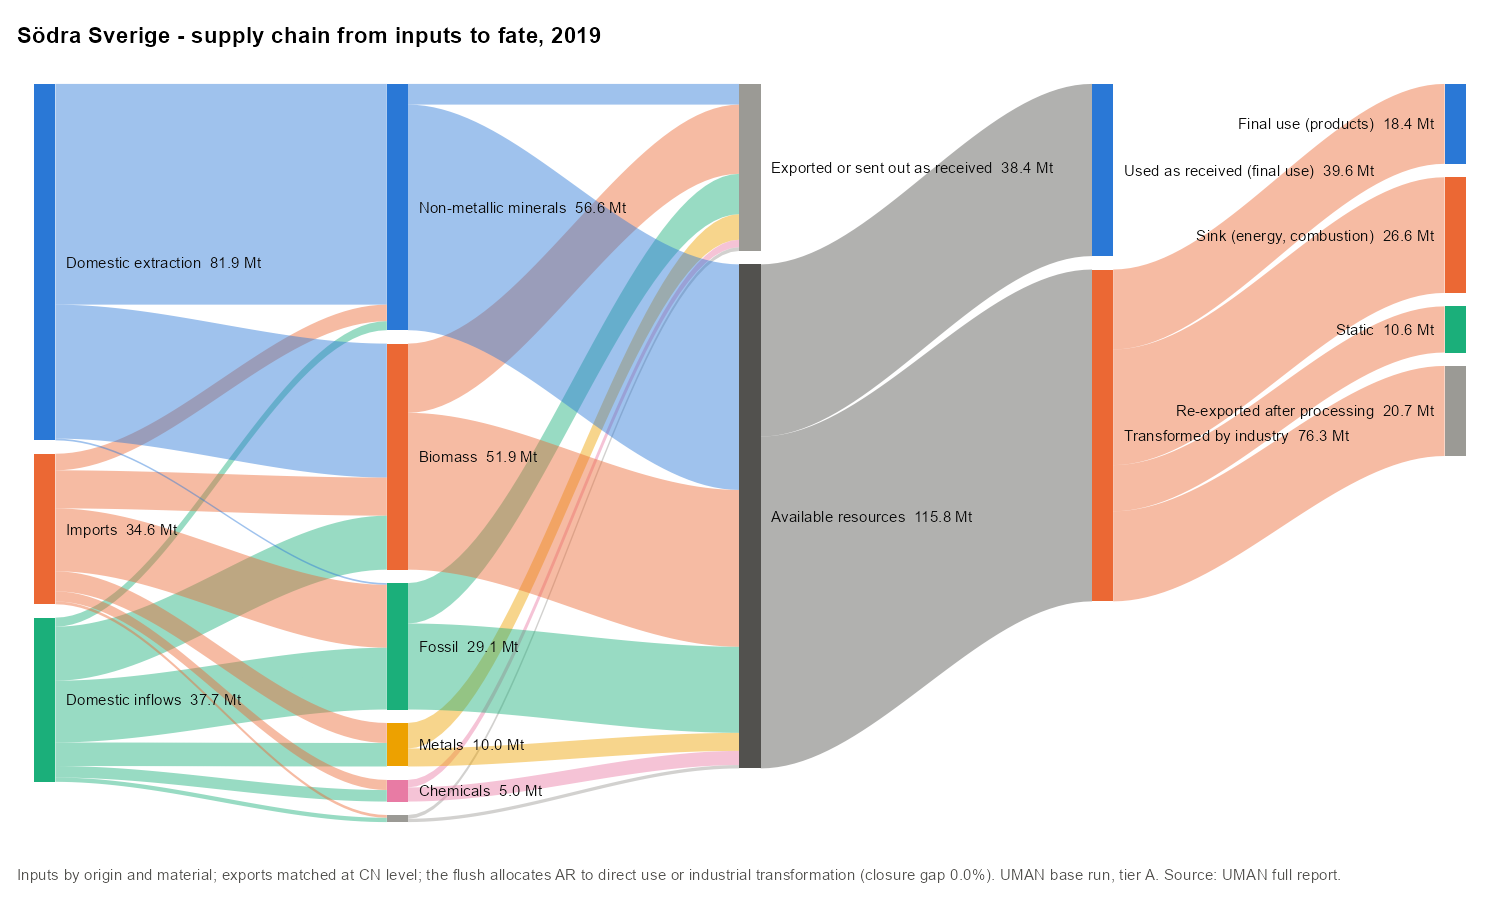
The flush needed 11 rounds. Round 1 handled 115.8 Mt; 39% of it was transformed into other products and re-entered round 2.
Domestic material consumption
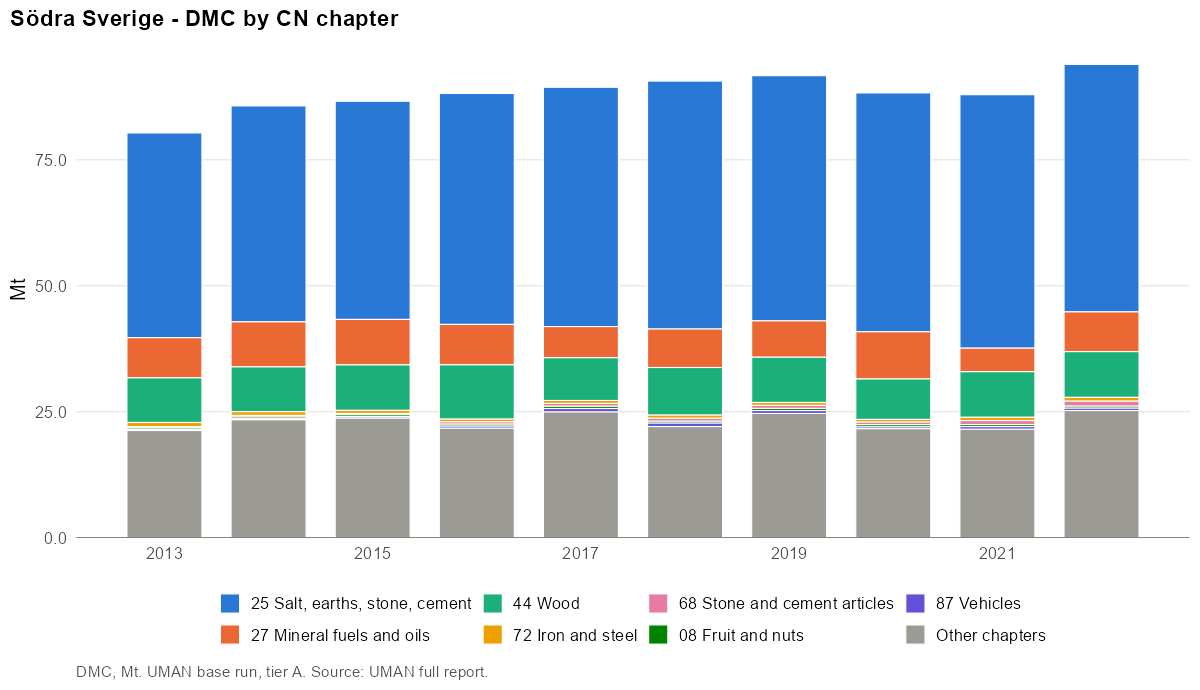
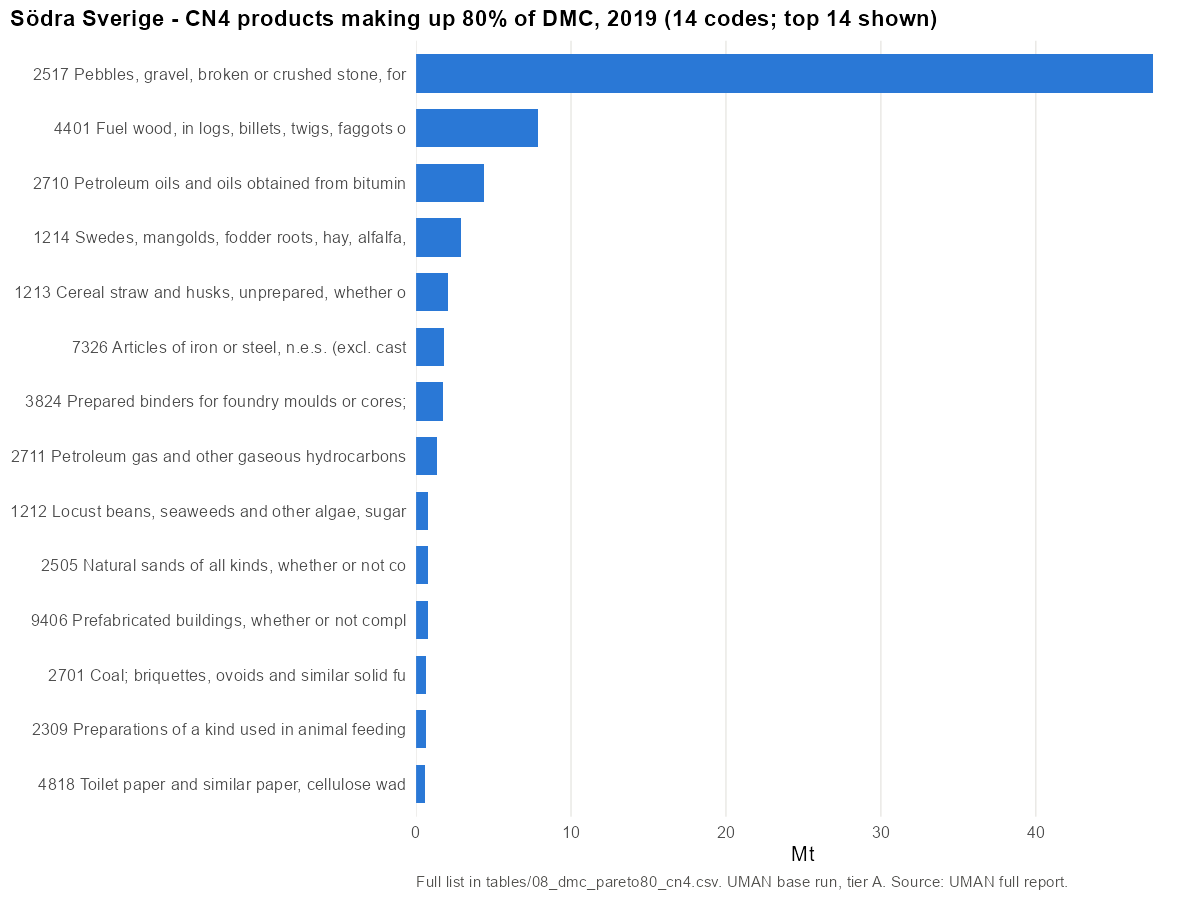
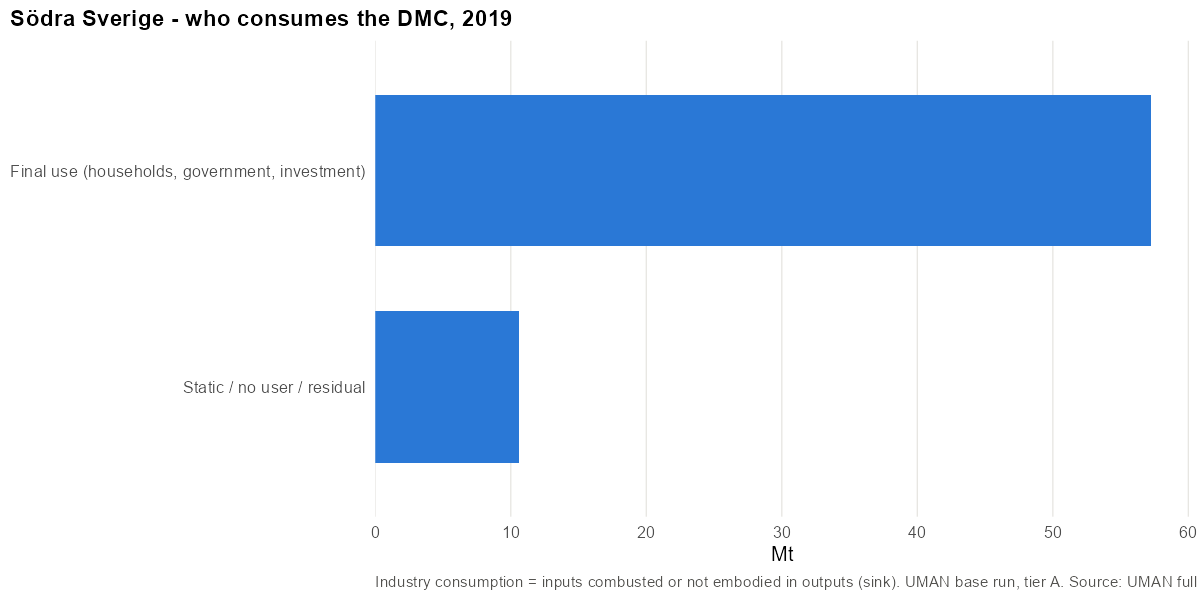
- Main CN4 codes (2019): 2517 Pebbles, gravel, broken or crushed stone, for concrete… (52%); 4401 Fuel wood, in logs, billets, twigs, faggots or similar… (9%); 2710 Petroleum oils and oils obtained from bituminous minerals… (5%); 1214 Swedes, mangolds, fodder roots, hay, alfalfa, clover… (3%); 1213 Cereal straw and husks, unprepared, whether or not chopped… (2%).
- Main materials: Stone (53%); Agriculture biomass (11%); Wood and wood fuels (11%).
14 CN4 codes make up 80% of DMC in 2019. Top 10:
| Rank | CN4 | Product | Mt | Share | Cumulative |
|---|---|---|---|---|---|
| 1 | 2517 | Pebbles, gravel, broken or crushed stone, for concrete… | 47.55 | 51.9% | 52% |
| 2 | 4401 | Fuel wood, in logs, billets, twigs, faggots or similar… | 7.88 | 8.6% | 60% |
| 3 | 2710 | Petroleum oils and oils obtained from bituminous minerals… | 4.37 | 4.8% | 65% |
| 4 | 1214 | Swedes, mangolds, fodder roots, hay, alfalfa, clover… | 2.90 | 3.2% | 68% |
| 5 | 1213 | Cereal straw and husks, unprepared, whether or not chopped… | 2.09 | 2.3% | 71% |
| 6 | 7326 | Articles of iron or steel, n.e.s. (excl. cast articles) | 1.80 | 2.0% | 73% |
| 7 | 3824 | Prepared binders for foundry moulds or cores; chemical… | 1.71 | 1.9% | 74% |
| 8 | 2711 | Petroleum gas and other gaseous hydrocarbons | 1.38 | 1.5% | 76% |
| 9 | 1212 | Locust beans, seaweeds and other algae, sugar beet and… | 0.77 | 0.8% | 77% |
| 10 | 2505 | Natural sands of all kinds, whether or not coloured (excl.… | 0.76 | 0.8% | 78% |
Metrics
| Year | DMC/cap | AR/cap | DE/cap | Import dep. | Intl import dep. | Self-suff. | Export int. |
|---|---|---|---|---|---|---|---|
| 2013 | 19.3 | 18.2 | 17.5 | 46% | 30% | 91% | 43% |
| 2014 | 20.3 | 19.3 | 18.0 | 45% | 31% | 88% | 41% |
| 2015 | 20.3 | 19.3 | 17.7 | 47% | 32% | 87% | 43% |
| 2016 | 20.4 | 19.0 | 18.2 | 48% | 32% | 89% | 45% |
| 2017 | 20.4 | 19.0 | 18.3 | 48% | 33% | 90% | 46% |
| 2018 | 20.5 | 19.1 | 17.7 | 50% | 34% | 86% | 46% |
| 2019 | 20.5 | 19.3 | 18.3 | 47% | 30% | 89% | 44% |
| 2020 | 19.6 | 18.4 | 17.4 | 48% | 29% | 88% | 45% |
| 2021 | 19.4 | 18.1 | 18.1 | 48% | 30% | 93% | 48% |
| 2022 | 20.6 | 19.4 | 17.9 | 49% | 30% | 87% | 44% |
Västsverige (SE23)
Sweden · NUTS 2 · code SE23 · tier A · years 2013–2022
Findings
- DMC is 43.5 Mt or 21.1 t/cap in 2019, with a wide range over time (17.6–22.6 t/cap). It is close to the national level.
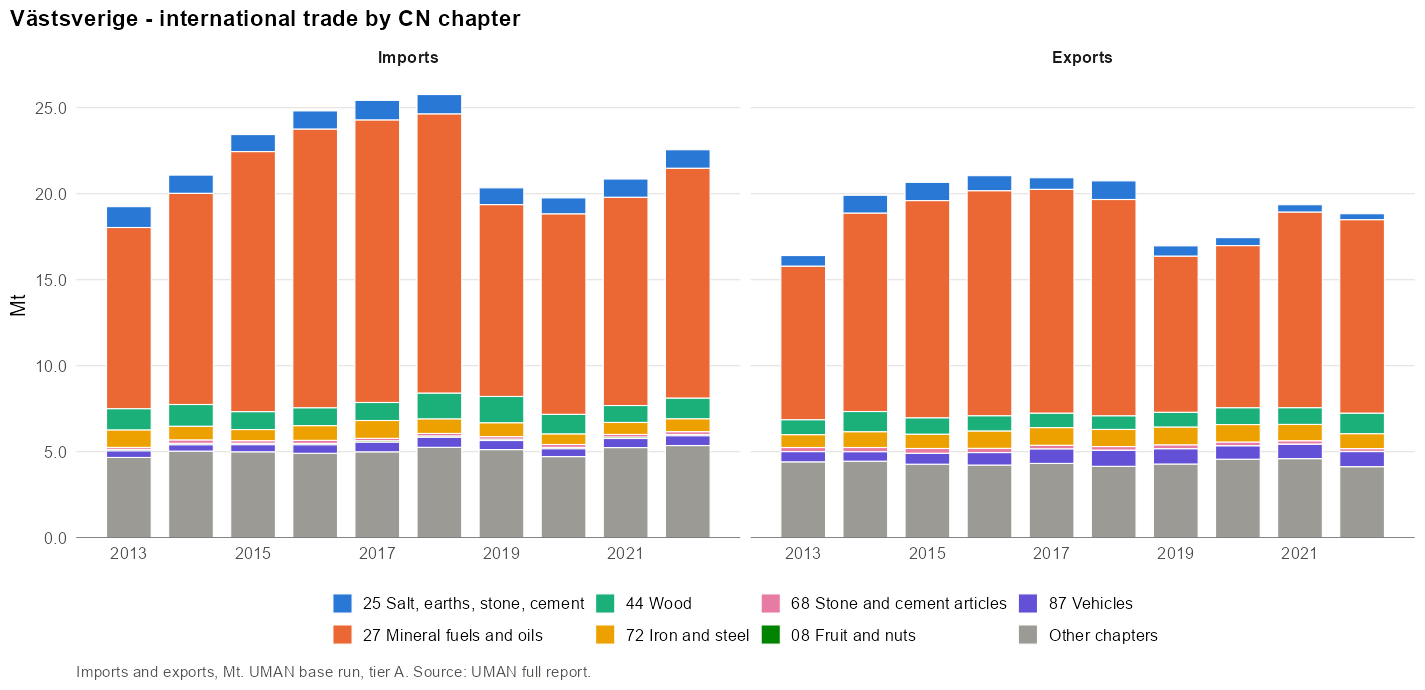
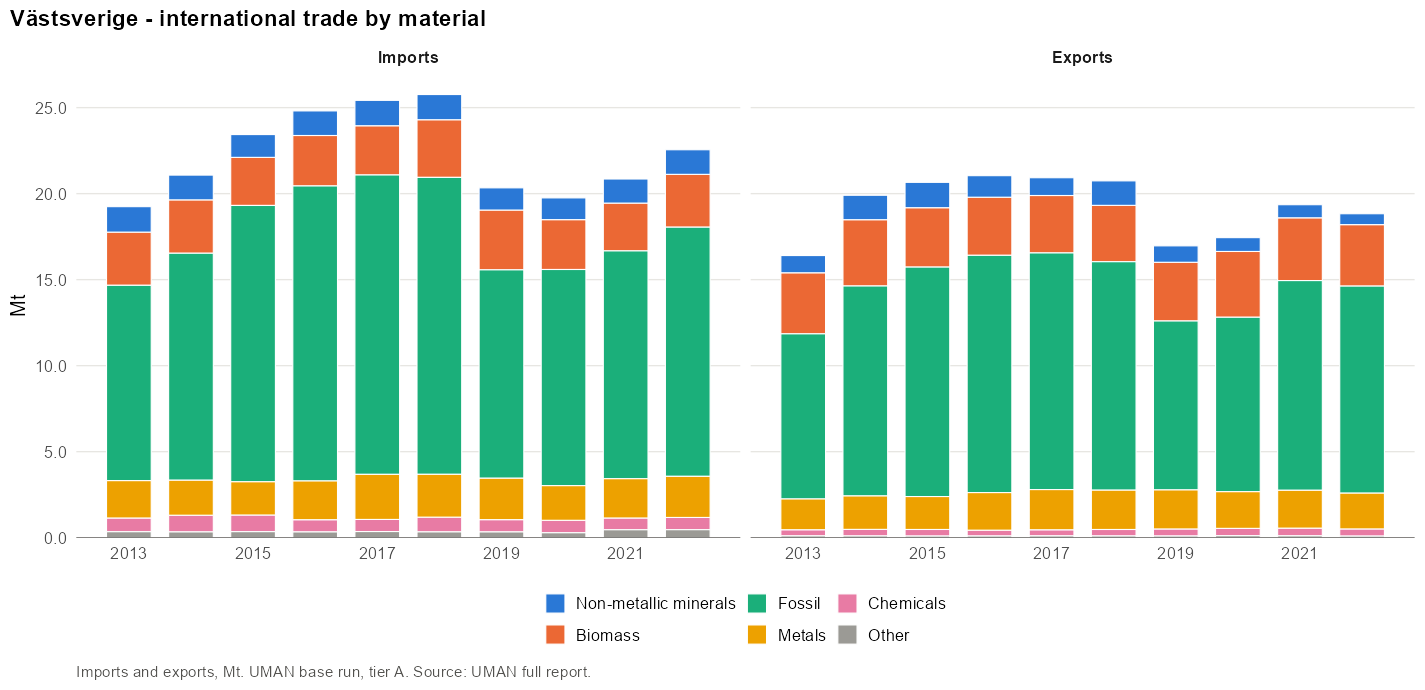
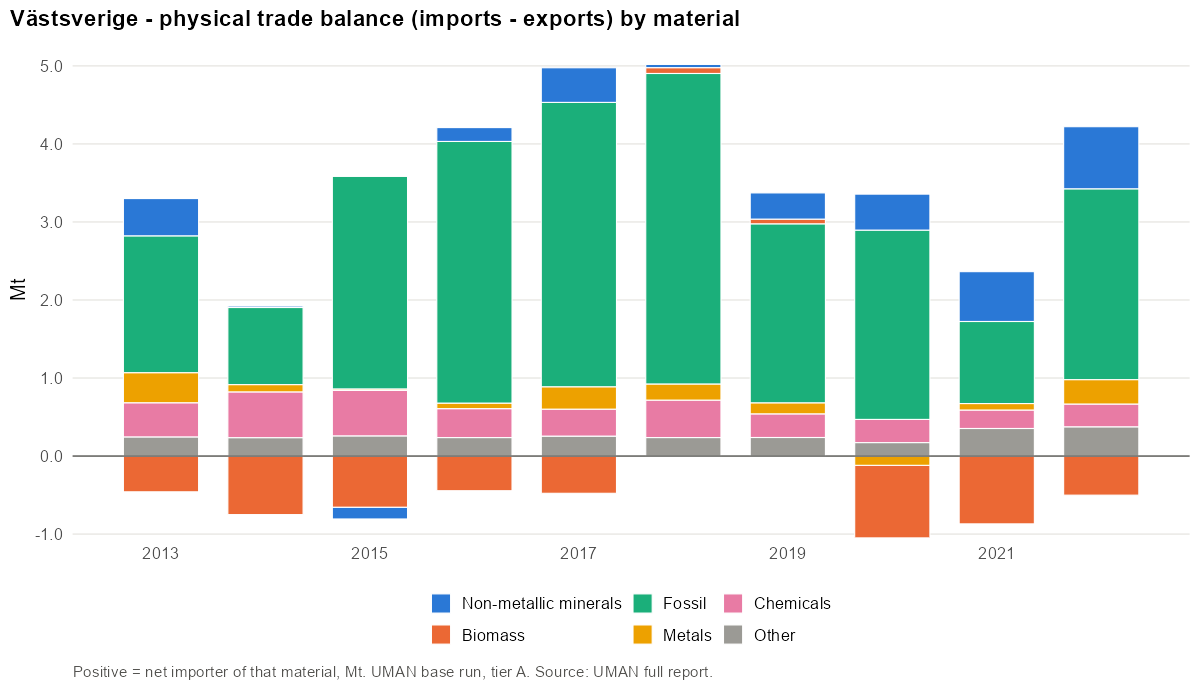
- West Sweden is a refining hub: crude oil is 44% of imports and refined products 51% of exports. Fossil materials are 15% of DMC, twice the national share (7%).
- The region is very open: domestic flows (31.1 Mt in, 28.8 Mt out) are almost as large as extraction (35.0 Mt). Import dependency is 60%, of which international 37%.
- DE is 17.0 t/cap, 65% crushed stone and 16% roundwood. DMC is 56% non-metallic minerals and 21% biomass; 10 CN4 codes make up 80% of DMC.
- Transformation: 46% of the mass entering round 1 is transformed, and 14.3 Mt is re-exported after processing (mainly refined products). The unbalanced share is 4.7%.
Overview
| 2013 | 2019 | 2022 | |
|---|---|---|---|
| Population | 1 921 924 | 2 059 729 | 2 101 461 |
| DE (Mt) | 30.0 | 35.0 | 34.2 |
| Imports M (Mt) | 19.2 | 20.3 | 22.6 |
| Exports X (Mt) | 16.4 | 17.0 | 18.8 |
| Domestic in NI (Mt) | 25.7 | 31.1 | 32.1 |
| Domestic out NO (Mt) | 24.6 | 28.8 | 29.7 |
| AR (Mt) | 33.9 | 40.7 | 40.3 |
| DMC (Mt) | 36.6 | 43.5 | 43.5 |
| DMC (t/cap) | 19.0 | 21.1 | 20.7 |
| Unbalanced (% of gross AR) | 5.1% | 4.7% | 5.3% |
Domestic extraction
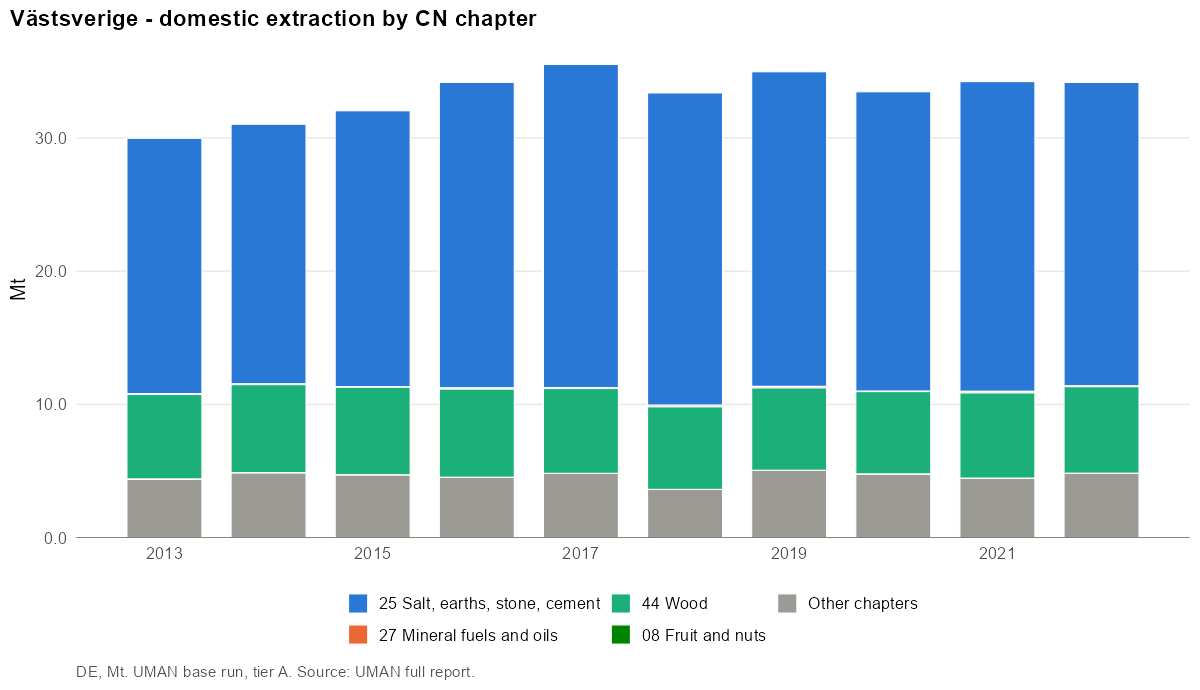
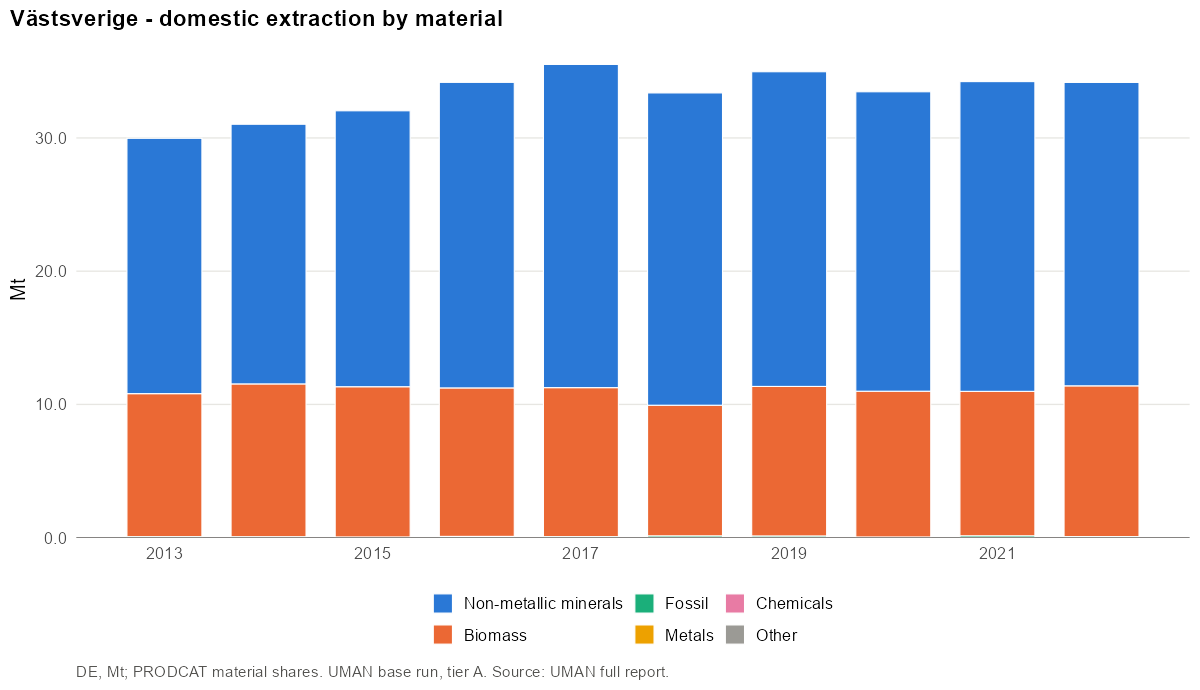
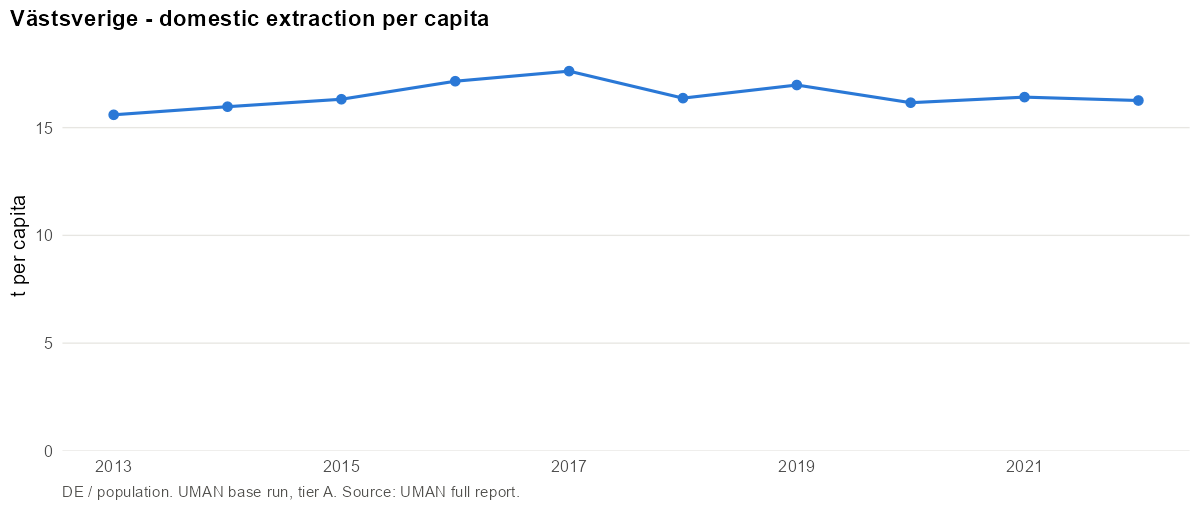
- Main CN4 codes (2019): 2517 Pebbles, gravel, broken or crushed stone, for concrete… (65%); 4403 Wood in the rough, whether or not stripped of bark or… (16%); 1214 Swedes, mangolds, fodder roots, hay, alfalfa, clover… (4%); 1213 Cereal straw and husks, unprepared, whether or not chopped… (2%); 2505 Natural sands of all kinds, whether or not coloured (excl.… (2%).
- Main materials: Stone (65%); Wood and wood fuels (18%); Agriculture biomass (12%).
International trade
Imports:
- Main CN4 codes (2019): 2709 Petroleum oils and oils obtained from bituminous minerals… (44%); 2710 Petroleum oils and oils obtained from bituminous minerals… (8%); 4403 Wood in the rough, whether or not stripped of bark or… (5%); 8708 Parts and accessories for tractors, motor vehicles for the… (2%); 2711 Petroleum gas and other gaseous hydrocarbons (2%).
- Main materials: Fuels (20%); Plastics and rubbers (15%); Lubricants, oils and solvents (13%).
Exports:
- Main CN4 codes (2019): 2710 Petroleum oils and oils obtained from bituminous minerals… (51%); 7204 Ferrous waste and scrap; remelting scrap ingots of iron or… (5%); 4407 Wood sawn or chipped lengthwise, sliced or peeled, whether… (4%); 4703 Chemical wood pulp, soda or sulphate (excl. dissolving… (3%); 8703 Motor cars and other motor vehicles principally designed… (3%).
- Main materials: Fuels (49%); Iron, steel and ferro-alloys (12%); Wood and wood fuels (8%).
Domestic movement of goods
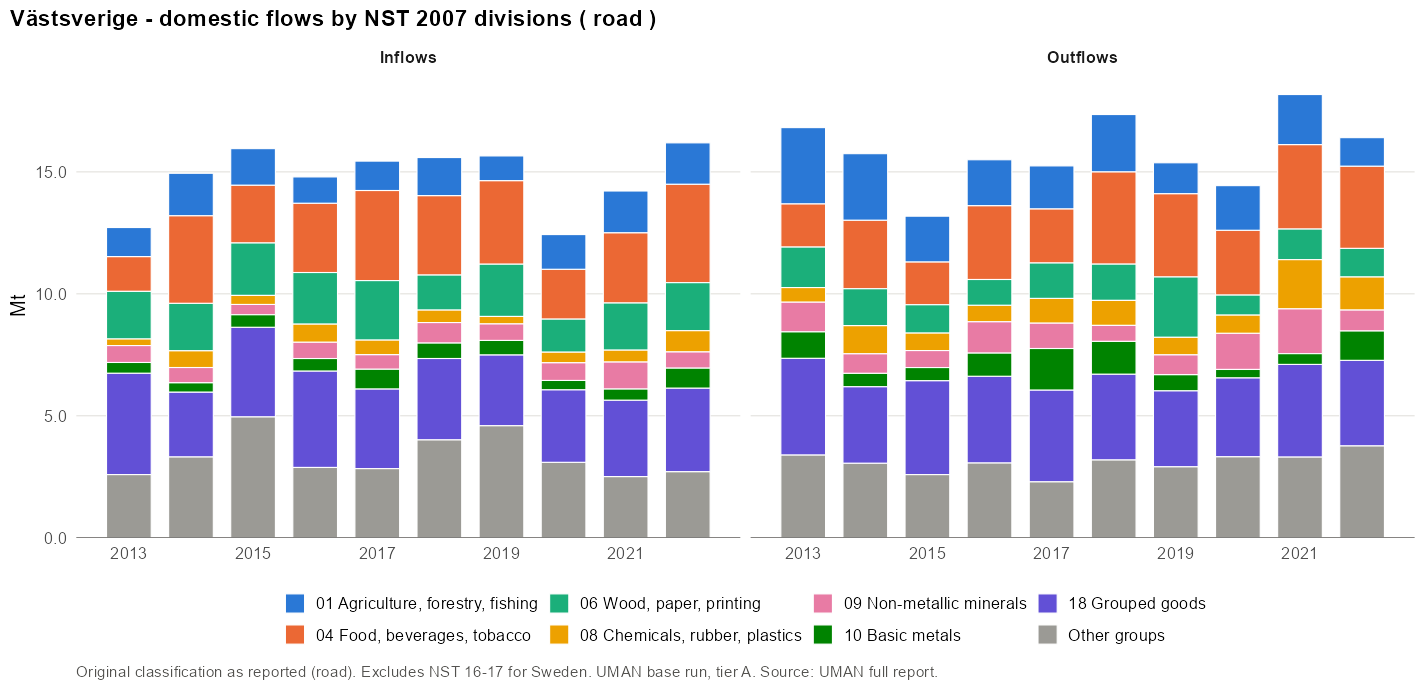
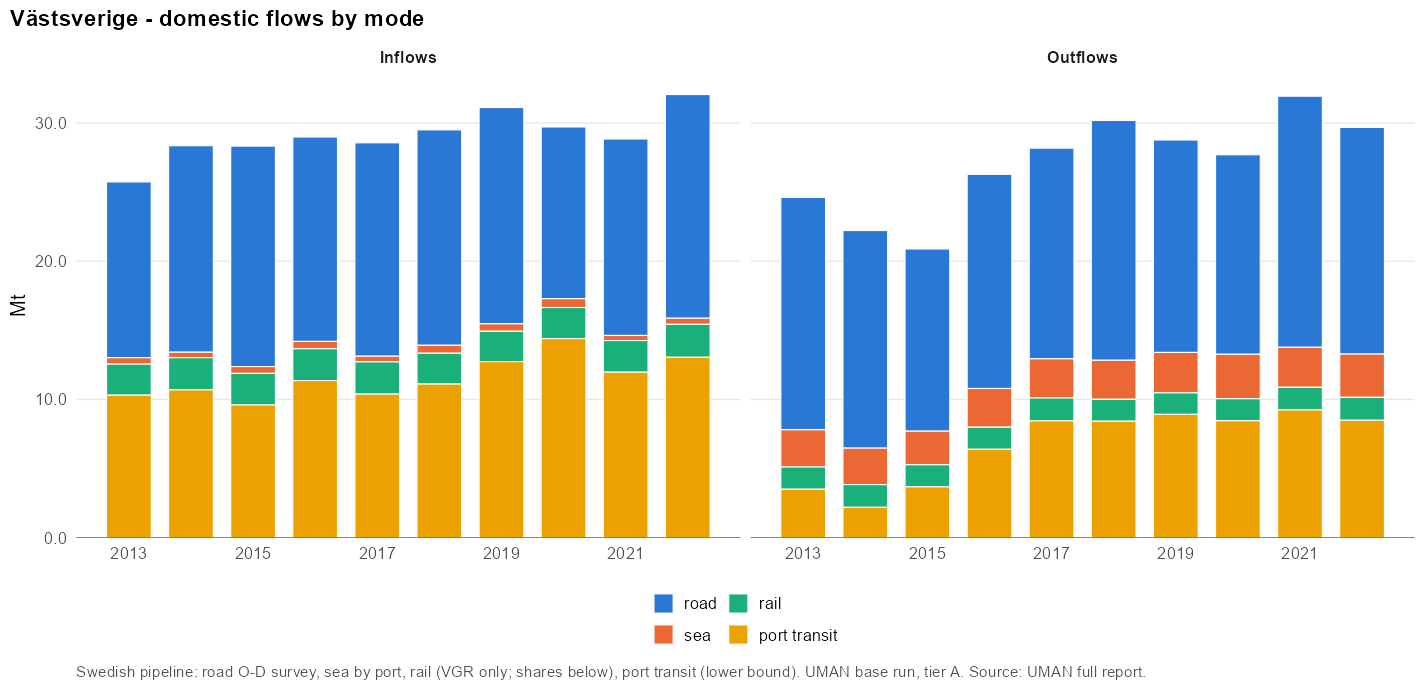
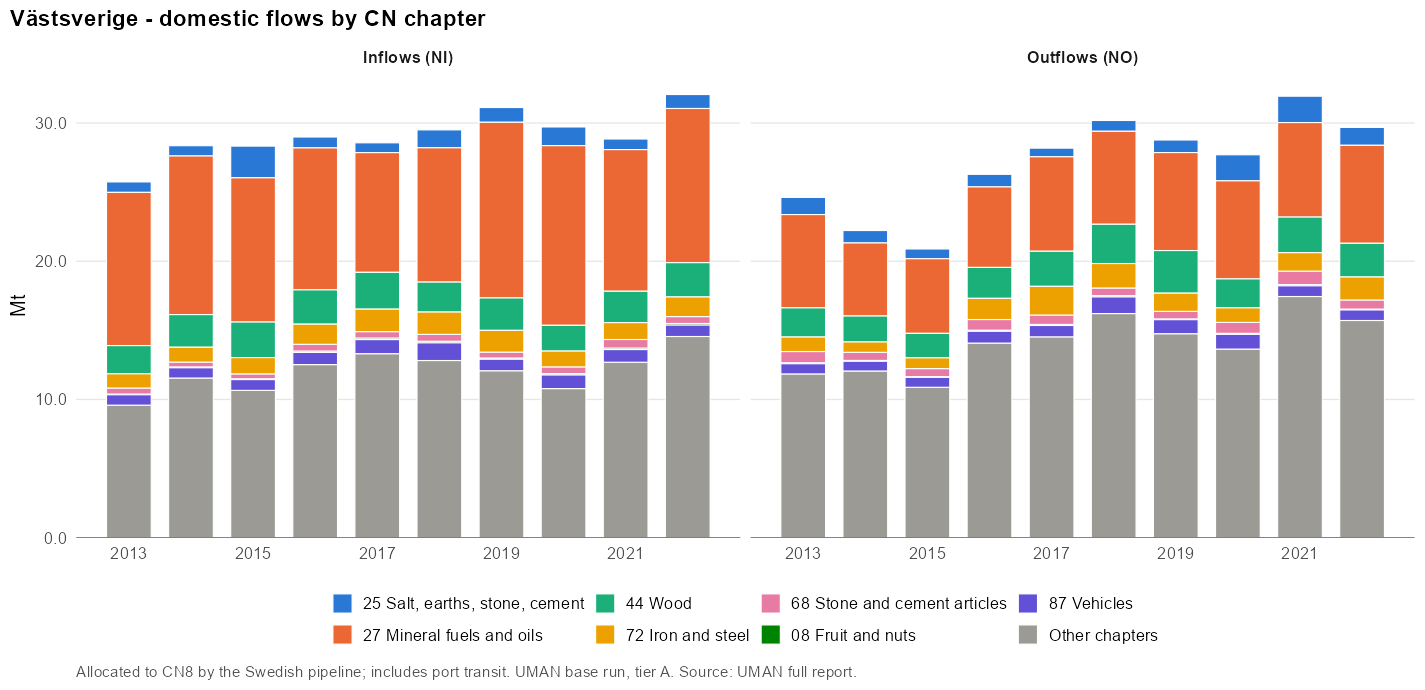
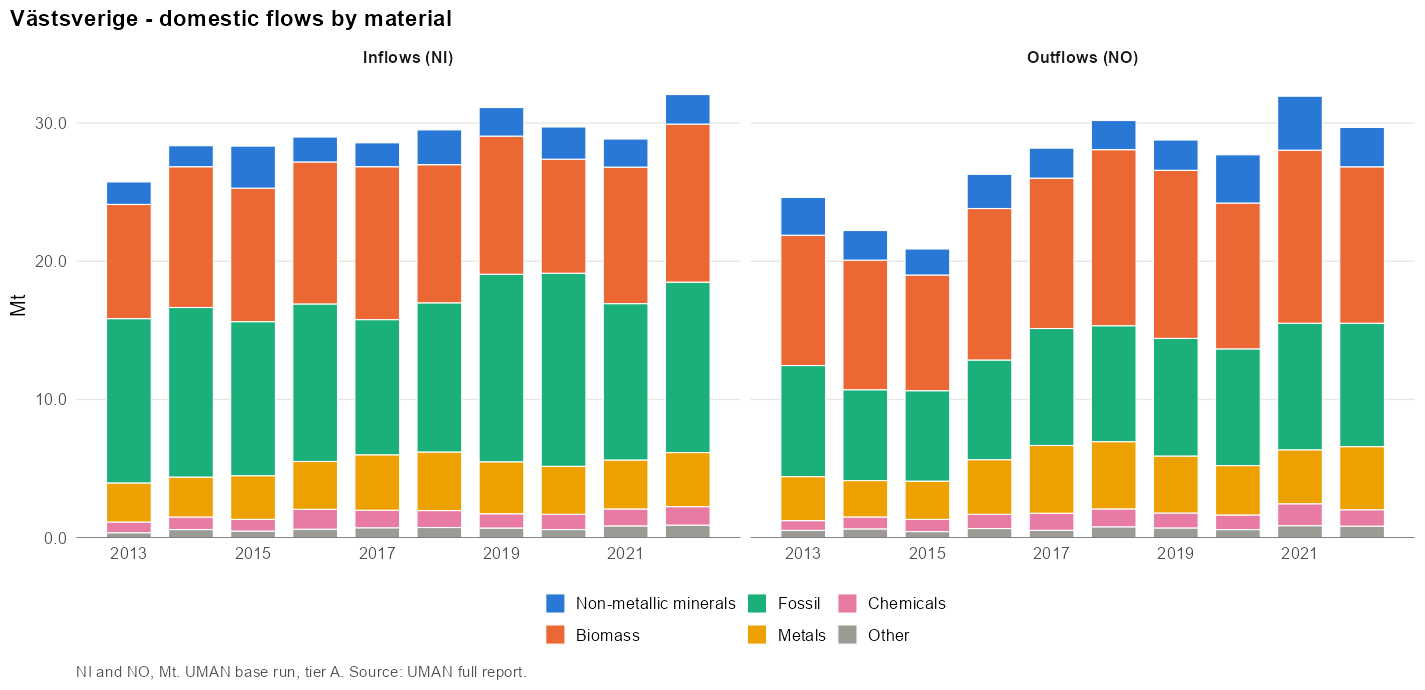
Inflows:
- Main CN4 codes (2019): 2709 Petroleum oils and oils obtained from bituminous minerals… (18%); 2710 Petroleum oils and oils obtained from bituminous minerals… (16%); 4403 Wood in the rough, whether or not stripped of bark or… (3%); 2711 Petroleum gas and other gaseous hydrocarbons (3%); 2701 Coal; briquettes, ovoids and similar solid fuels… (2%).
- Main materials: Fuels (23%); Agriculture biomass (11%); Iron, steel and ferro-alloys (10%).
Outflows:
- Main CN4 codes (2019): 2710 Petroleum oils and oils obtained from bituminous minerals… (21%); 4407 Wood sawn or chipped lengthwise, sliced or peeled, whether… (4%); 4403 Wood in the rough, whether or not stripped of bark or… (4%); 4703 Chemical wood pulp, soda or sulphate (excl. dissolving… (3%); 2309 Preparations of a kind used in animal feeding (3%).
- Main materials: Fuels (21%); Wood and wood fuels (14%); Agriculture biomass (13%).
Available resources
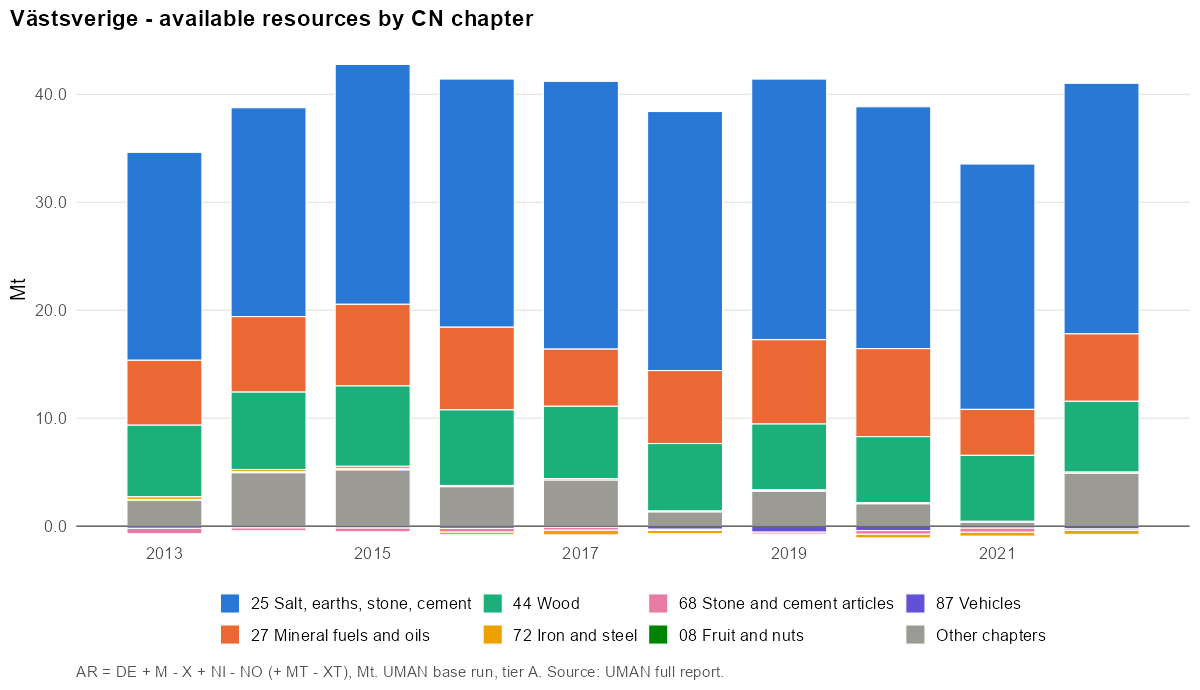
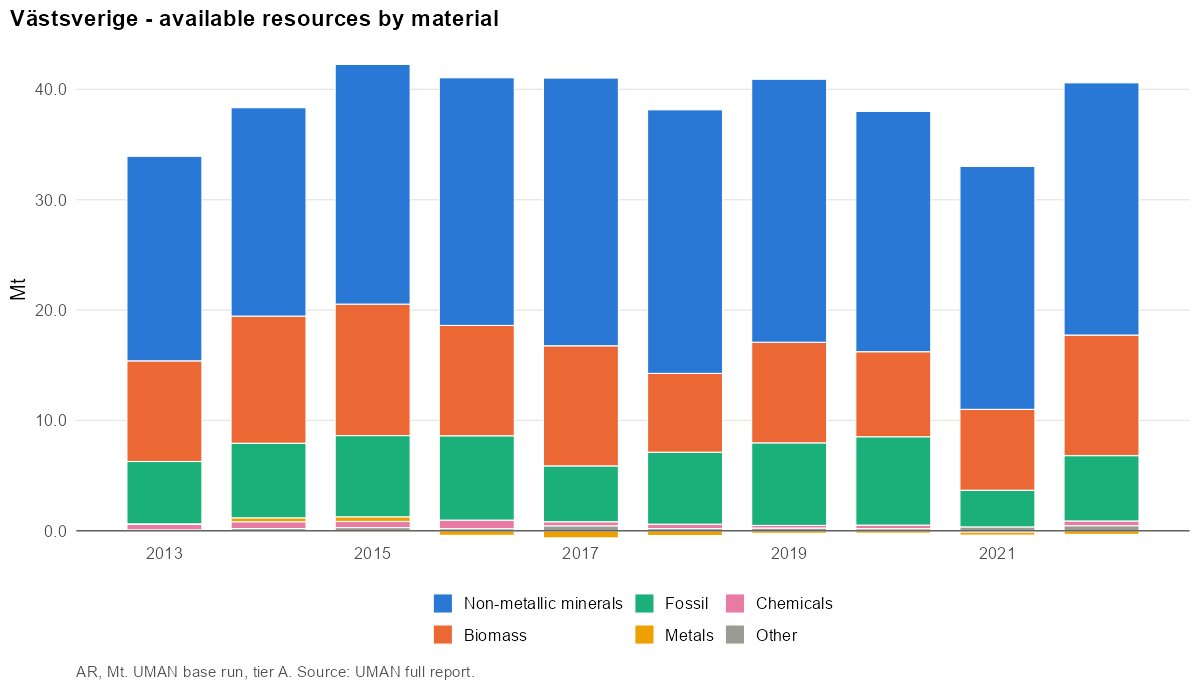
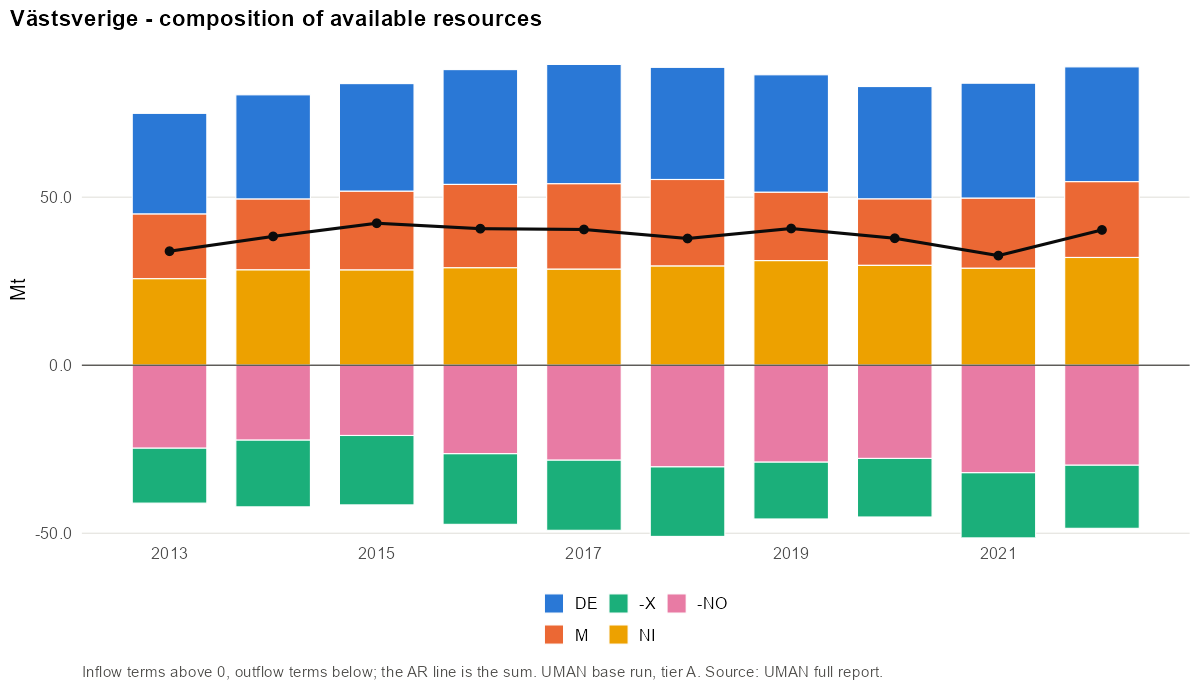
- Main CN4 codes (2019): 2517 Pebbles, gravel, broken or crushed stone, for concrete… (56%); 2709 Petroleum oils and oils obtained from bituminous minerals… (35%); 4403 Wood in the rough, whether or not stripped of bark or… (15%); 1214 Swedes, mangolds, fodder roots, hay, alfalfa, clover… (3%); 4401 Fuel wood, in logs, billets, twigs, faggots or similar… (2%).
- Main materials: Stone (56%); Wood and wood fuels (13%); Agriculture biomass (10%).
Industrial production
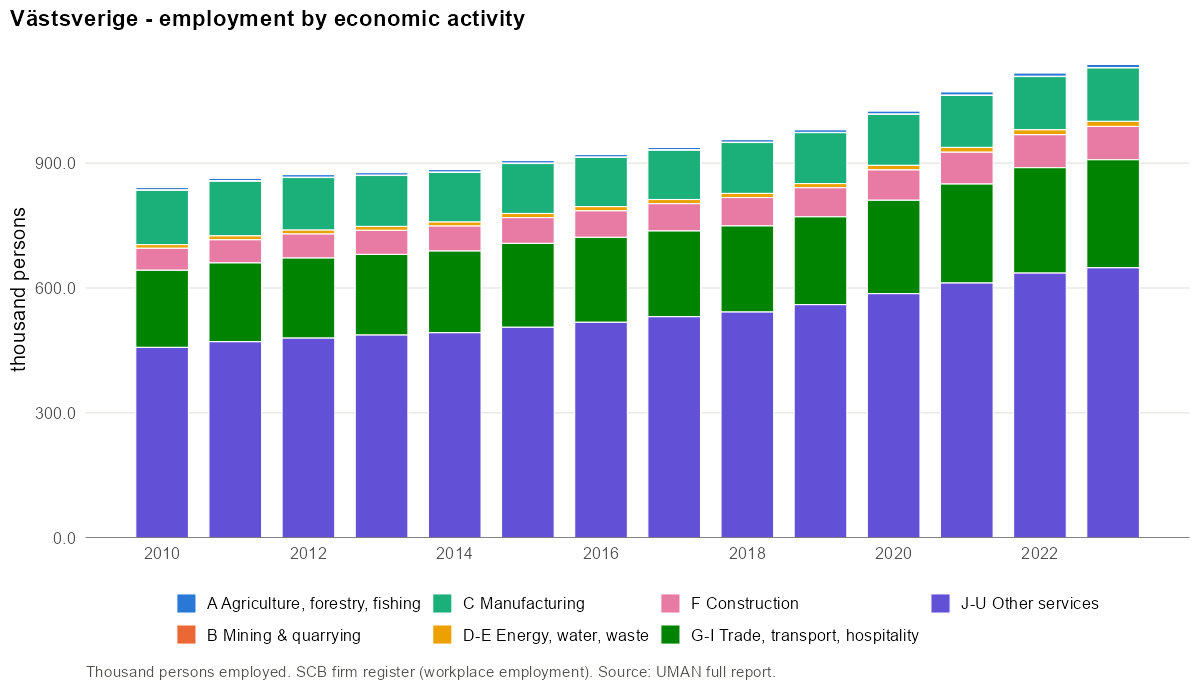
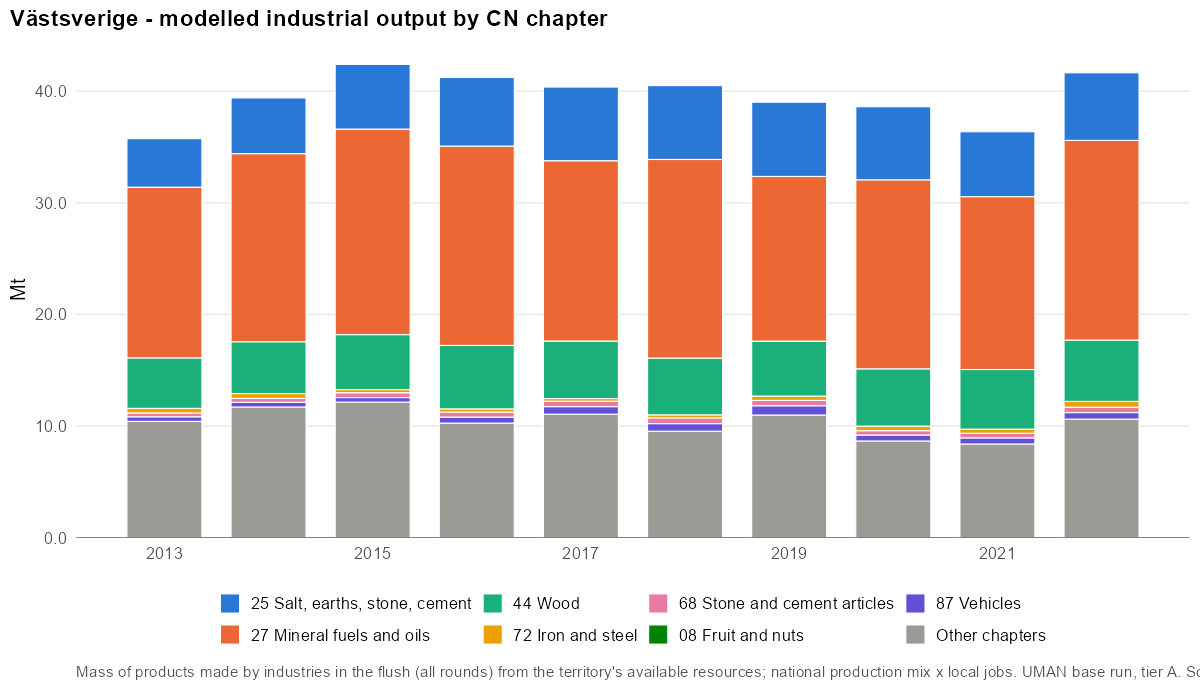
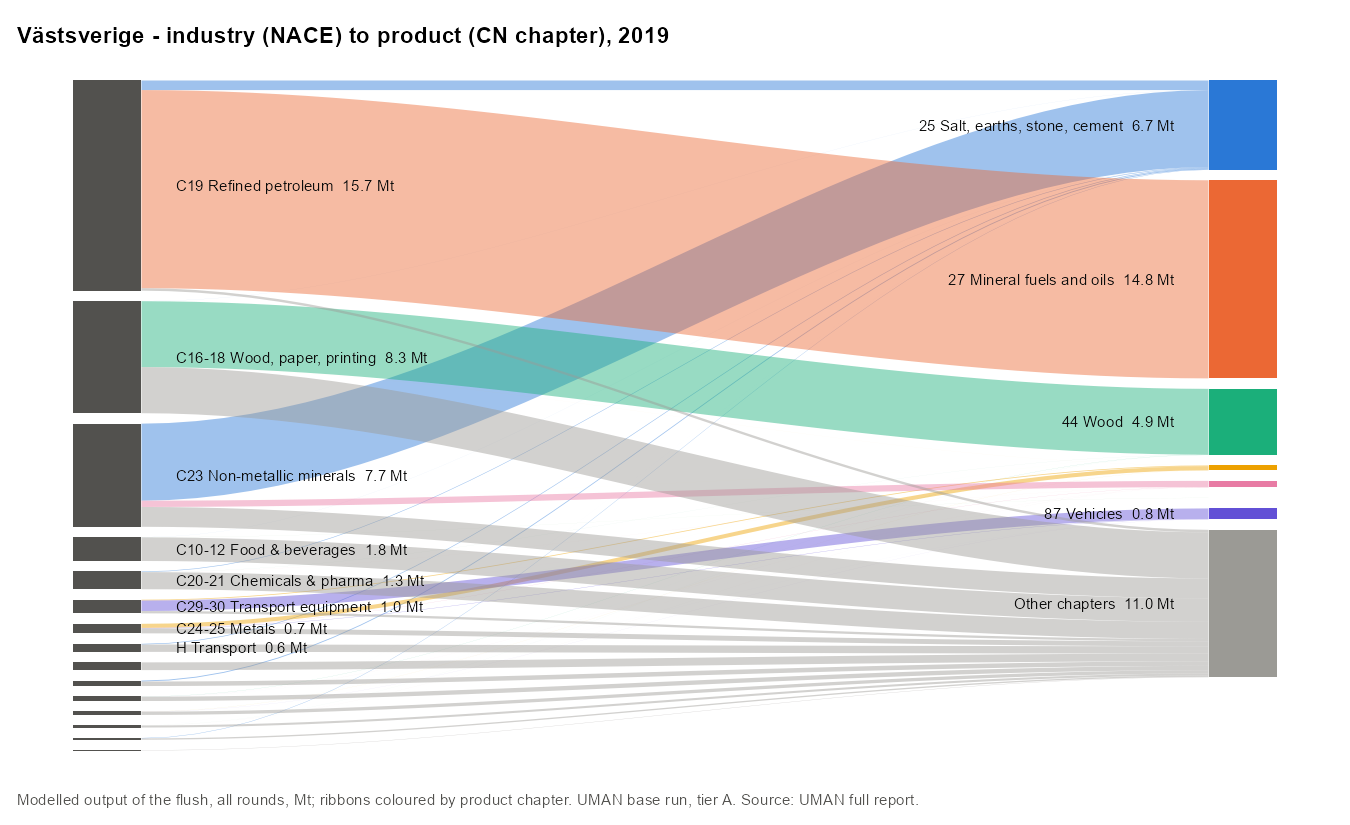
Largest employers (NACE divisions):
| NACE | Activity | Persons | Share |
|---|---|---|---|
| 85 | Education | 101 408 | 10.3% |
| 86 | Human health activities | 63 641 | 6.5% |
| 47 | Retail trade, except of motor vehicles and motorcycles | 60 186 | 6.1% |
| 88 | Social work activities without accommodation | 56 846 | 5.8% |
| 84 | Public administration and defence; compulsory social security | 54 411 | 5.6% |
| 87 | Residential care activities | 48 014 | 4.9% |
| 46 | Wholesale trade, except of motor vehicles and motorcycles | 46 776 | 4.8% |
| 43 | Specialised construction activities | 45 323 | 4.6% |
Product transformation
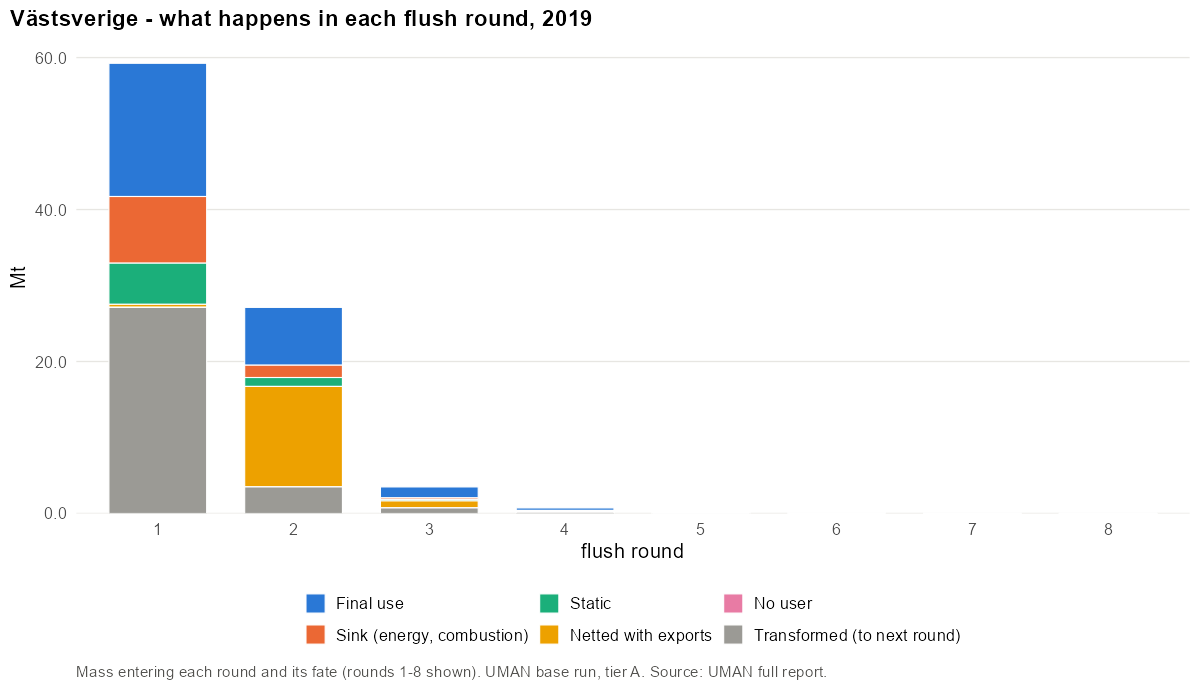
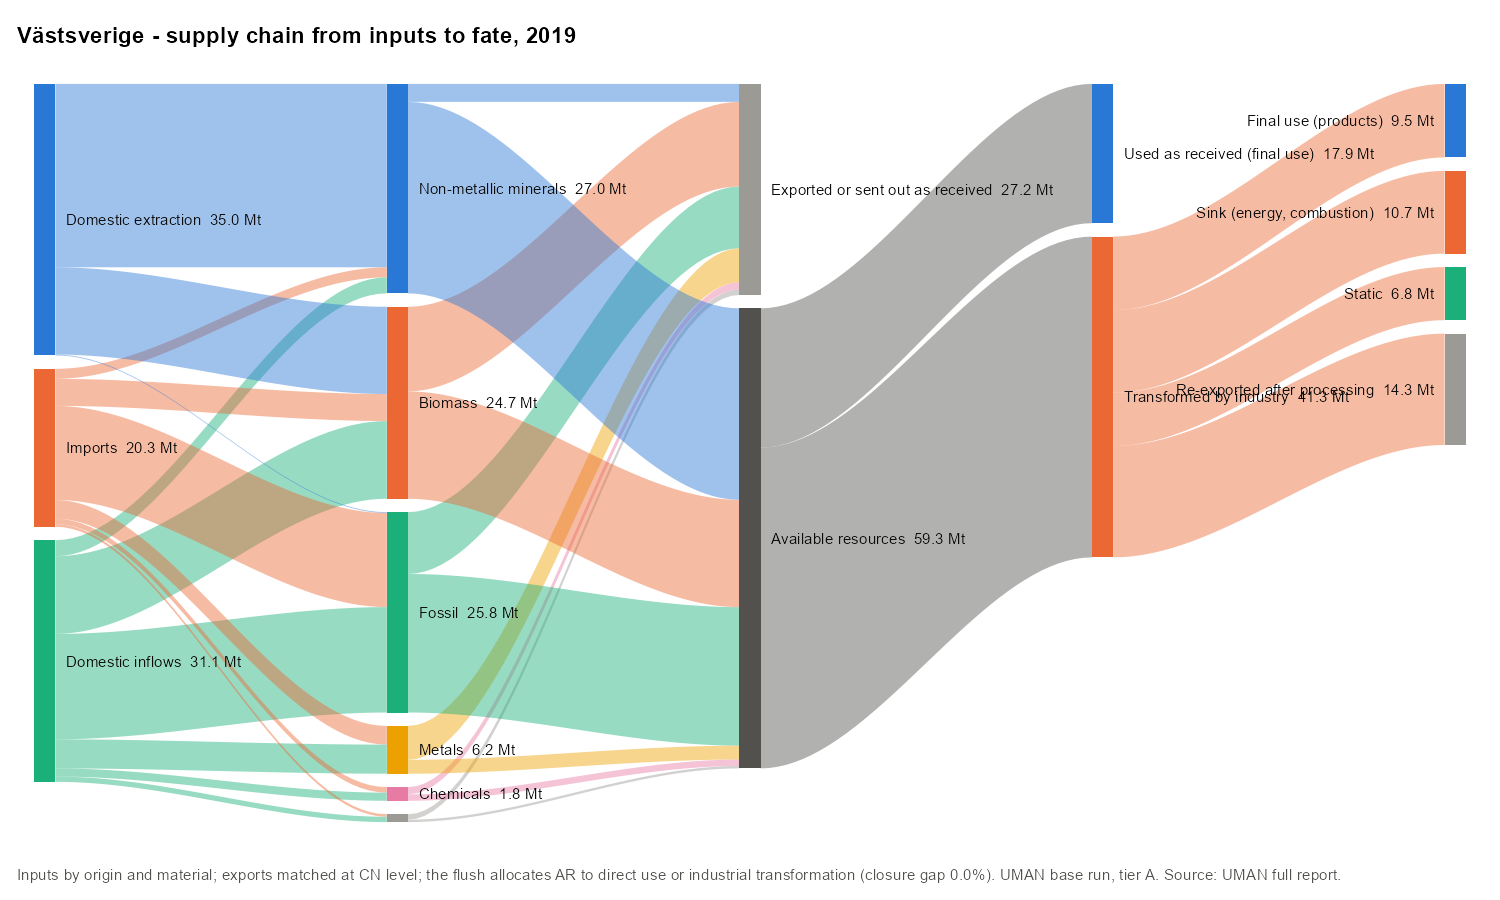
The flush needed 10 rounds. Round 1 handled 59.3 Mt; 46% of it was transformed into other products and re-entered round 2.
Domestic material consumption
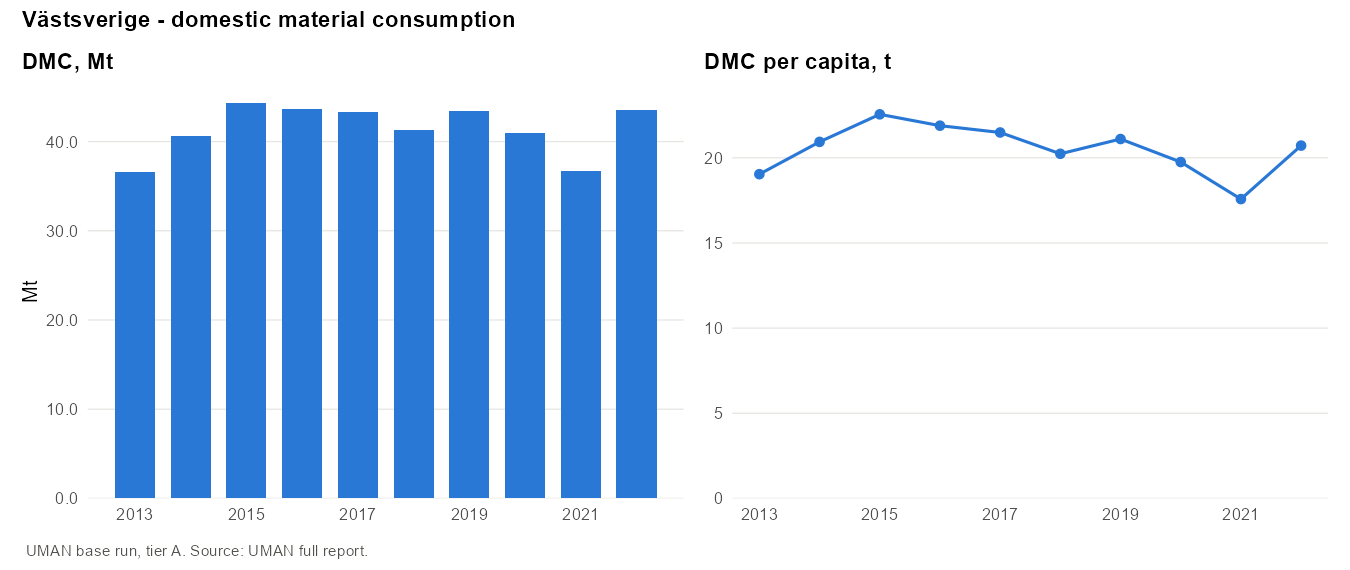
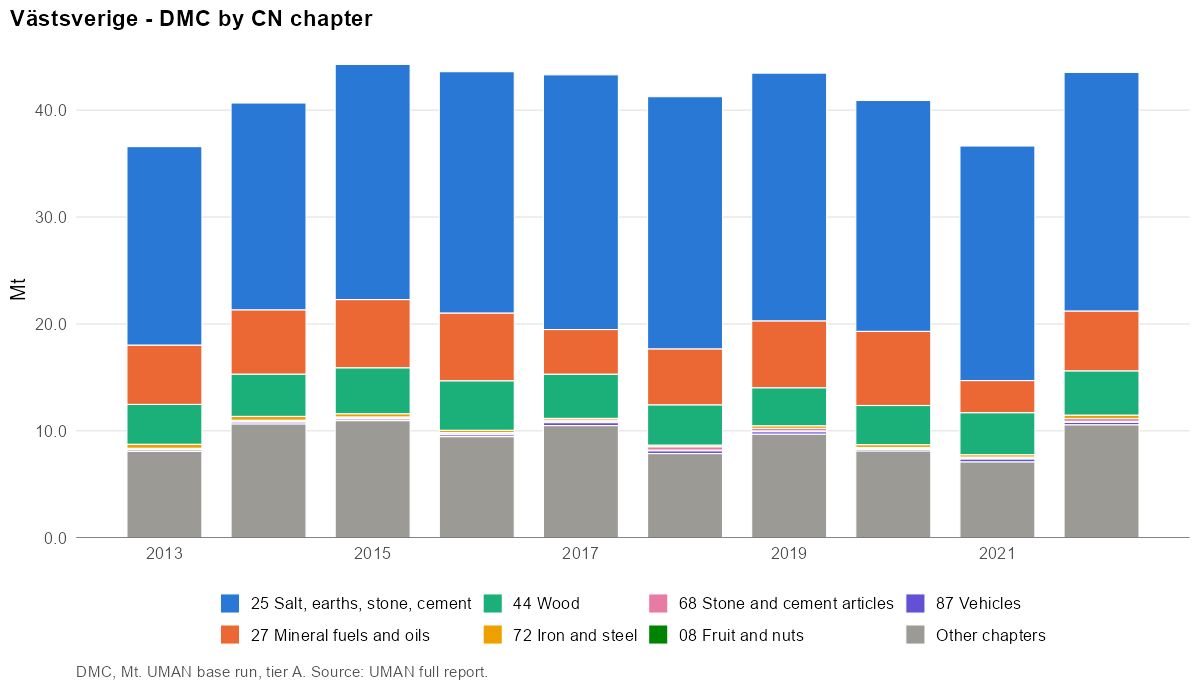
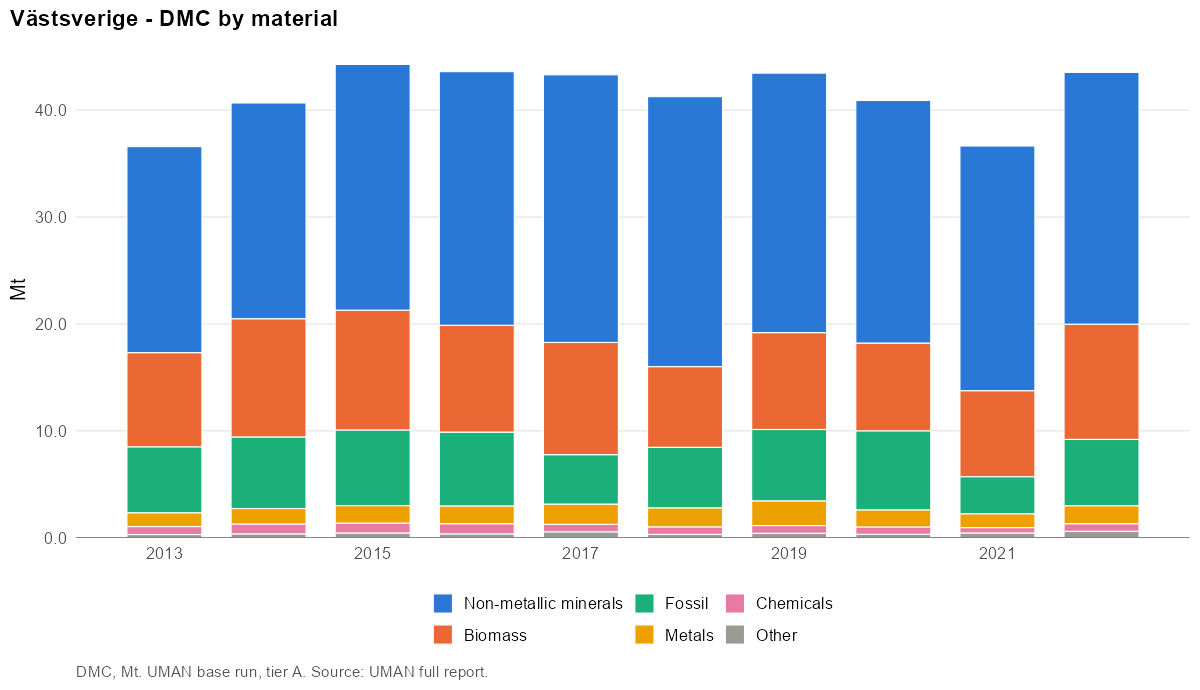
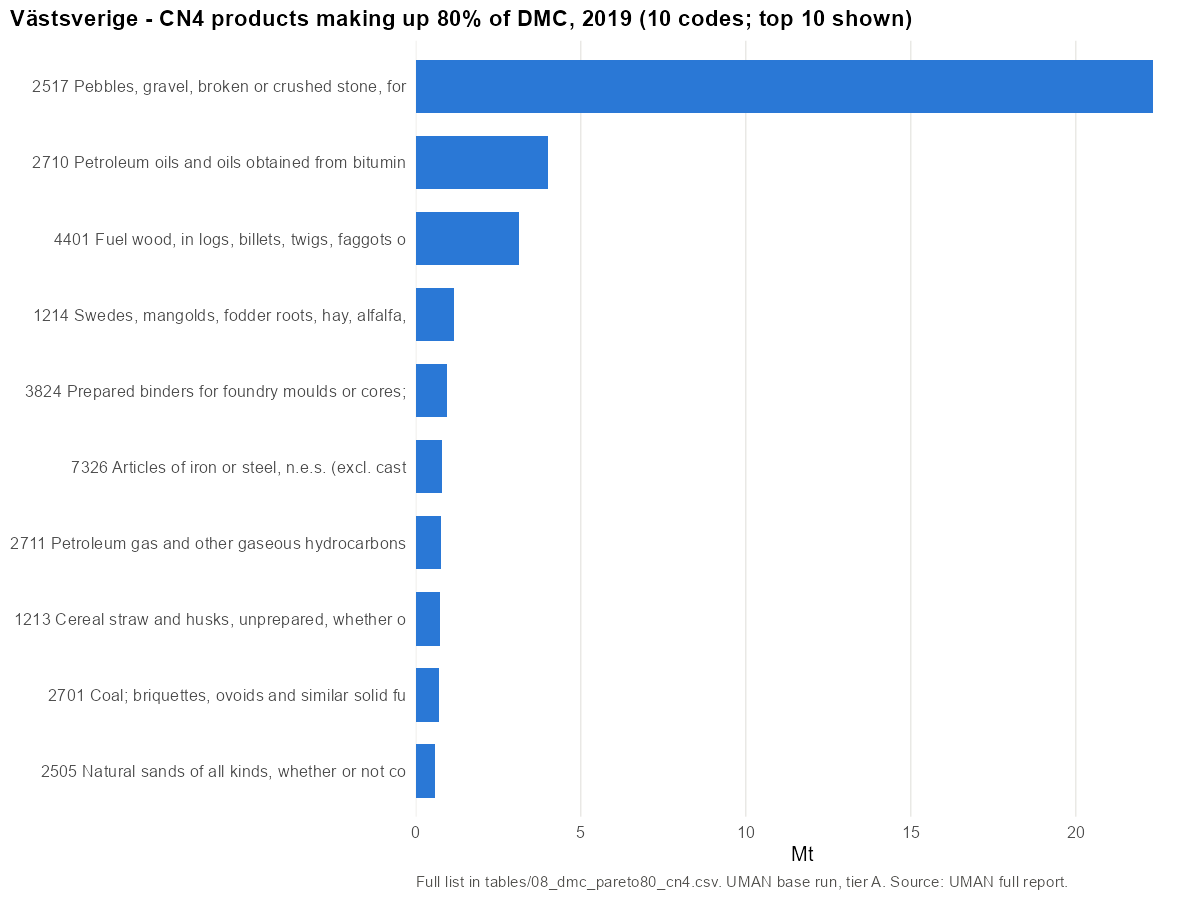
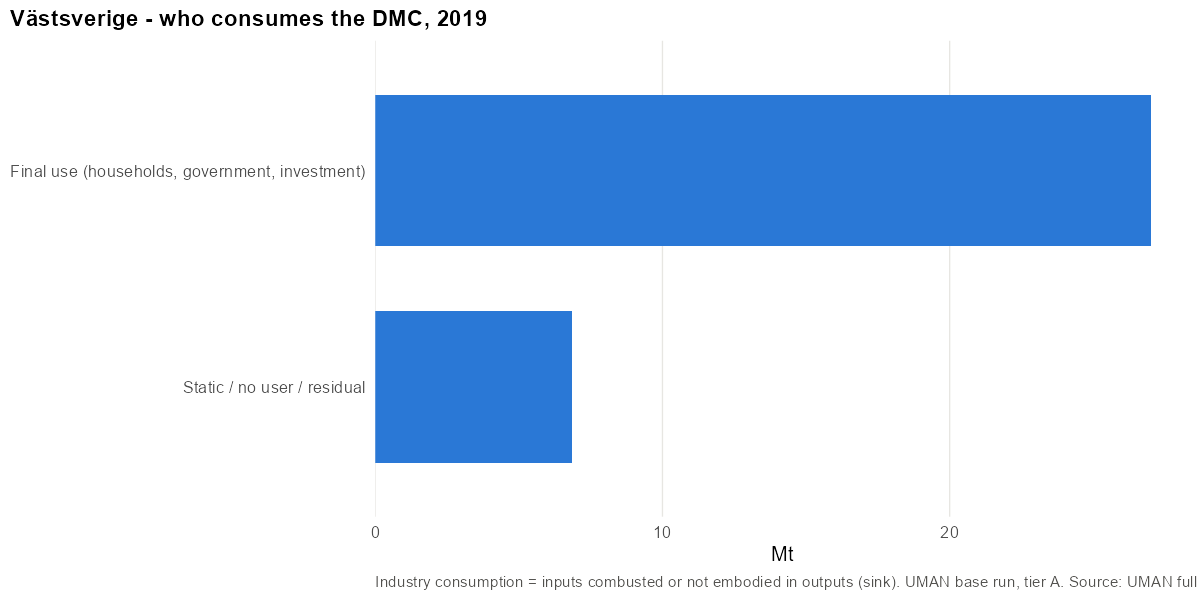
- Main CN4 codes (2019): 2517 Pebbles, gravel, broken or crushed stone, for concrete… (51%); 2710 Petroleum oils and oils obtained from bituminous minerals… (9%); 4401 Fuel wood, in logs, billets, twigs, faggots or similar… (7%); 1214 Swedes, mangolds, fodder roots, hay, alfalfa, clover… (3%); 3824 Prepared binders for foundry moulds or cores; chemical… (2%).
- Main materials: Stone (52%); Fuels (11%); Wood and wood fuels (9%).
10 CN4 codes make up 80% of DMC in 2019. Top 10:
| Rank | CN4 | Product | Mt | Share | Cumulative |
|---|---|---|---|---|---|
| 1 | 2517 | Pebbles, gravel, broken or crushed stone, for concrete… | 22.33 | 51.4% | 51% |
| 2 | 2710 | Petroleum oils and oils obtained from bituminous minerals… | 4.01 | 9.2% | 61% |
| 3 | 4401 | Fuel wood, in logs, billets, twigs, faggots or similar… | 3.12 | 7.2% | 68% |
| 4 | 1214 | Swedes, mangolds, fodder roots, hay, alfalfa, clover… | 1.15 | 2.6% | 70% |
| 5 | 3824 | Prepared binders for foundry moulds or cores; chemical… | 0.96 | 2.2% | 73% |
| 6 | 7326 | Articles of iron or steel, n.e.s. (excl. cast articles) | 0.79 | 1.8% | 74% |
| 7 | 2711 | Petroleum gas and other gaseous hydrocarbons | 0.78 | 1.8% | 76% |
| 8 | 1213 | Cereal straw and husks, unprepared, whether or not chopped… | 0.72 | 1.7% | 78% |
| 9 | 2701 | Coal; briquettes, ovoids and similar solid fuels… | 0.70 | 1.6% | 80% |
| 10 | 2505 | Natural sands of all kinds, whether or not coloured (excl.… | 0.59 | 1.4% | 81% |
Metrics
| Year | DMC/cap | AR/cap | DE/cap | Import dep. | Intl import dep. | Self-suff. | Export int. |
|---|---|---|---|---|---|---|---|
| 2013 | 19.0 | 17.7 | 15.6 | 60% | 39% | 82% | 55% |
| 2014 | 20.9 | 19.7 | 16.0 | 61% | 40% | 76% | 52% |
| 2015 | 22.6 | 21.5 | 16.3 | 62% | 42% | 72% | 50% |
| 2016 | 21.9 | 20.4 | 17.2 | 61% | 42% | 78% | 54% |
| 2017 | 21.5 | 20.0 | 17.6 | 60% | 42% | 82% | 55% |
| 2018 | 20.2 | 18.5 | 16.4 | 62% | 44% | 81% | 57% |
| 2019 | 21.1 | 19.8 | 17.0 | 60% | 37% | 80% | 53% |
| 2020 | 19.8 | 18.2 | 16.2 | 60% | 37% | 82% | 54% |
| 2021 | 17.6 | 15.6 | 16.4 | 59% | 38% | 93% | 61% |
| 2022 | 20.7 | 19.2 | 16.3 | 62% | 40% | 78% | 55% |
Västra Götalands län (SE232)
Sweden · NUTS 3 · code SE232 · tier A · years 2013–2022
Findings
- Västra Götaland is 84% of West Sweden's population and its profile is almost the same: DMC is 36.5 Mt or 21.1 t/cap in 2019 (range 17.6–22.5).
- Refining dominates trade (Göteborg and Brofjorden): crude oil is 47% of imports and refined products 57% of exports. Import dependency is 61%, international 38%.
- DE is observed for this county (not downscaled): 30.0 Mt, 66% crushed stone and 16% roundwood.
- DMC is 59% non-metallic minerals, 18% biomass and 14% fossil. 10 CN4 codes make up 80%.
- Transformation and balance: industry re-exports 14.0 Mt after processing. The unbalanced share is 4.9%.
Overview
| 2013 | 2019 | 2022 | |
|---|---|---|---|
| Population | 1 615 084 | 1 725 881 | 1 758 656 |
| DE (Mt) | 24.6 | 30.0 | 29.3 |
| Imports M (Mt) | 17.5 | 18.7 | 21.1 |
| Exports X (Mt) | 14.6 | 15.3 | 17.3 |
| Domestic in NI (Mt) | 24.2 | 27.5 | 27.4 |
| Domestic out NO (Mt) | 22.6 | 27.1 | 28.7 |
| AR (Mt) | 29.1 | 33.9 | 31.9 |
| DMC (Mt) | 31.5 | 36.5 | 35.5 |
| DMC (t/cap) | 19.5 | 21.1 | 20.2 |
| Unbalanced (% of gross AR) | 5.2% | 4.9% | 6.7% |
Domestic extraction
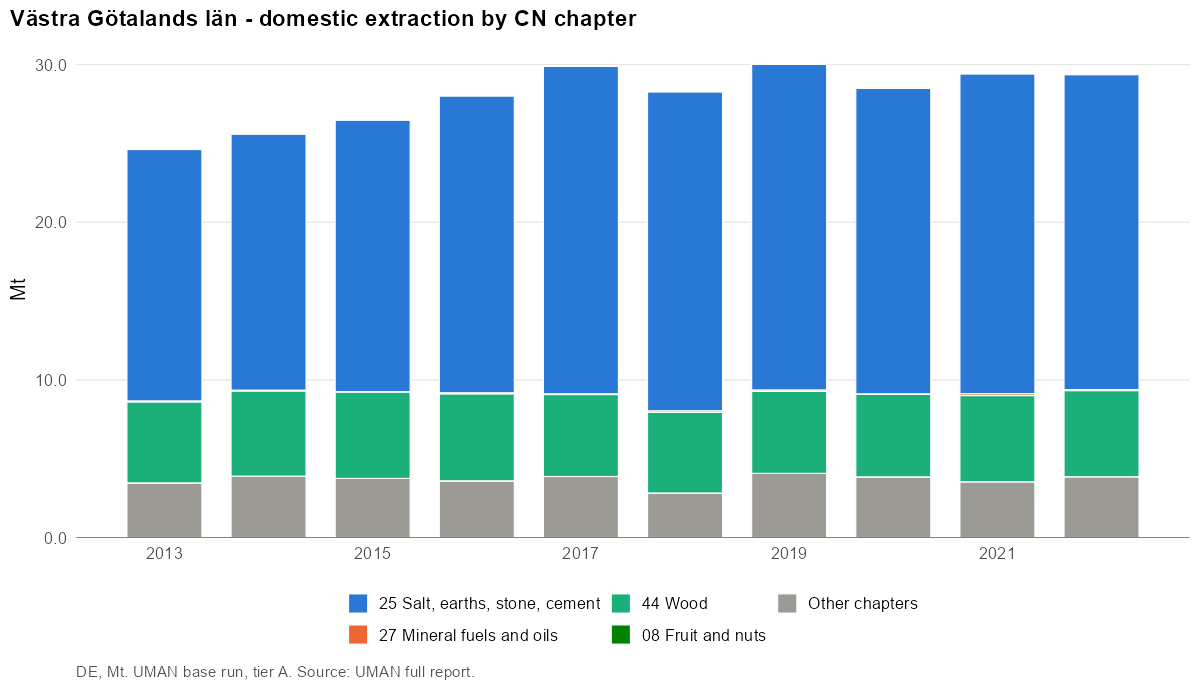
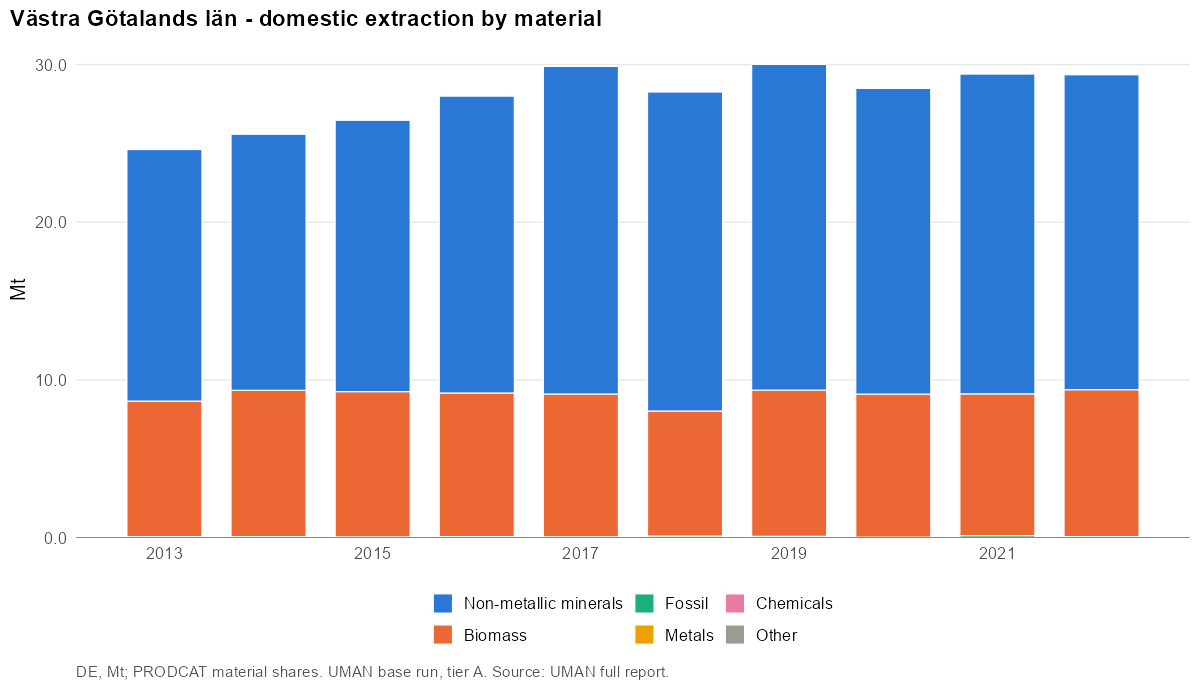
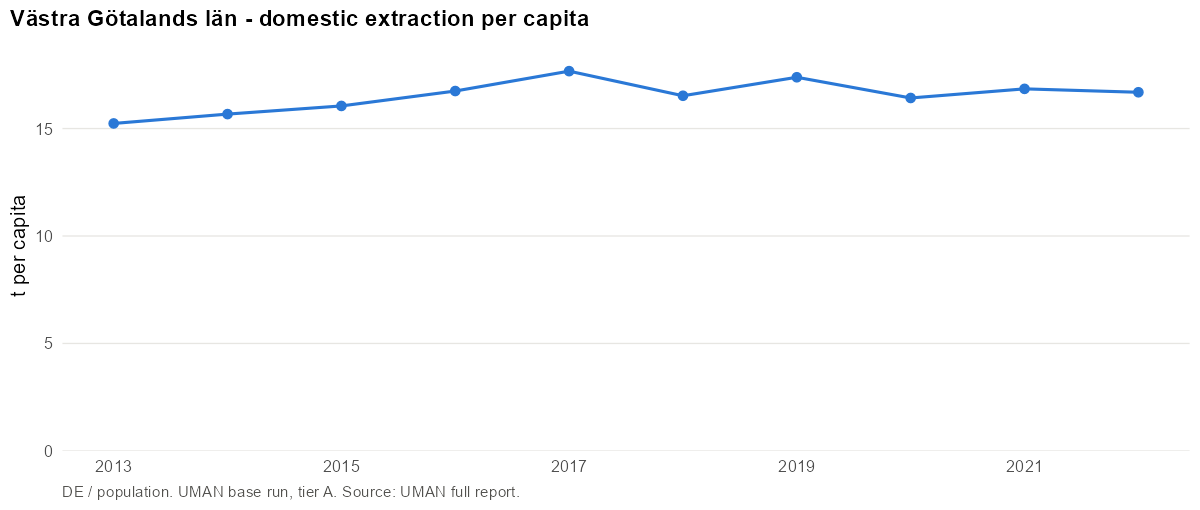
- Main CN4 codes (2019): 2517 Pebbles, gravel, broken or crushed stone, for concrete… (66%); 4403 Wood in the rough, whether or not stripped of bark or… (16%); 1214 Swedes, mangolds, fodder roots, hay, alfalfa, clover… (3%); 2505 Natural sands of all kinds, whether or not coloured (excl.… (2%); 1213 Cereal straw and husks, unprepared, whether or not chopped… (2%).
- Main materials: Stone (66%); Wood and wood fuels (17%); Agriculture biomass (12%).
International trade
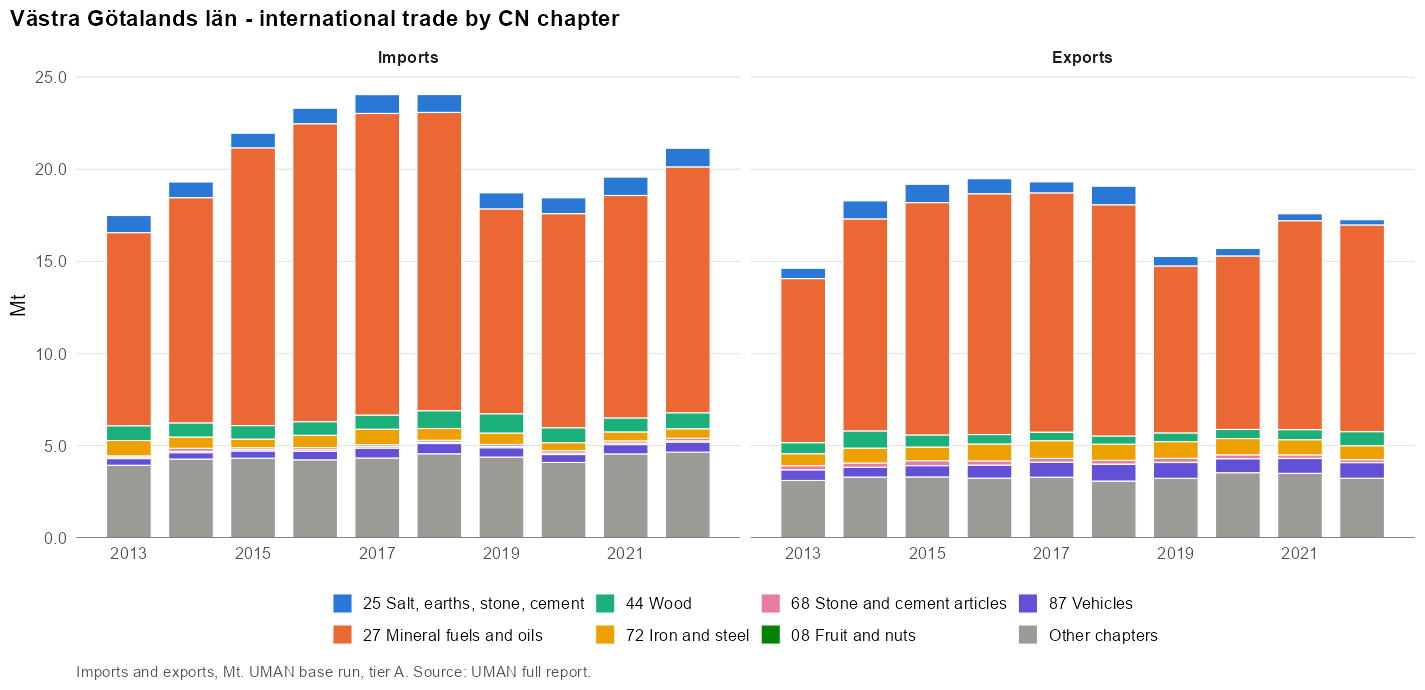
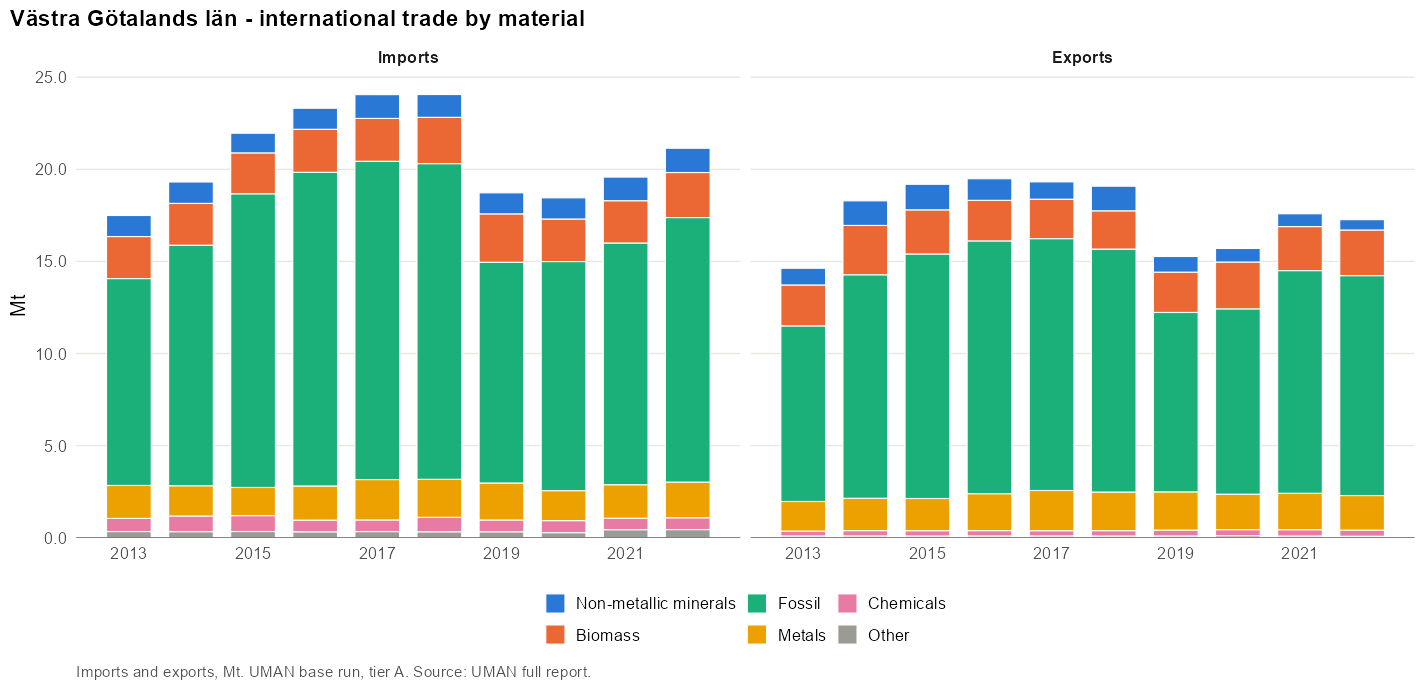
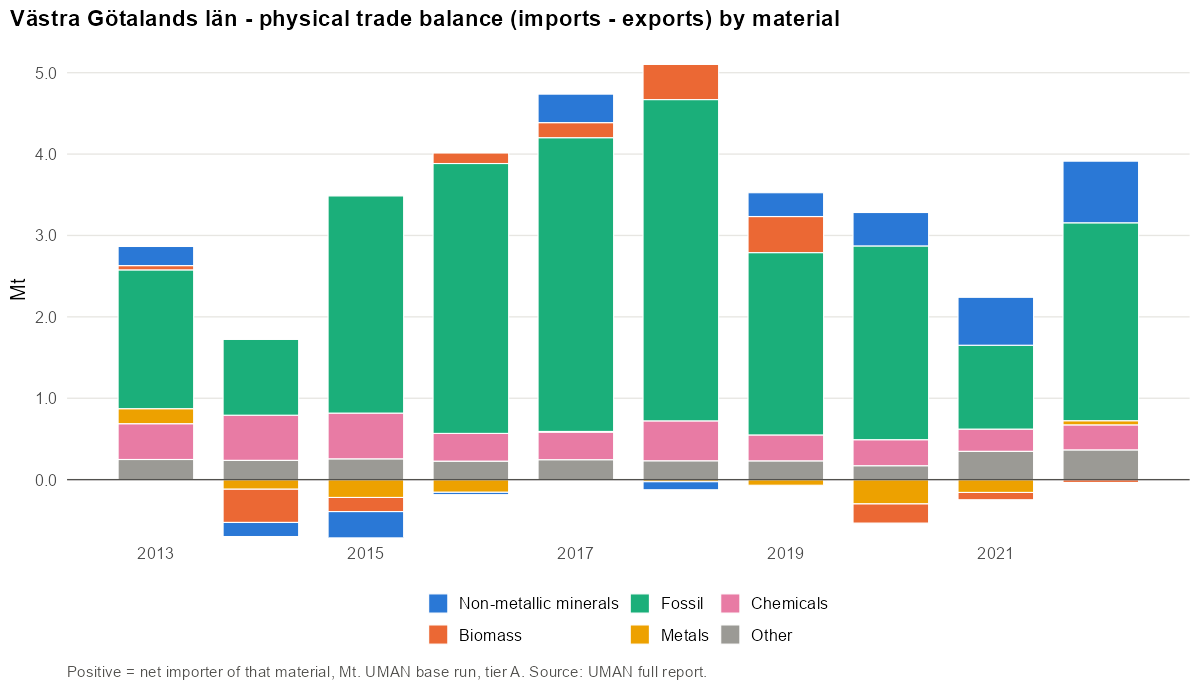
Imports:
- Main CN4 codes (2019): 2709 Petroleum oils and oils obtained from bituminous minerals… (47%); 2710 Petroleum oils and oils obtained from bituminous minerals… (9%); 4403 Wood in the rough, whether or not stripped of bark or… (3%); 8708 Parts and accessories for tractors, motor vehicles for the… (2%); 2711 Petroleum gas and other gaseous hydrocarbons (2%).
- Main materials: Fuels (21%); Plastics and rubbers (16%); Lubricants, oils and solvents (14%).
Exports:
- Main CN4 codes (2019): 2710 Petroleum oils and oils obtained from bituminous minerals… (57%); 7204 Ferrous waste and scrap; remelting scrap ingots of iron or… (5%); 8703 Motor cars and other motor vehicles principally designed… (3%); 4407 Wood sawn or chipped lengthwise, sliced or peeled, whether… (2%); 2711 Petroleum gas and other gaseous hydrocarbons (2%).
- Main materials: Fuels (54%); Iron, steel and ferro-alloys (12%); Wood and wood fuels (5%).
Domestic movement of goods
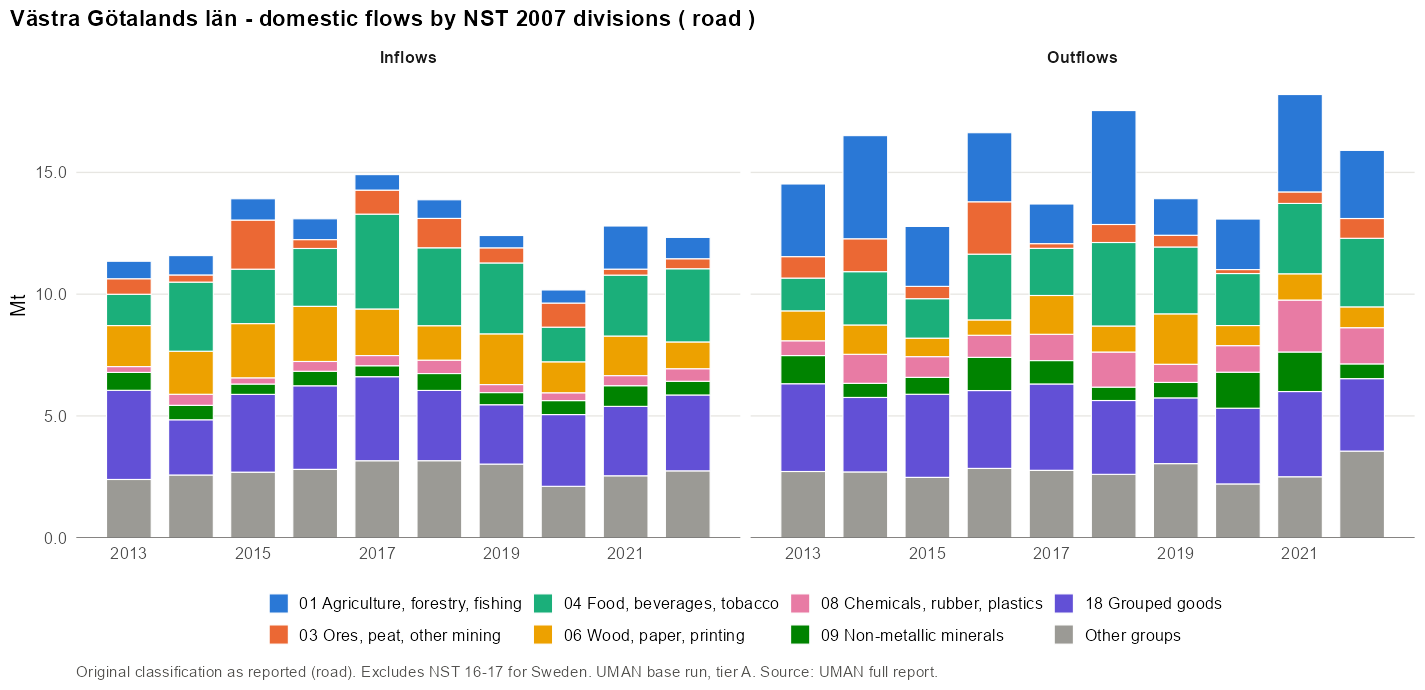
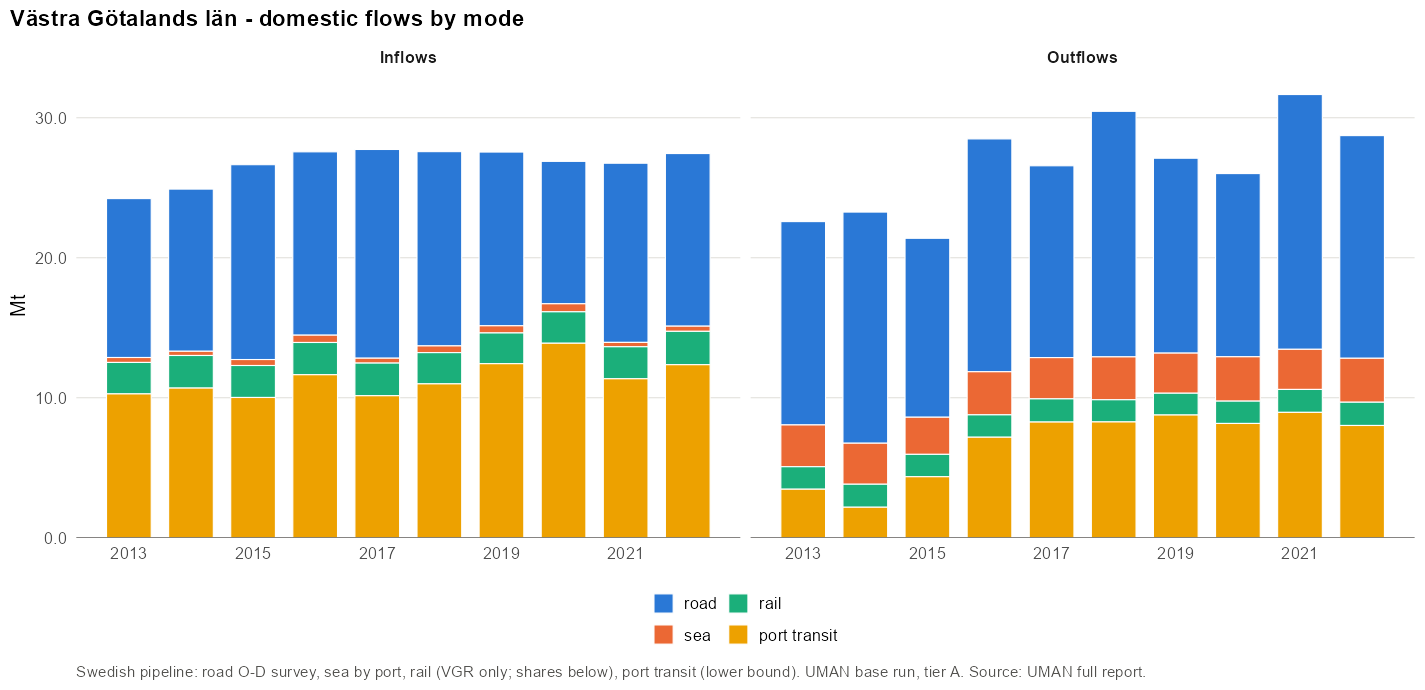
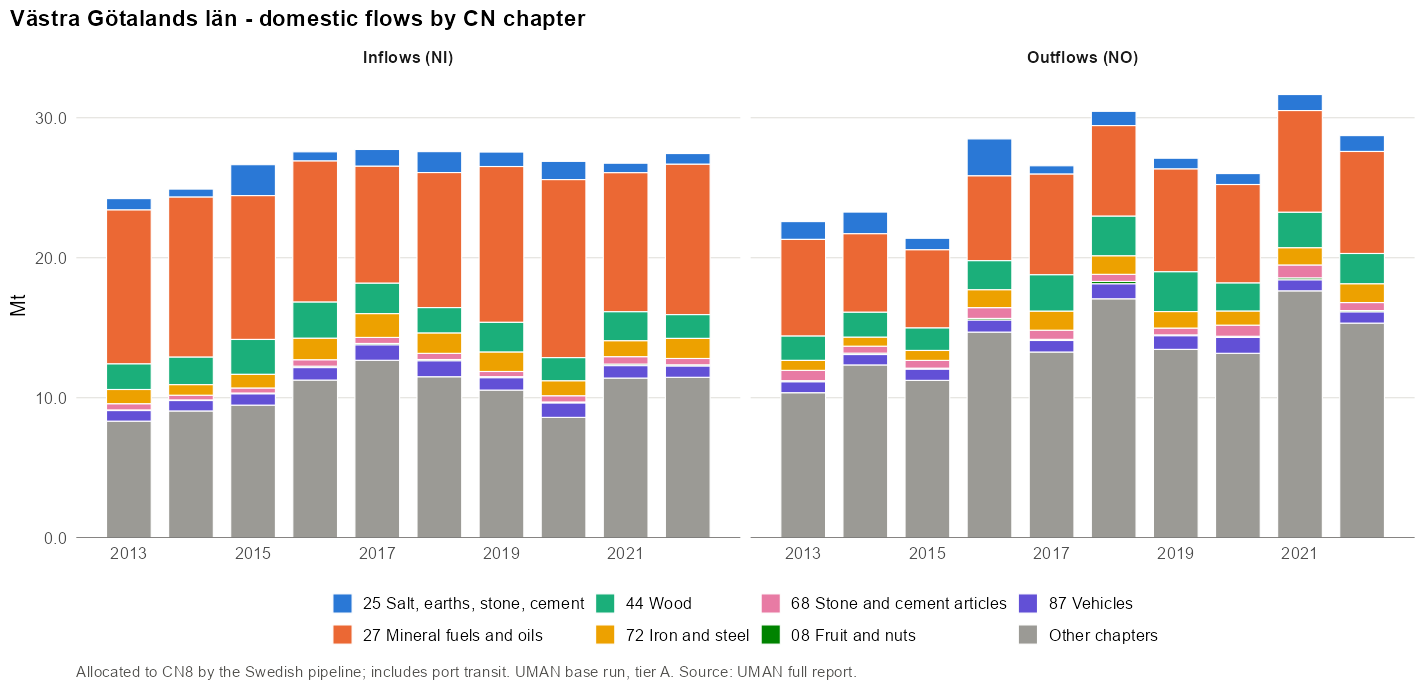
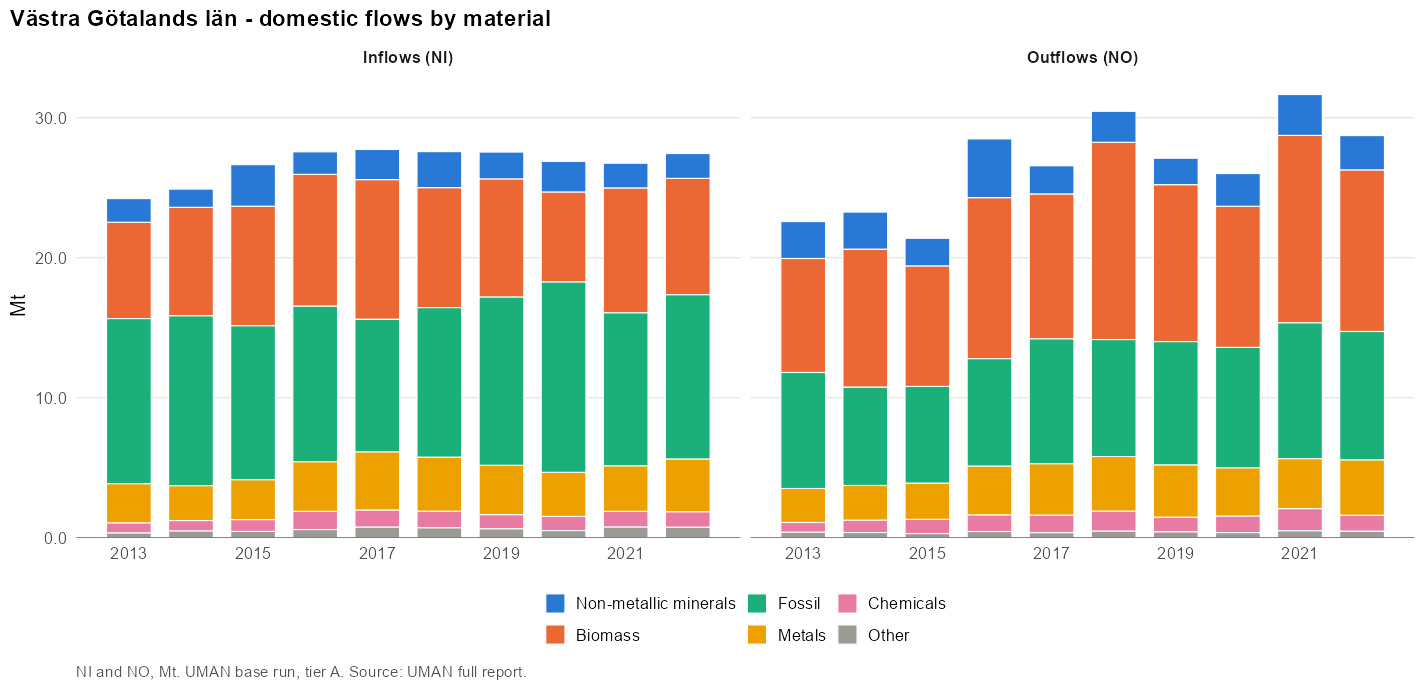
Inflows:
- Main CN4 codes (2019): 2709 Petroleum oils and oils obtained from bituminous minerals… (20%); 2710 Petroleum oils and oils obtained from bituminous minerals… (14%); 2701 Coal; briquettes, ovoids and similar solid fuels… (3%); 4403 Wood in the rough, whether or not stripped of bark or… (3%); 2711 Petroleum gas and other gaseous hydrocarbons (3%).
- Main materials: Fuels (22%); Iron, steel and ferro-alloys (11%); Wood and wood fuels (10%).
Outflows:
- Main CN4 codes (2019): 2710 Petroleum oils and oils obtained from bituminous minerals… (24%); 4403 Wood in the rough, whether or not stripped of bark or… (5%); 4407 Wood sawn or chipped lengthwise, sliced or peeled, whether… (3%); 4703 Chemical wood pulp, soda or sulphate (excl. dissolving… (2%); 2517 Pebbles, gravel, broken or crushed stone, for concrete… (2%).
- Main materials: Fuels (23%); Wood and wood fuels (13%); Agriculture biomass (13%).
Available resources
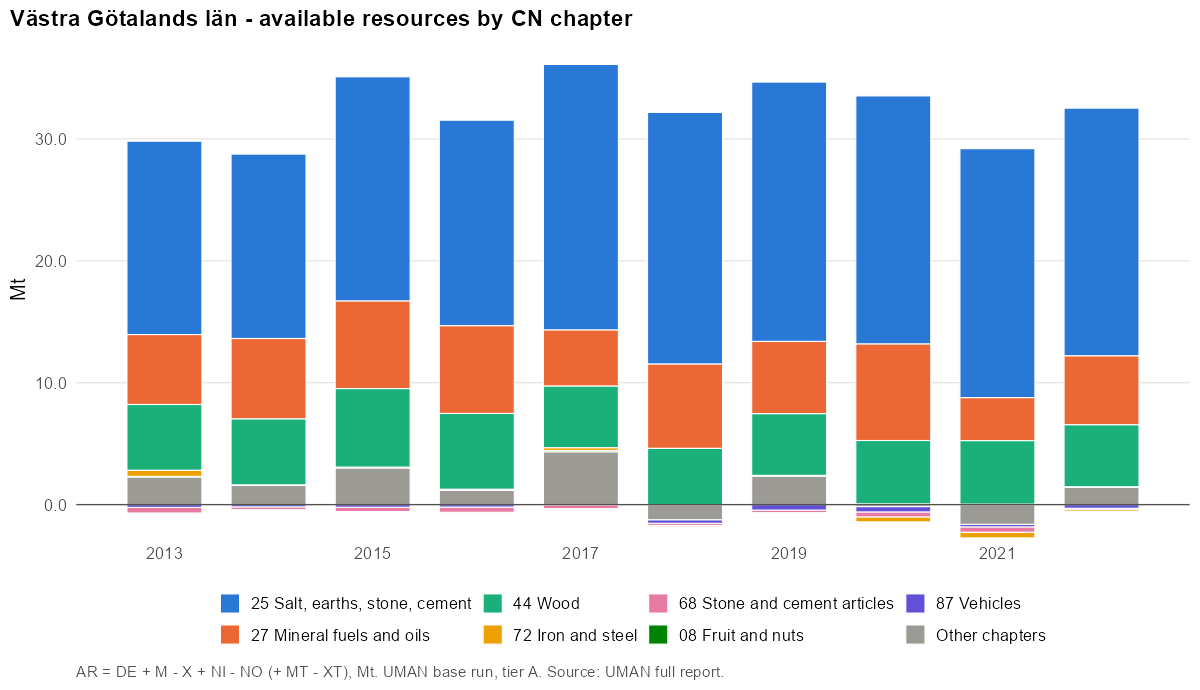
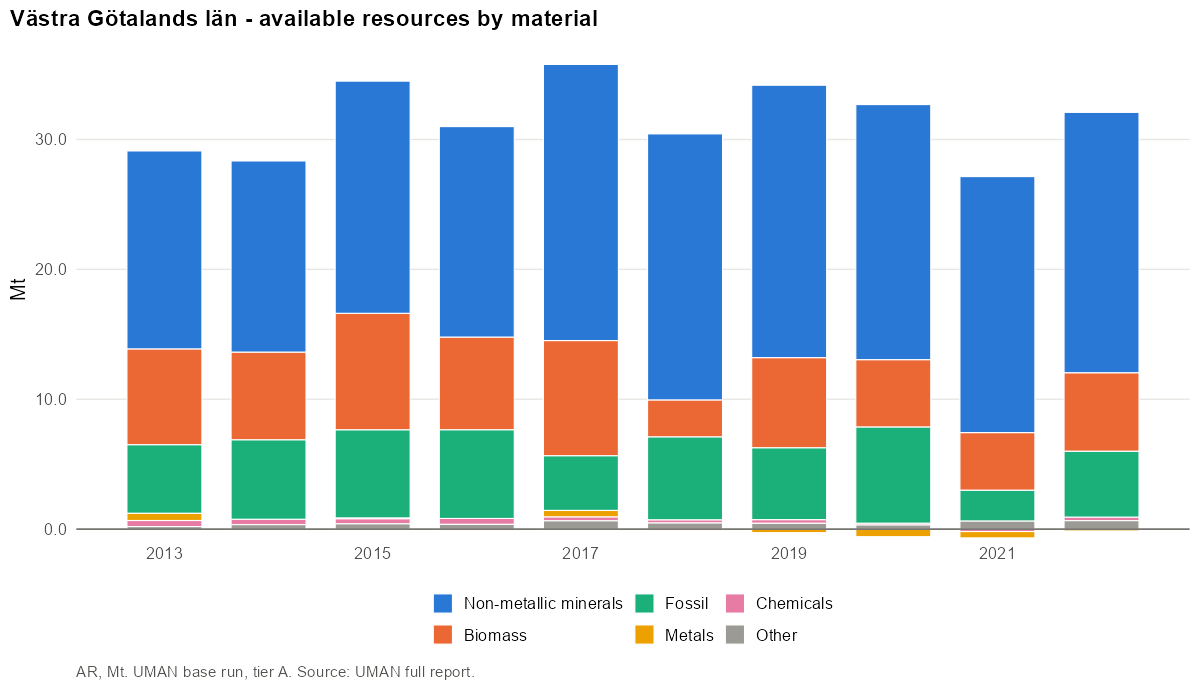
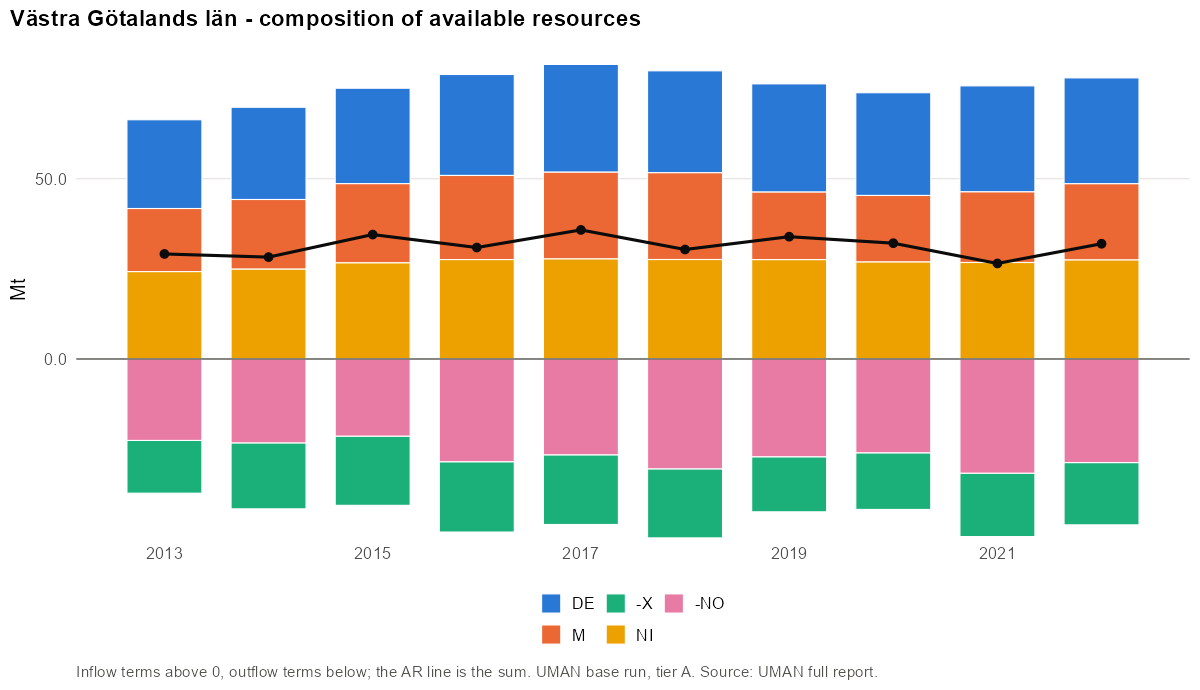
- Main CN4 codes (2019): 2517 Pebbles, gravel, broken or crushed stone, for concrete… (59%); 2709 Petroleum oils and oils obtained from bituminous minerals… (42%); 4403 Wood in the rough, whether or not stripped of bark or… (14%); 4401 Fuel wood, in logs, billets, twigs, faggots or similar… (3%); 2505 Natural sands of all kinds, whether or not coloured (excl.… (3%).
- Main materials: Stone (59%); Wood and wood fuels (14%); Other fossil fuels (11%).
Industrial production
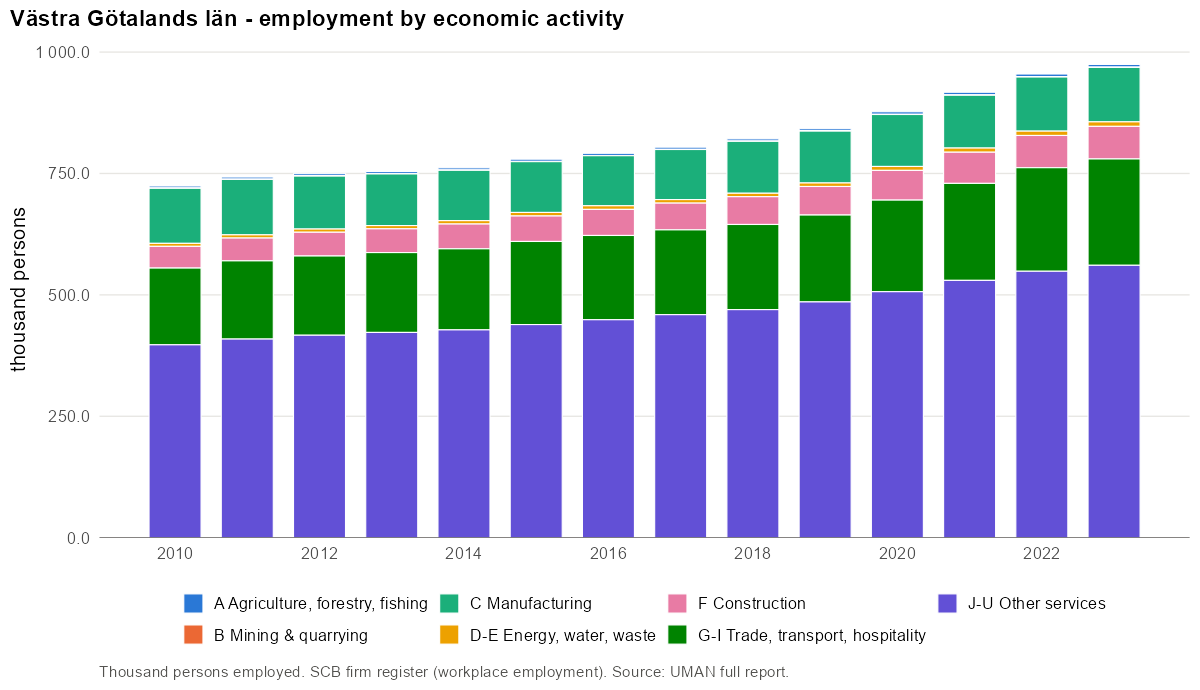
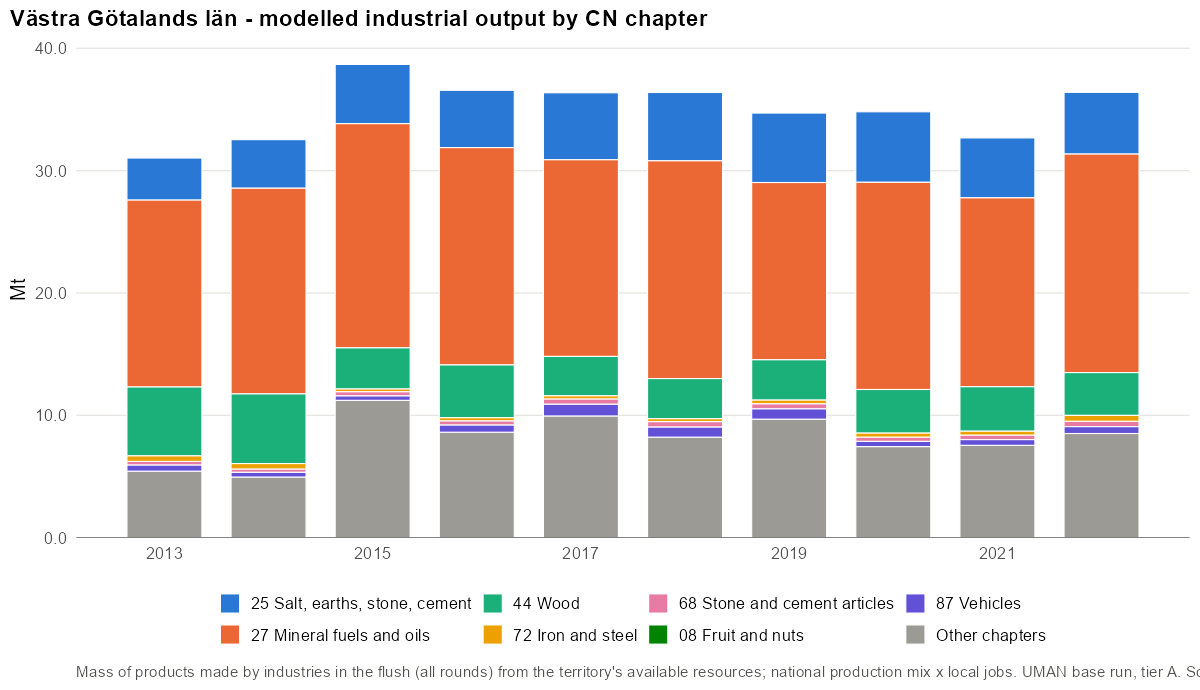
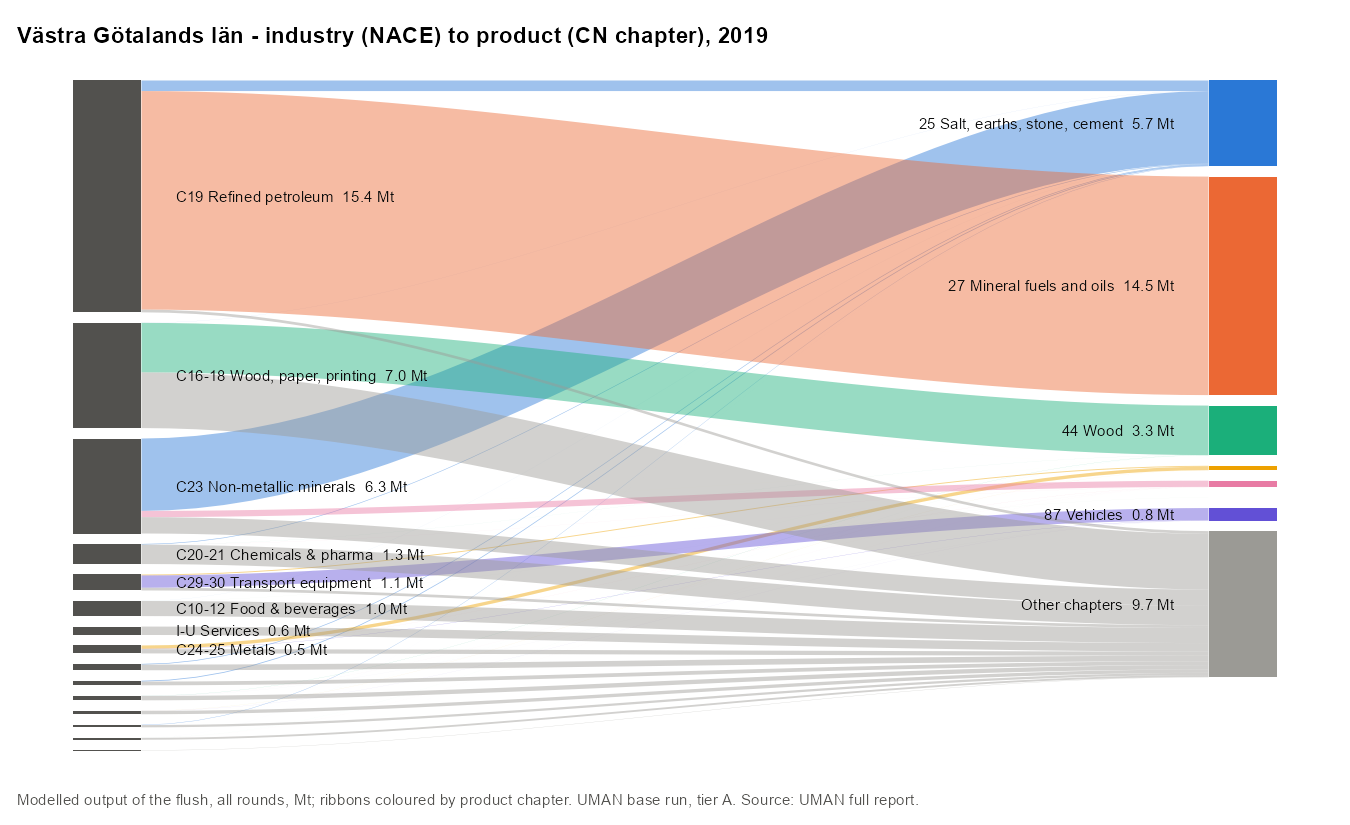
Largest employers (NACE divisions):
| NACE | Activity | Persons | Share |
|---|---|---|---|
| 85 | Education | 83 805 | 10.0% |
| 86 | Human health activities | 55 219 | 6.6% |
| 47 | Retail trade, except of motor vehicles and motorcycles | 49 502 | 5.9% |
| 84 | Public administration and defence; compulsory social security | 47 717 | 5.7% |
| 88 | Social work activities without accommodation | 47 540 | 5.6% |
| 87 | Residential care activities | 40 763 | 4.8% |
| 46 | Wholesale trade, except of motor vehicles and motorcycles | 40 094 | 4.8% |
| 43 | Specialised construction activities | 37 853 | 4.5% |
Product transformation
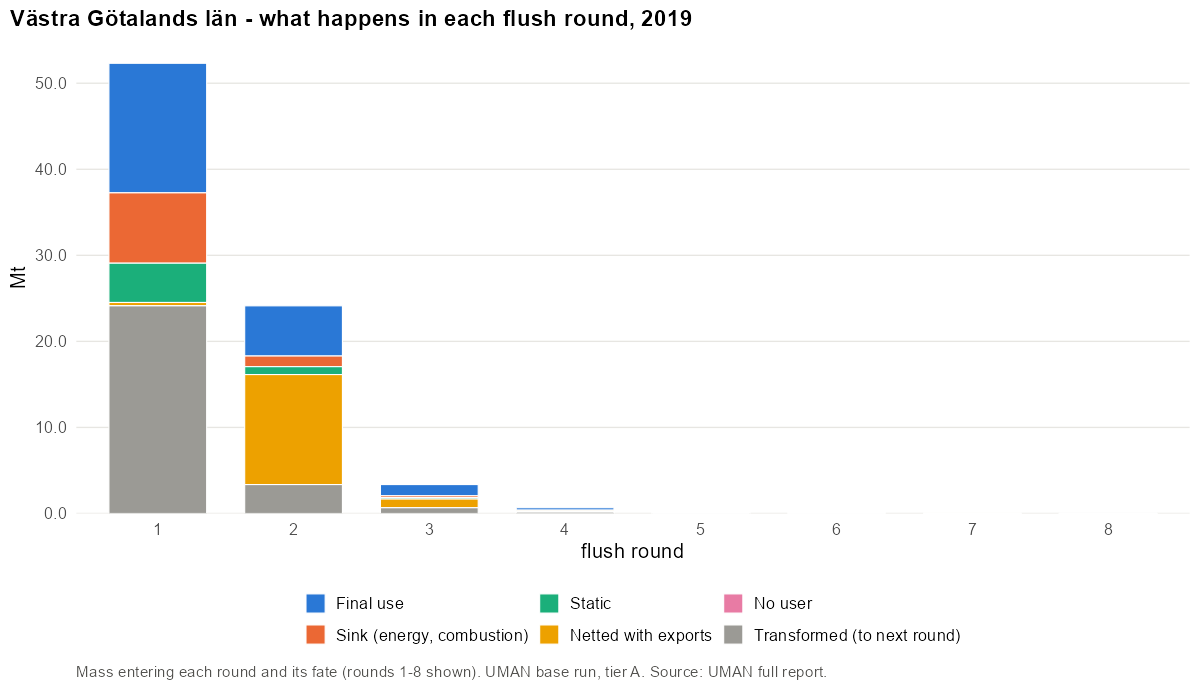
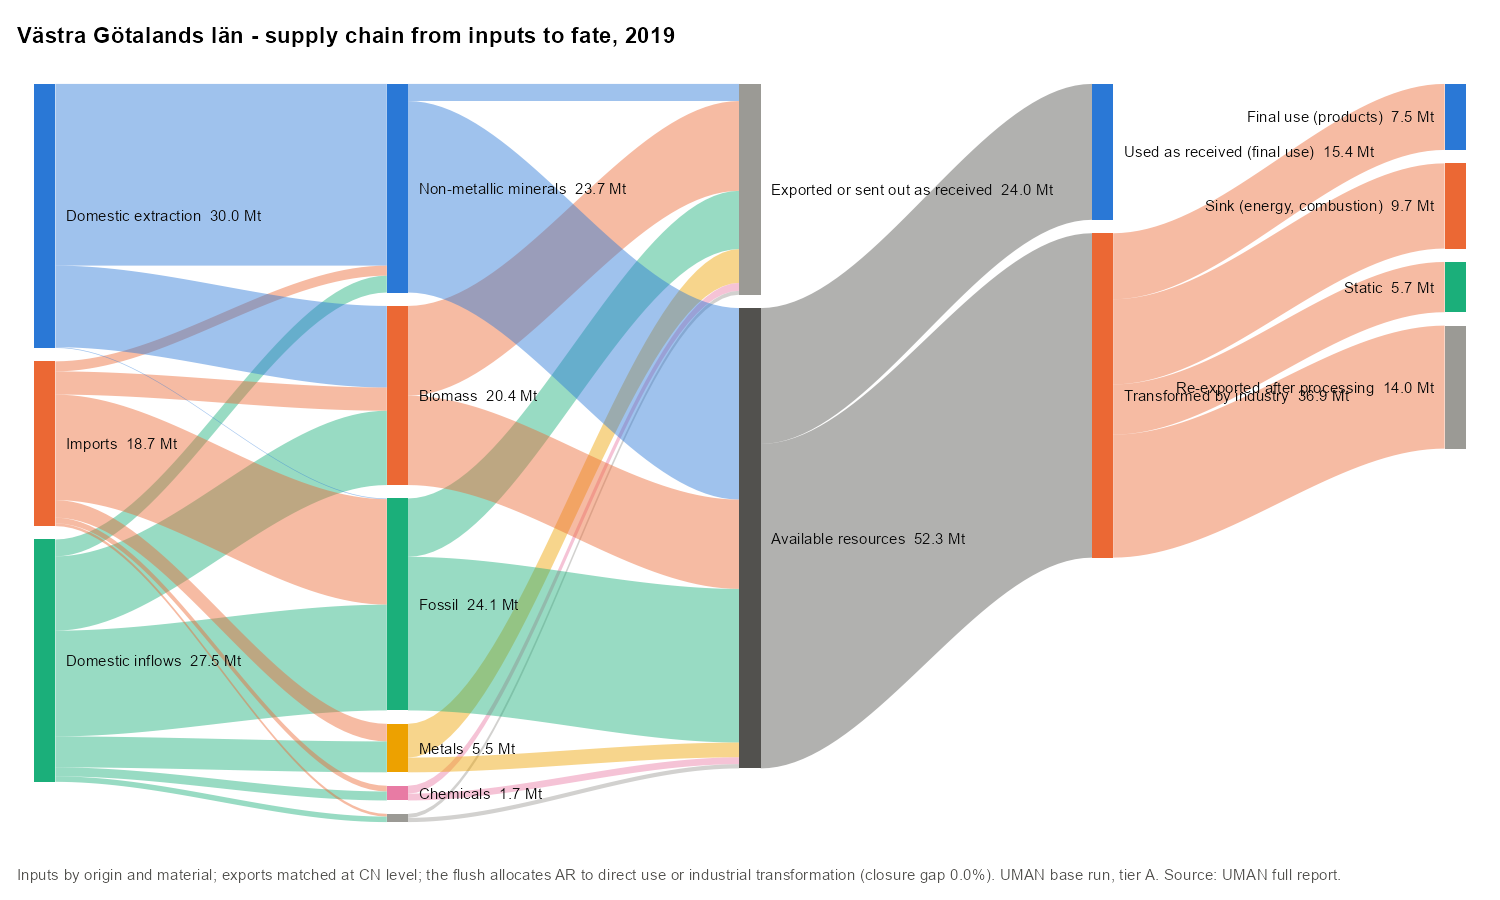
The flush needed 10 rounds. Round 1 handled 52.3 Mt; 46% of it was transformed into other products and re-entered round 2.
Domestic material consumption
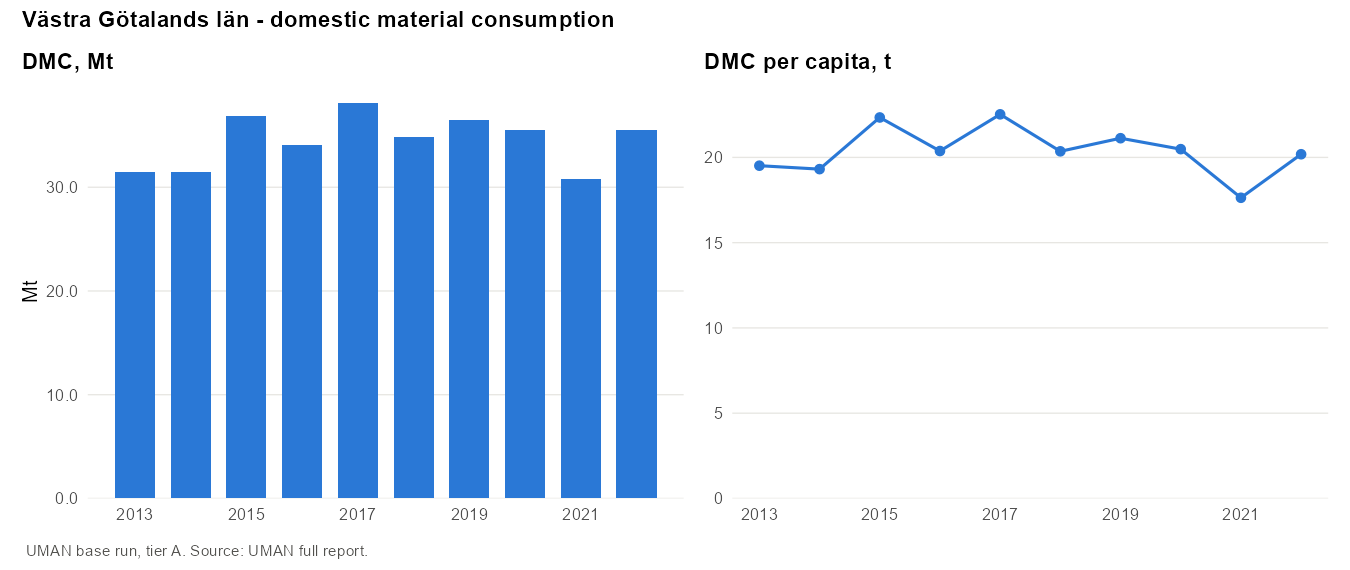
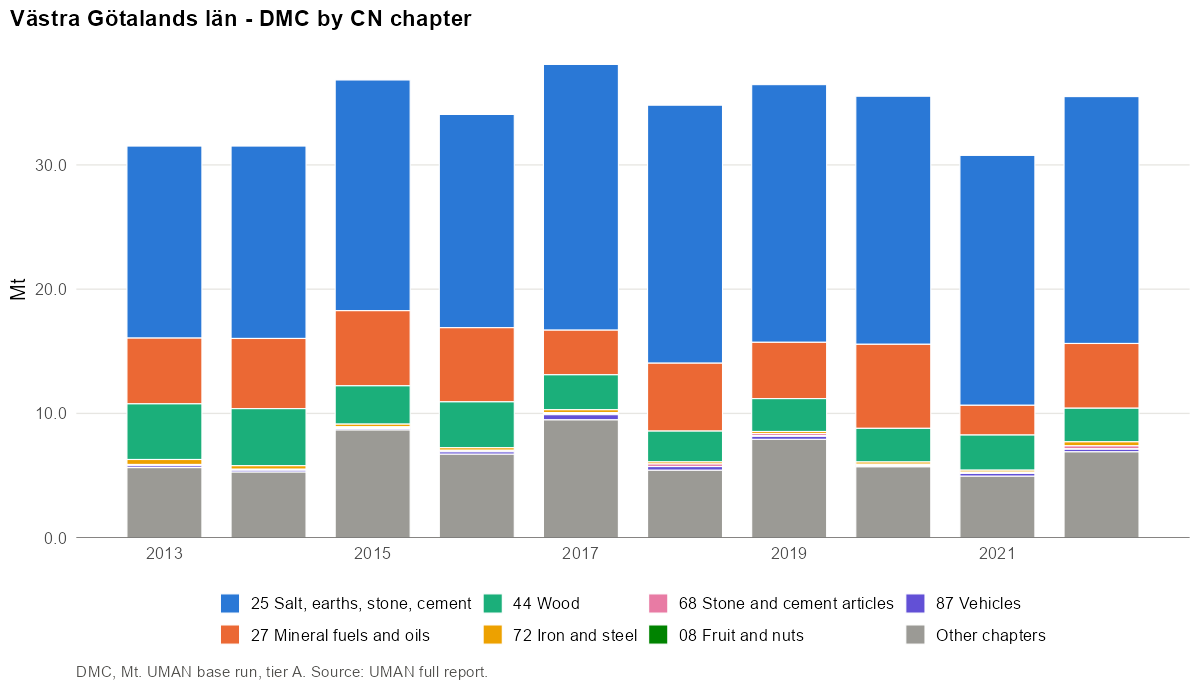
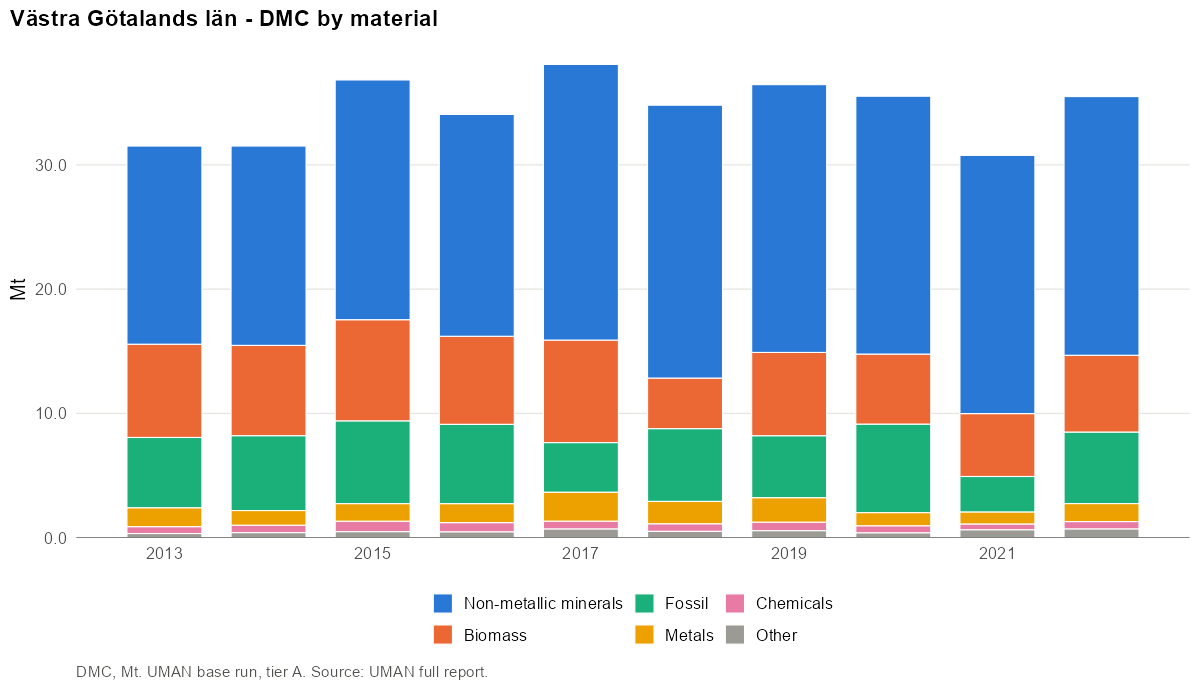
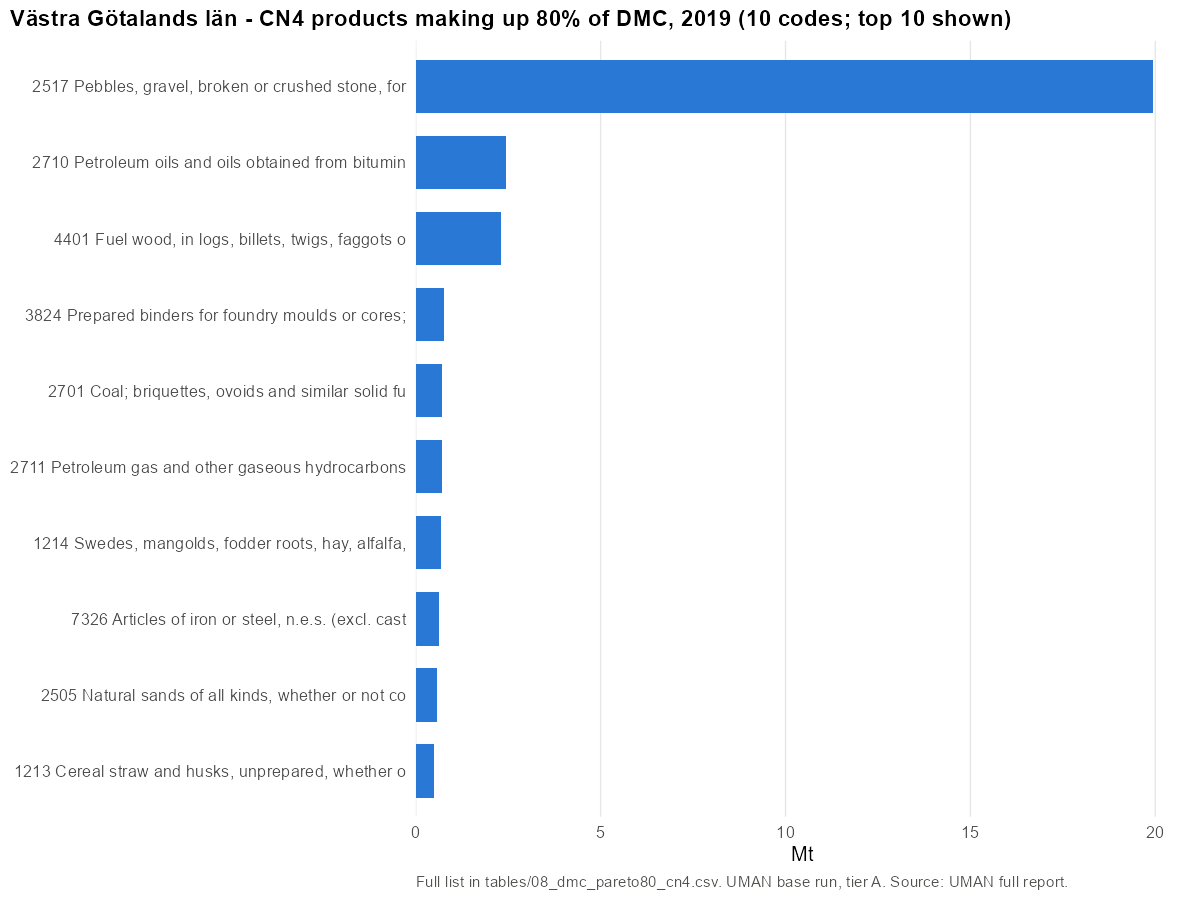
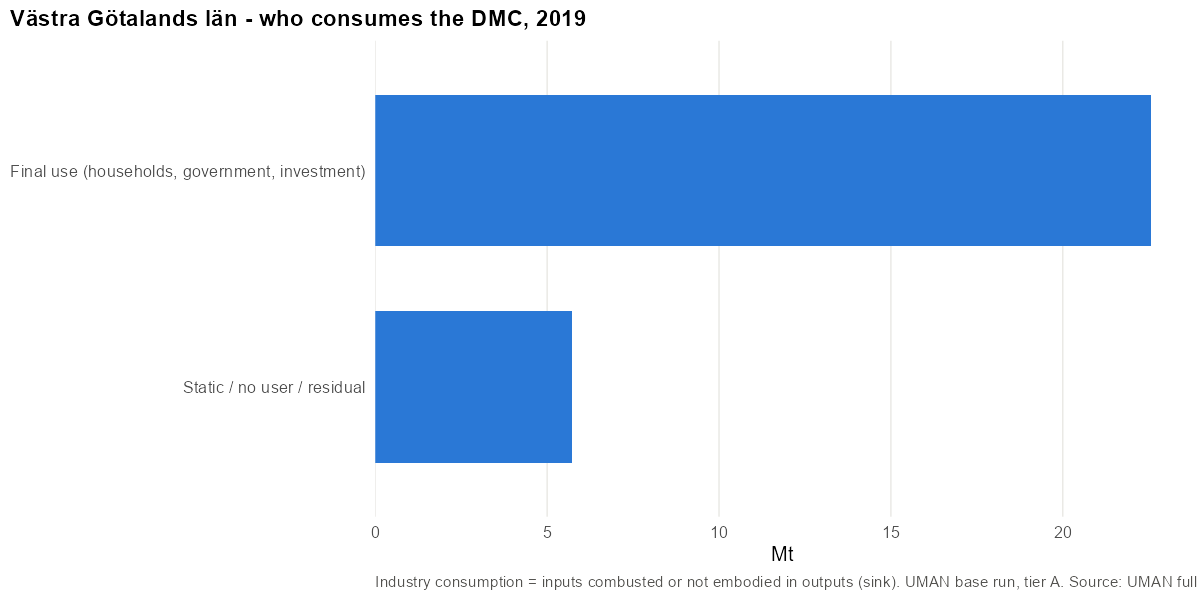
- Main CN4 codes (2019): 2517 Pebbles, gravel, broken or crushed stone, for concrete… (55%); 2710 Petroleum oils and oils obtained from bituminous minerals… (7%); 4401 Fuel wood, in logs, billets, twigs, faggots or similar… (6%); 3824 Prepared binders for foundry moulds or cores; chemical… (2%); 2701 Coal; briquettes, ovoids and similar solid fuels… (2%).
- Main materials: Stone (55%); Fuels (9%); Wood and wood fuels (8%).
10 CN4 codes make up 80% of DMC in 2019. Top 10:
| Rank | CN4 | Product | Mt | Share | Cumulative |
|---|---|---|---|---|---|
| 1 | 2517 | Pebbles, gravel, broken or crushed stone, for concrete… | 19.93 | 54.7% | 55% |
| 2 | 2710 | Petroleum oils and oils obtained from bituminous minerals… | 2.43 | 6.7% | 61% |
| 3 | 4401 | Fuel wood, in logs, billets, twigs, faggots or similar… | 2.30 | 6.3% | 68% |
| 4 | 3824 | Prepared binders for foundry moulds or cores; chemical… | 0.75 | 2.1% | 70% |
| 5 | 2701 | Coal; briquettes, ovoids and similar solid fuels… | 0.72 | 2.0% | 72% |
| 6 | 2711 | Petroleum gas and other gaseous hydrocarbons | 0.70 | 1.9% | 74% |
| 7 | 1214 | Swedes, mangolds, fodder roots, hay, alfalfa, clover… | 0.69 | 1.9% | 75% |
| 8 | 7326 | Articles of iron or steel, n.e.s. (excl. cast articles) | 0.63 | 1.7% | 77% |
| 9 | 2505 | Natural sands of all kinds, whether or not coloured (excl.… | 0.58 | 1.6% | 79% |
| 10 | 1213 | Cereal straw and husks, unprepared, whether or not chopped… | 0.51 | 1.4% | 80% |
Metrics
| Year | DMC/cap | AR/cap | DE/cap | Import dep. | Intl import dep. | Self-suff. | Export int. |
|---|---|---|---|---|---|---|---|
| 2013 | 19.5 | 18.0 | 15.2 | 63% | 42% | 78% | 56% |
| 2014 | 19.3 | 17.3 | 15.7 | 63% | 43% | 81% | 60% |
| 2015 | 22.3 | 20.9 | 16.1 | 65% | 45% | 72% | 54% |
| 2016 | 20.4 | 18.5 | 16.7 | 65% | 45% | 82% | 61% |
| 2017 | 22.5 | 21.2 | 17.7 | 63% | 45% | 78% | 56% |
| 2018 | 20.4 | 17.8 | 16.5 | 65% | 46% | 81% | 62% |
| 2019 | 21.1 | 19.6 | 17.4 | 61% | 38% | 82% | 56% |
| 2020 | 20.5 | 18.5 | 16.4 | 61% | 39% | 80% | 57% |
| 2021 | 17.6 | 15.2 | 16.8 | 61% | 40% | 96% | 65% |
| 2022 | 20.2 | 18.2 | 16.7 | 62% | 42% | 83% | 59% |
Göteborgs kommun (1480)
Sweden · LAU · code 1480 · tier A · years 2013–2022
Findings
- DMC is 11.0 Mt or 19.1 t/cap in 2019, below the county (21.1). It is the most volatile series in the report: 14.7 t/cap in 2013, 20.8 in 2022.
- The city is a gateway: domestic flows (25.1 Mt in, 24.1 Mt out) are more than twice its DMC. Import dependency is 84% and export intensity 80%, the highest values in the report.
- Its own AR is only 7.4 Mt (12.8 t/cap). DMC exceeds AR by 3.6 Mt of unbalanced outflows: 19% of gross AR, the highest share in the report. Part of the city's outflows cannot be matched with modelled local production.
- The composition differs from the hinterland: 40% non-metallic minerals, 23% fossil, 18% metals and 11% biomass. Metals and fossil reflect refining, the port and the vehicle industry (cars and car parts in trade). DMC is more diversified (23 CN4 codes make up 80%).
- DE (6.0 Mt) is 94% crushed stone, allocated to the city by quarry jobs in the Swedish pipeline, and so modelled rather than observed.
- 55% of round-1 inputs are transformed, the highest share among the Swedish territories.
Overview
| 2013 | 2019 | 2022 | |
|---|---|---|---|
| Population | 533 271 | 579 281 | 596 841 |
| DE (Mt) | 3.1 | 6.0 | 4.9 |
| Imports M (Mt) | 6.5 | 6.9 | 7.4 |
| Exports X (Mt) | 5.6 | 6.5 | 7.9 |
| Domestic in NI (Mt) | 16.2 | 25.1 | 24.9 |
| Domestic out NO (Mt) | 14.1 | 24.1 | 22.2 |
| AR (Mt) | 6.2 | 7.4 | 7.1 |
| DMC (Mt) | 7.8 | 11.0 | 12.4 |
| DMC (t/cap) | 14.7 | 19.1 | 20.8 |
| Unbalanced (% of gross AR) | 10.4% | 19.3% | 26.9% |
Domestic extraction
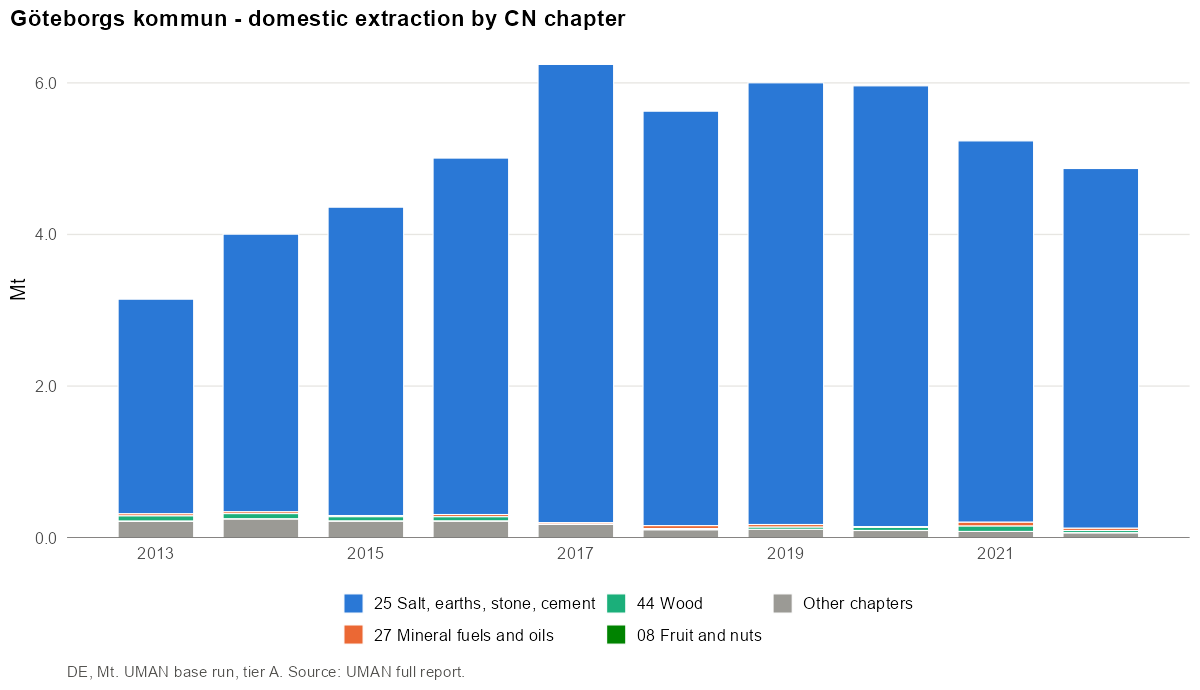
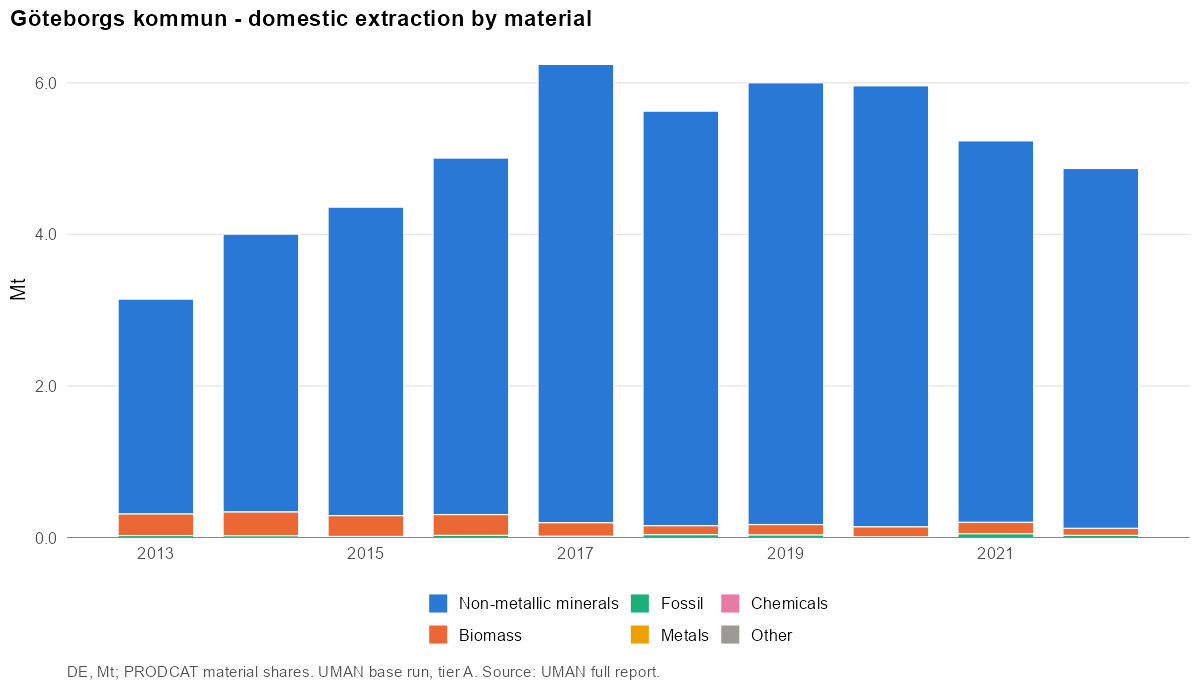
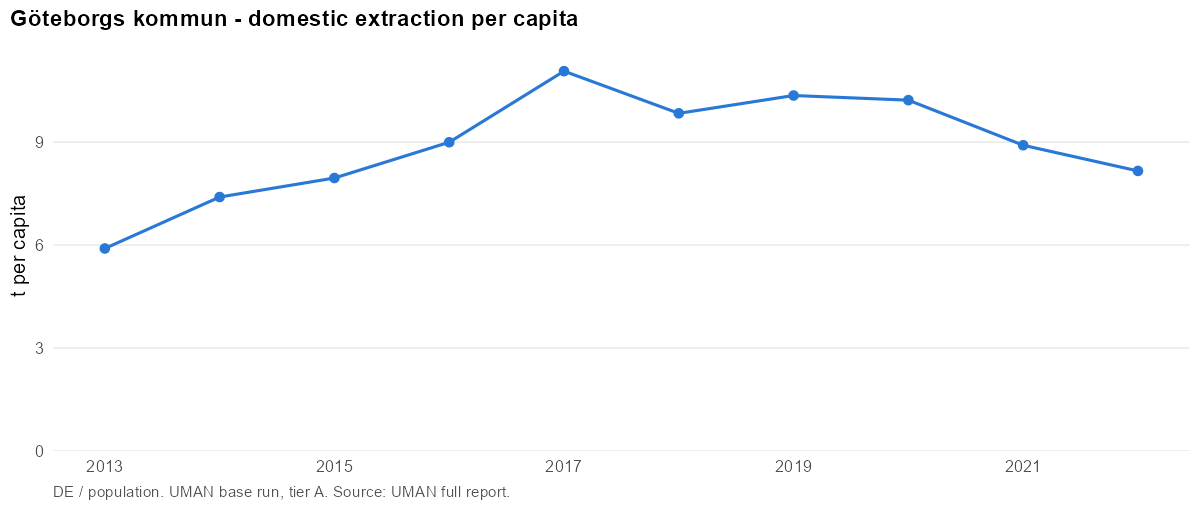
- Main CN4 codes (2019): 2517 Pebbles, gravel, broken or crushed stone, for concrete… (94%); 2505 Natural sands of all kinds, whether or not coloured (excl.… (3%); 1516 Animal or vegetable fats and oils and their fractions… (1%); 1214 Swedes, mangolds, fodder roots, hay, alfalfa, clover… (1%); 2703 Peat, incl. peat litter, whether or not agglomerated (1%).
- Main materials: Stone (94%); Sand (3%); Agriculture biomass (1%).
International trade
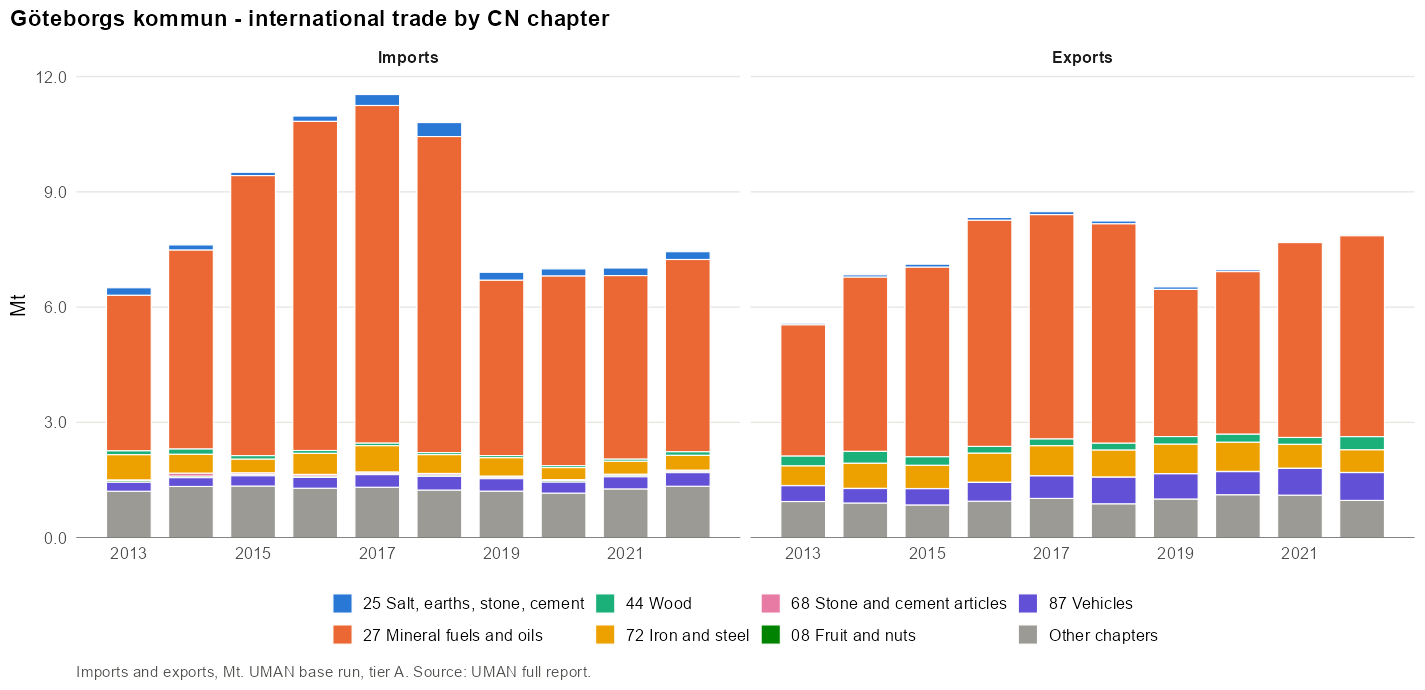
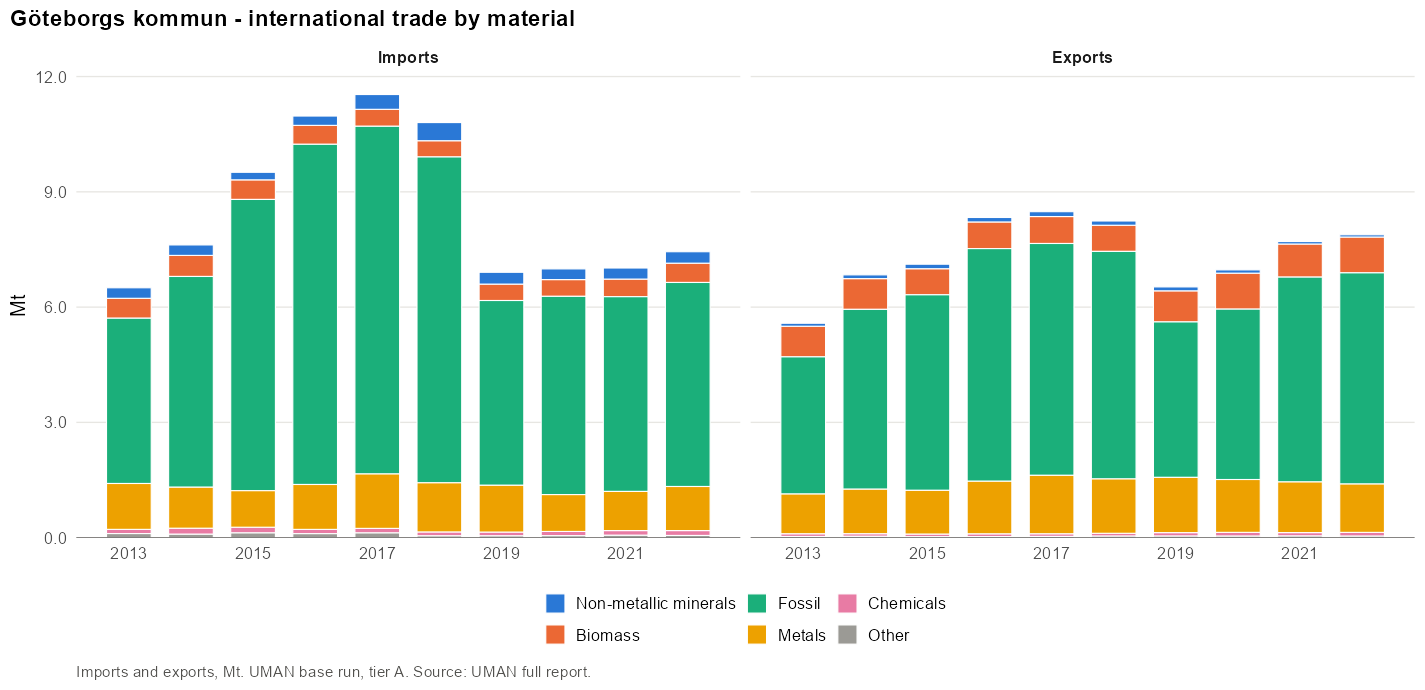
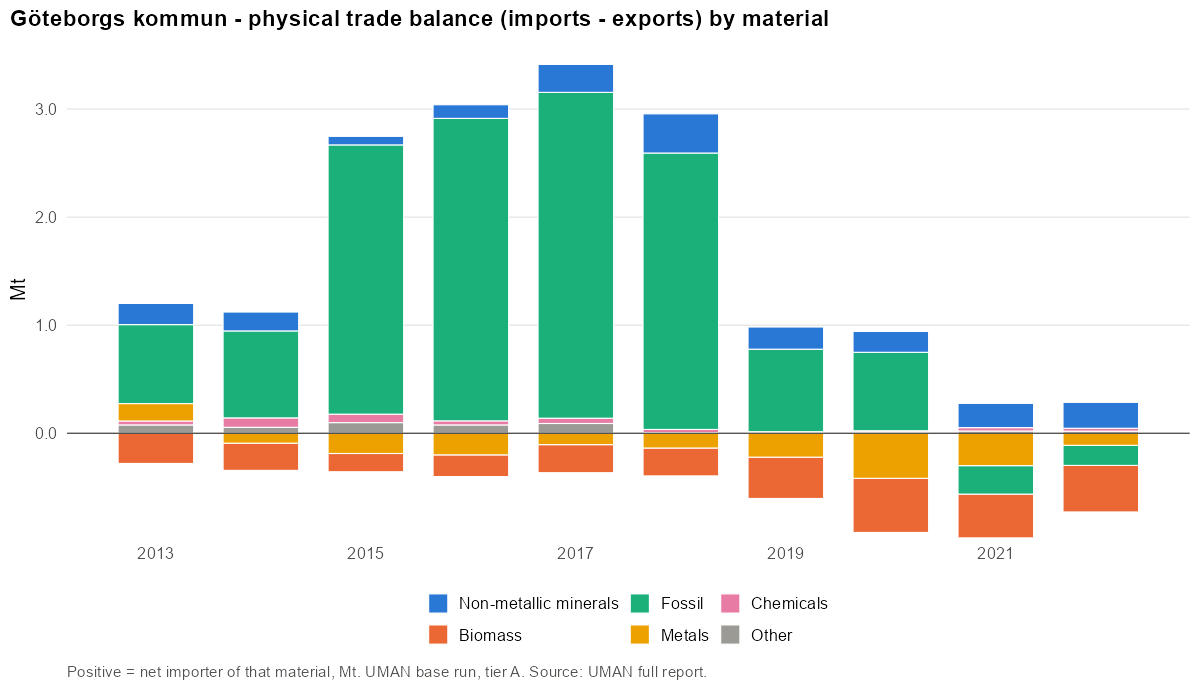
Imports:
- Main CN4 codes (2019): 2709 Petroleum oils and oils obtained from bituminous minerals… (45%); 2710 Petroleum oils and oils obtained from bituminous minerals… (15%); 2711 Petroleum gas and other gaseous hydrocarbons (6%); 8708 Parts and accessories for tractors, motor vehicles for the… (4%); 7225 Flat-rolled products of alloy steel other than stainless… (3%).
- Main materials: Fuels (31%); Iron, steel and ferro-alloys (16%); Plastics and rubbers (14%).
Exports:
- Main CN4 codes (2019): 2710 Petroleum oils and oils obtained from bituminous minerals… (55%); 7204 Ferrous waste and scrap; remelting scrap ingots of iron or… (11%); 8703 Motor cars and other motor vehicles principally designed… (6%); 4407 Wood sawn or chipped lengthwise, sliced or peeled, whether… (3%); 2711 Petroleum gas and other gaseous hydrocarbons (2%).
- Main materials: Fuels (53%); Iron, steel and ferro-alloys (20%); Wood and wood fuels (7%).
Domestic movement of goods
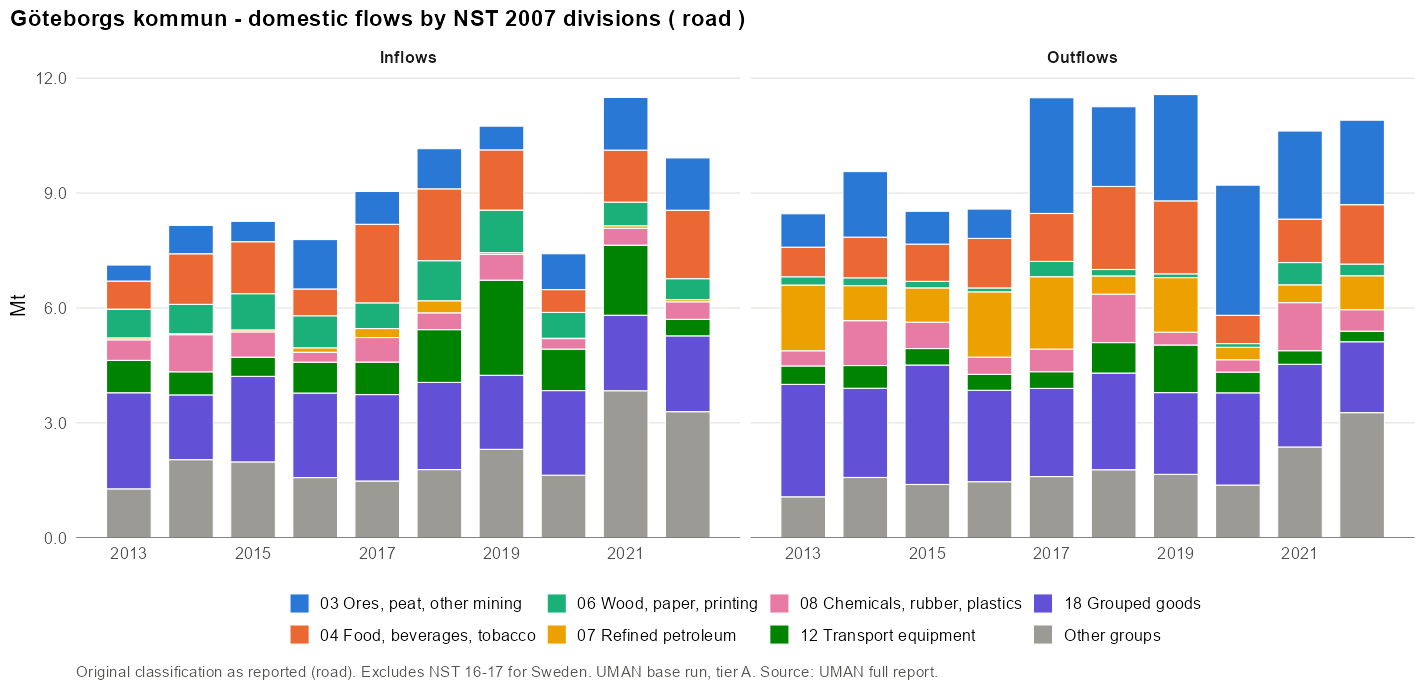
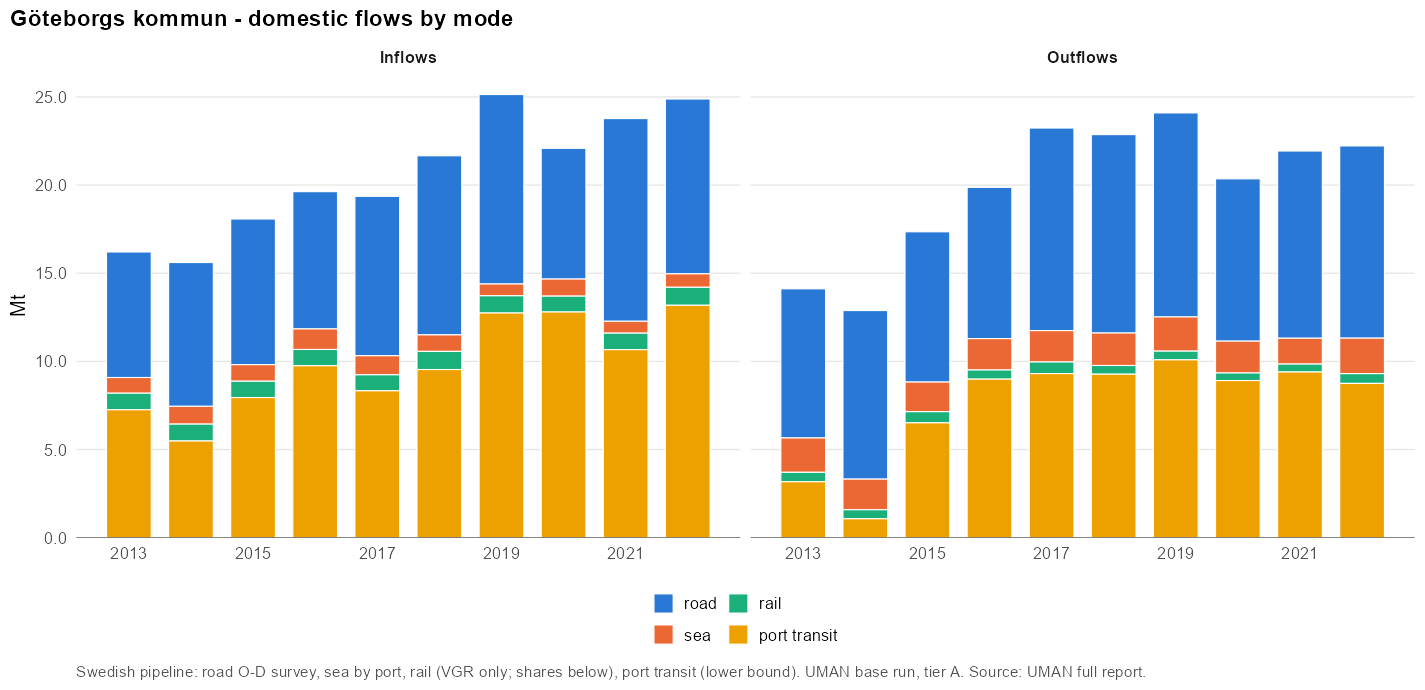
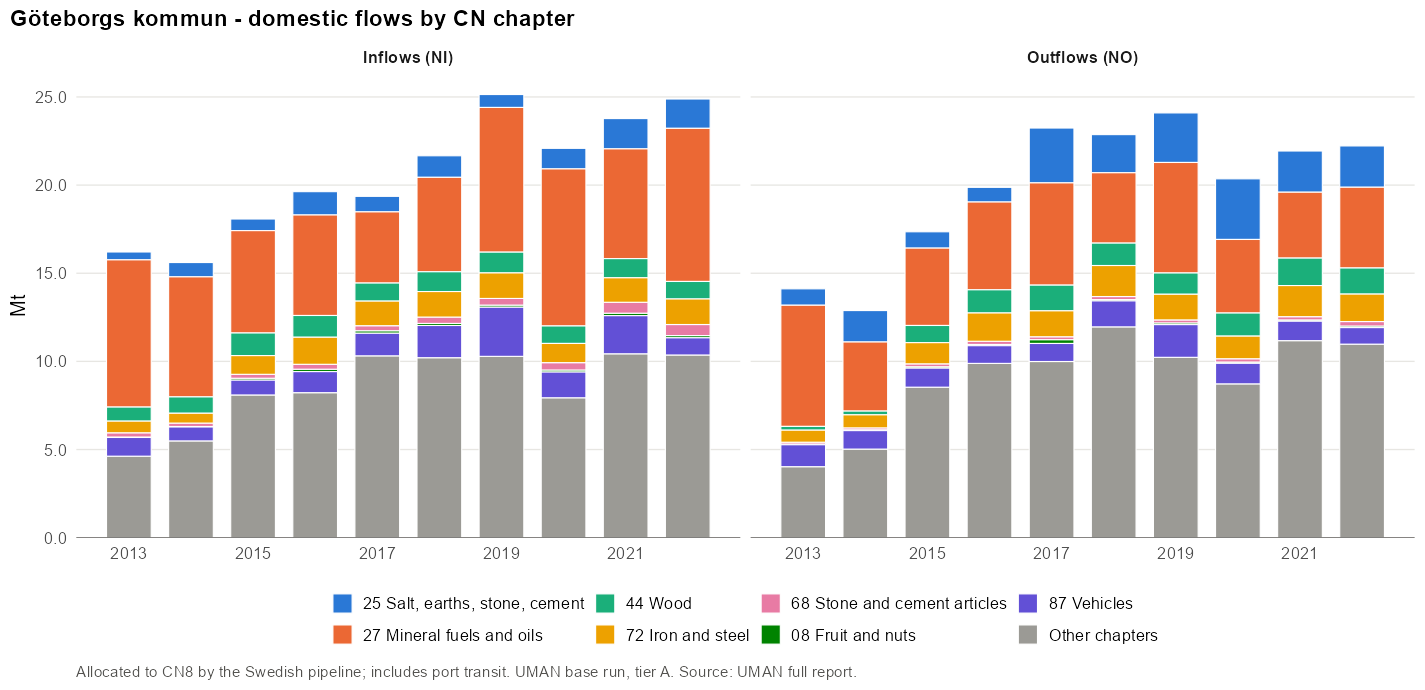
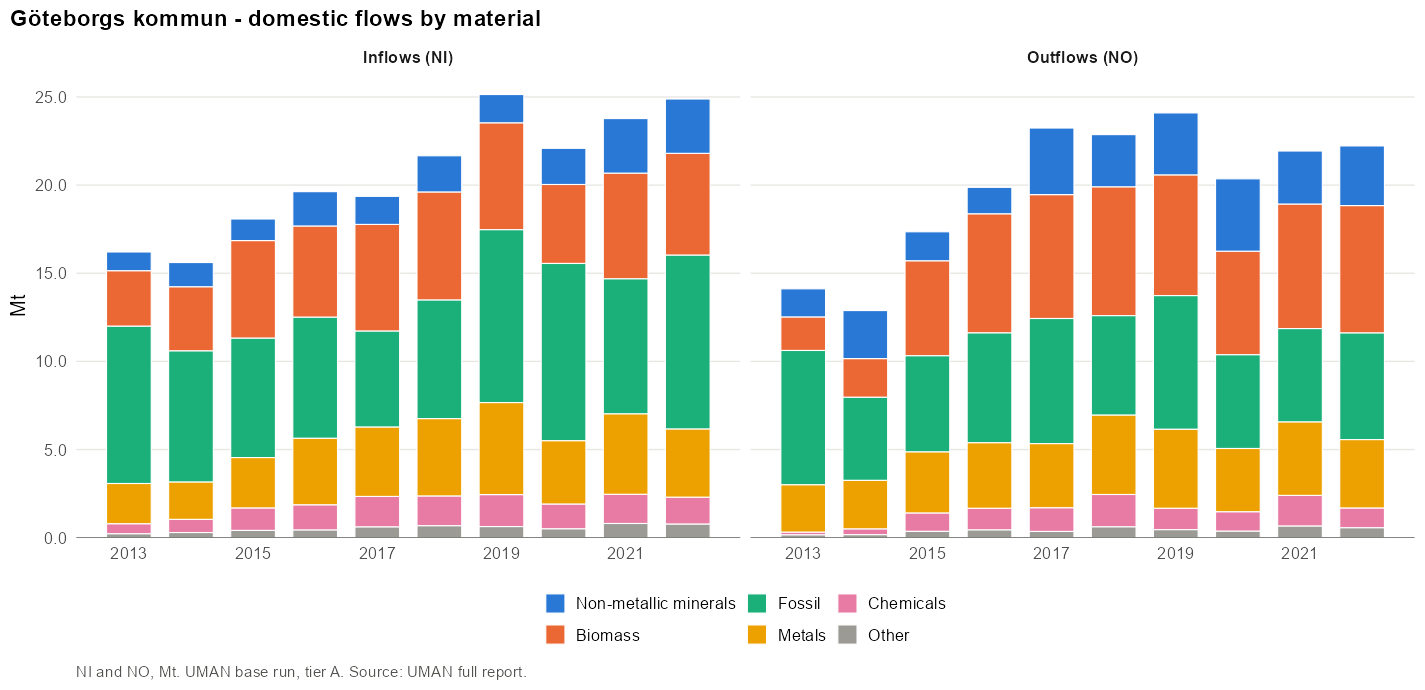
Inflows:
- Main CN4 codes (2019): 2709 Petroleum oils and oils obtained from bituminous minerals… (19%); 2710 Petroleum oils and oils obtained from bituminous minerals… (8%); 8708 Parts and accessories for tractors, motor vehicles for the… (4%); 8703 Motor cars and other motor vehicles principally designed… (4%); 2701 Coal; briquettes, ovoids and similar solid fuels… (3%).
- Main materials: Iron, steel and ferro-alloys (18%); Fuels (16%); Plastics and rubbers (10%).
Outflows:
- Main CN4 codes (2019): 2710 Petroleum oils and oils obtained from bituminous minerals… (23%); 2517 Pebbles, gravel, broken or crushed stone, for concrete… (11%); 4407 Wood sawn or chipped lengthwise, sliced or peeled, whether… (4%); 8708 Parts and accessories for tractors, motor vehicles for the… (3%); 4703 Chemical wood pulp, soda or sulphate (excl. dissolving… (2%).
- Main materials: Fuels (22%); Iron, steel and ferro-alloys (16%); Stone (12%).
Available resources
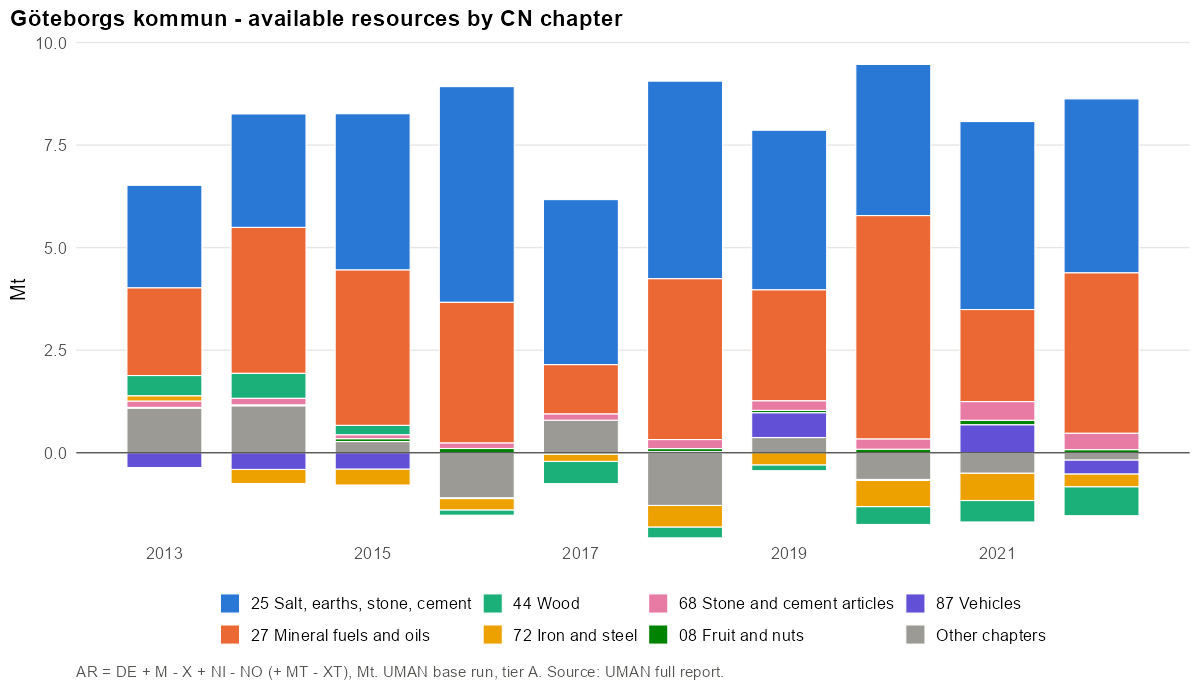
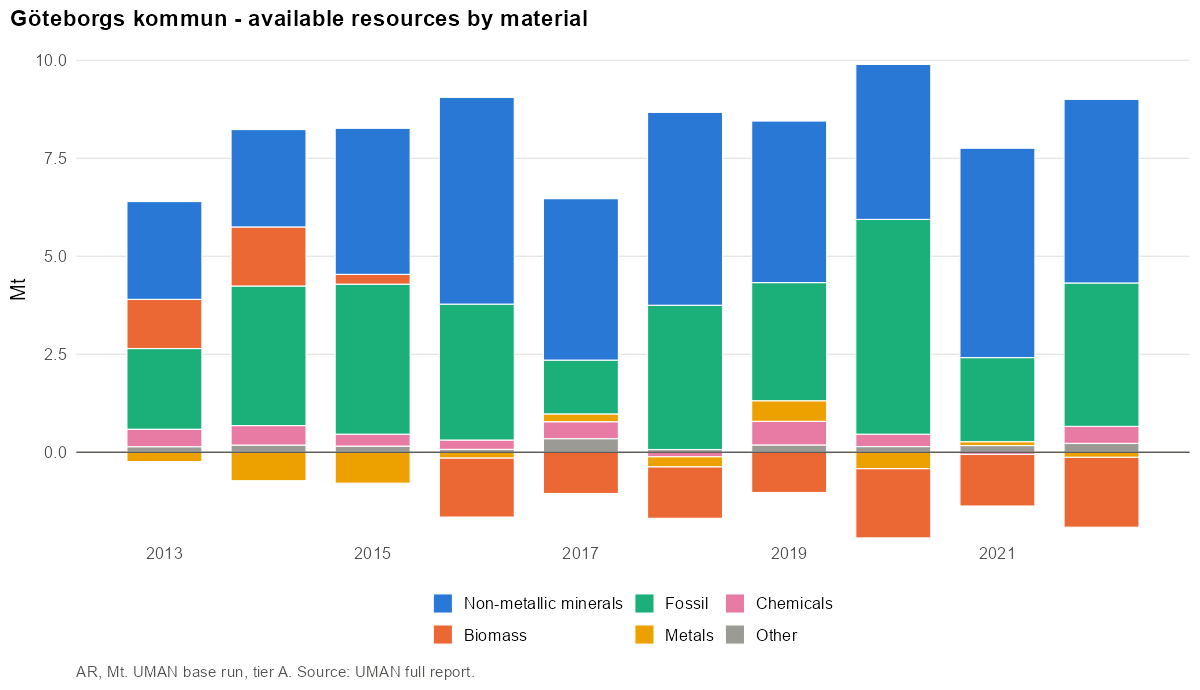
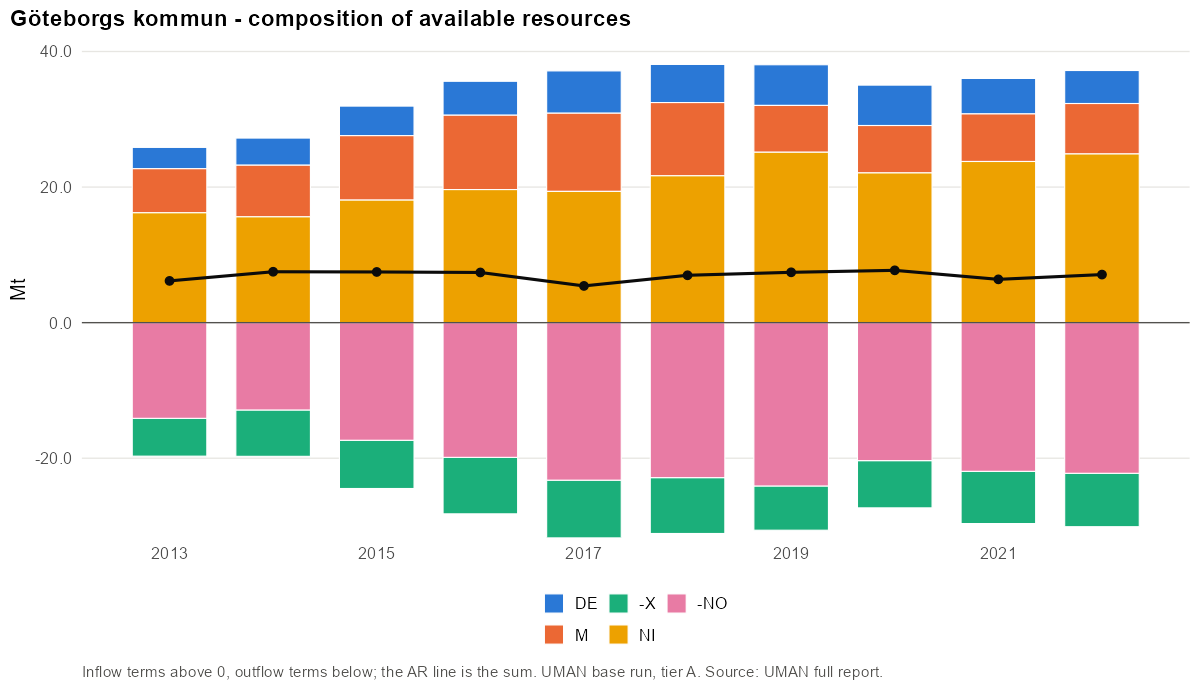
- Main CN4 codes (2019): 2709 Petroleum oils and oils obtained from bituminous minerals… (103%); 2517 Pebbles, gravel, broken or crushed stone, for concrete… (48%); 2701 Coal; briquettes, ovoids and similar solid fuels… (9%); 8708 Parts and accessories for tractors, motor vehicles for the… (7%); 2711 Petroleum gas and other gaseous hydrocarbons (6%).
- Main materials: Stone (49%); Plastics and rubbers (29%); Other fossil fuels (26%).
Industrial production
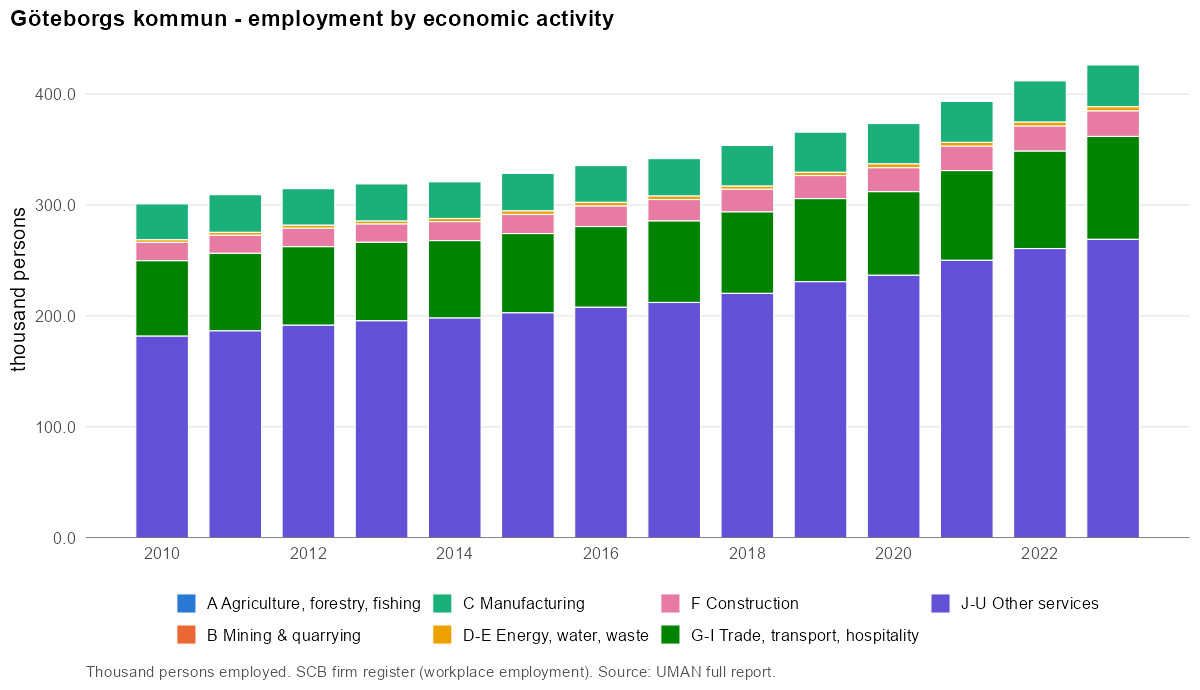
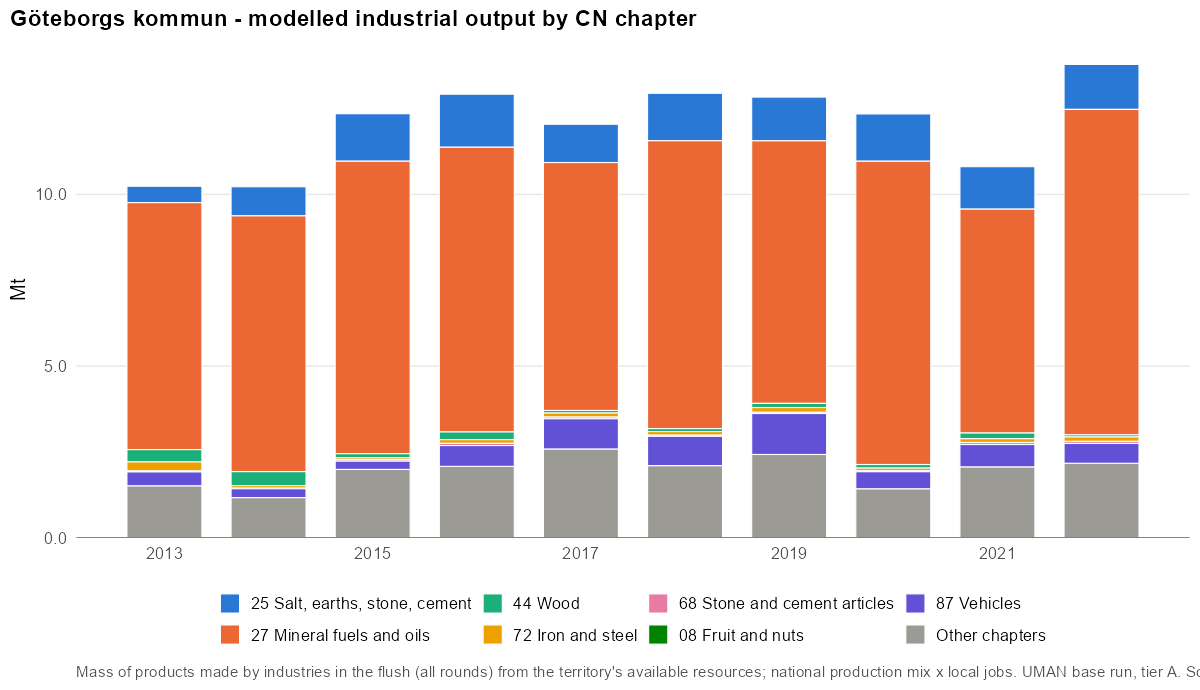
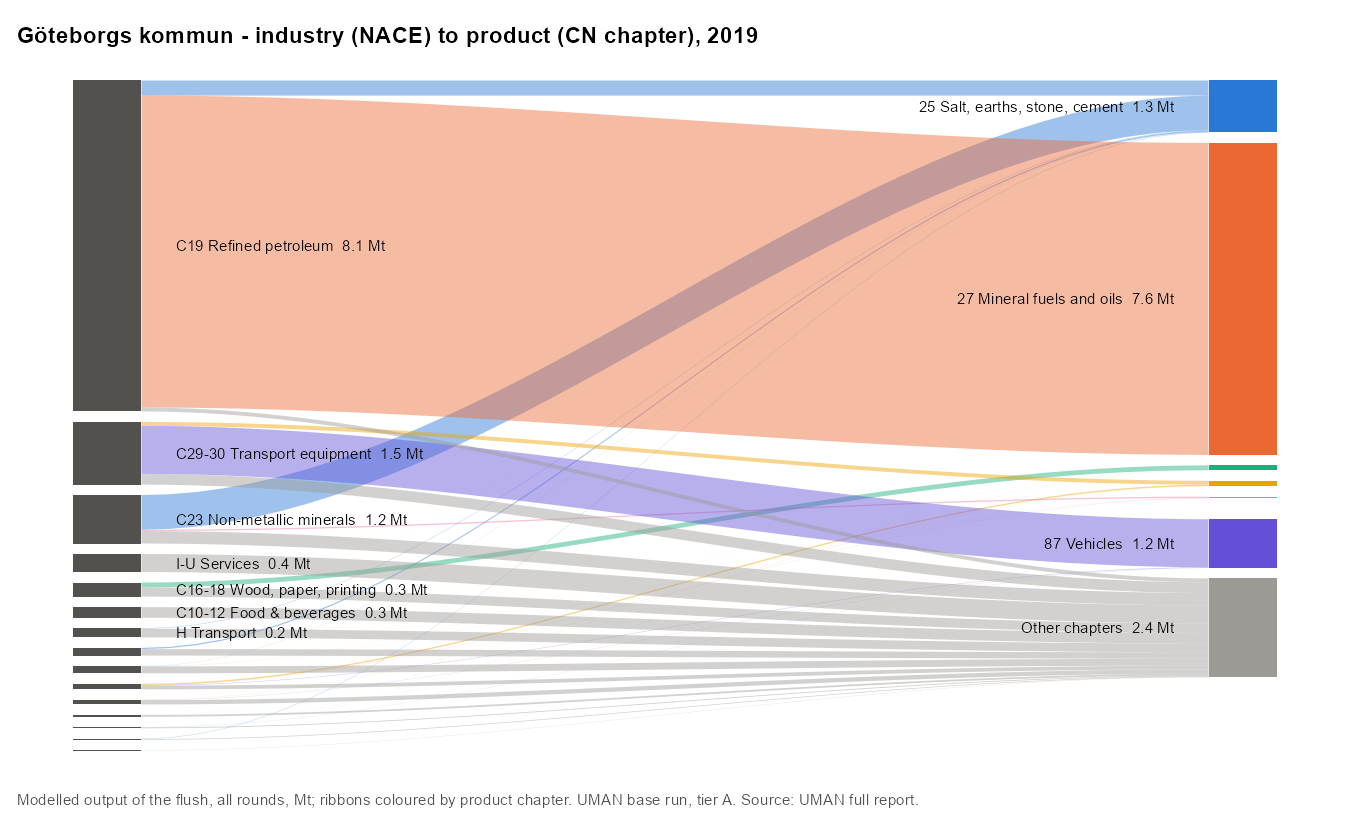
Largest employers (NACE divisions):
| NACE | Activity | Persons | Share |
|---|---|---|---|
| 85 | Education | 31 521 | 8.6% |
| 86 | Human health activities | 23 821 | 6.5% |
| 84 | Public administration and defence; compulsory social security | 22 393 | 6.1% |
| 29 | Manufacture of motor vehicles, trailers and semi-trailers | 20 710 | 5.7% |
| 47 | Retail trade, except of motor vehicles and motorcycles | 18 247 | 5.0% |
| 71 | Architectural and engineering activities; technical testing and analysis | 17 507 | 4.8% |
| 62 | Computer programming, consultancy and related activities | 16 501 | 4.5% |
| 46 | Wholesale trade, except of motor vehicles and motorcycles | 16 414 | 4.5% |
Product transformation
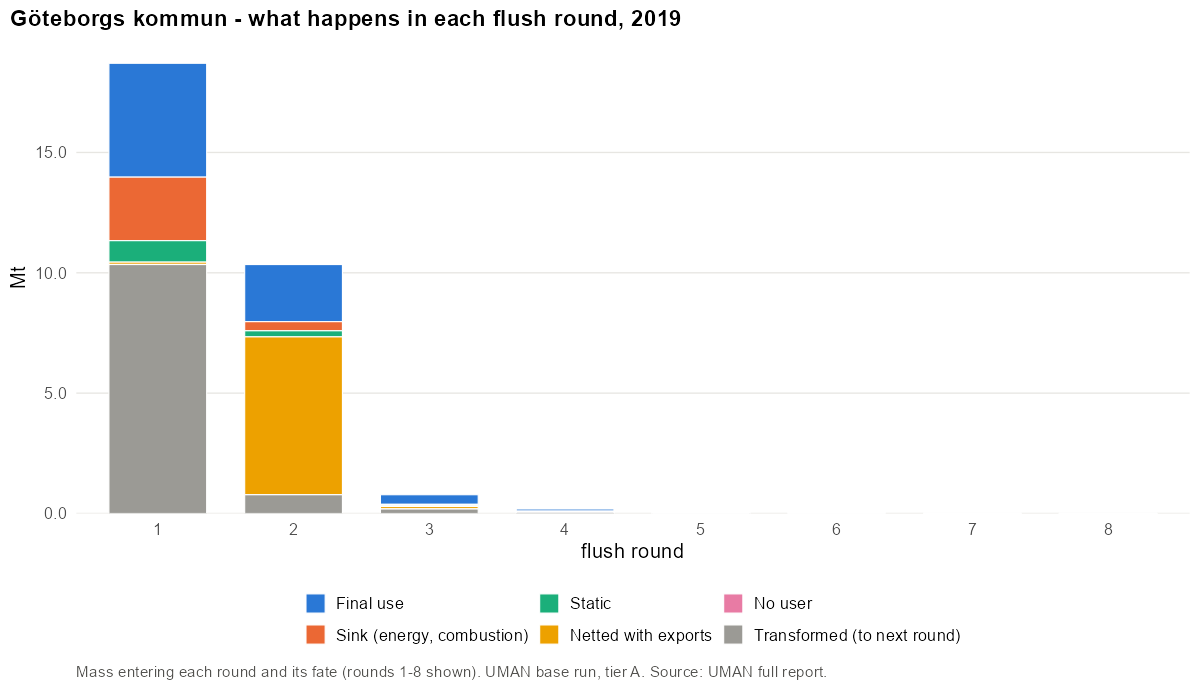
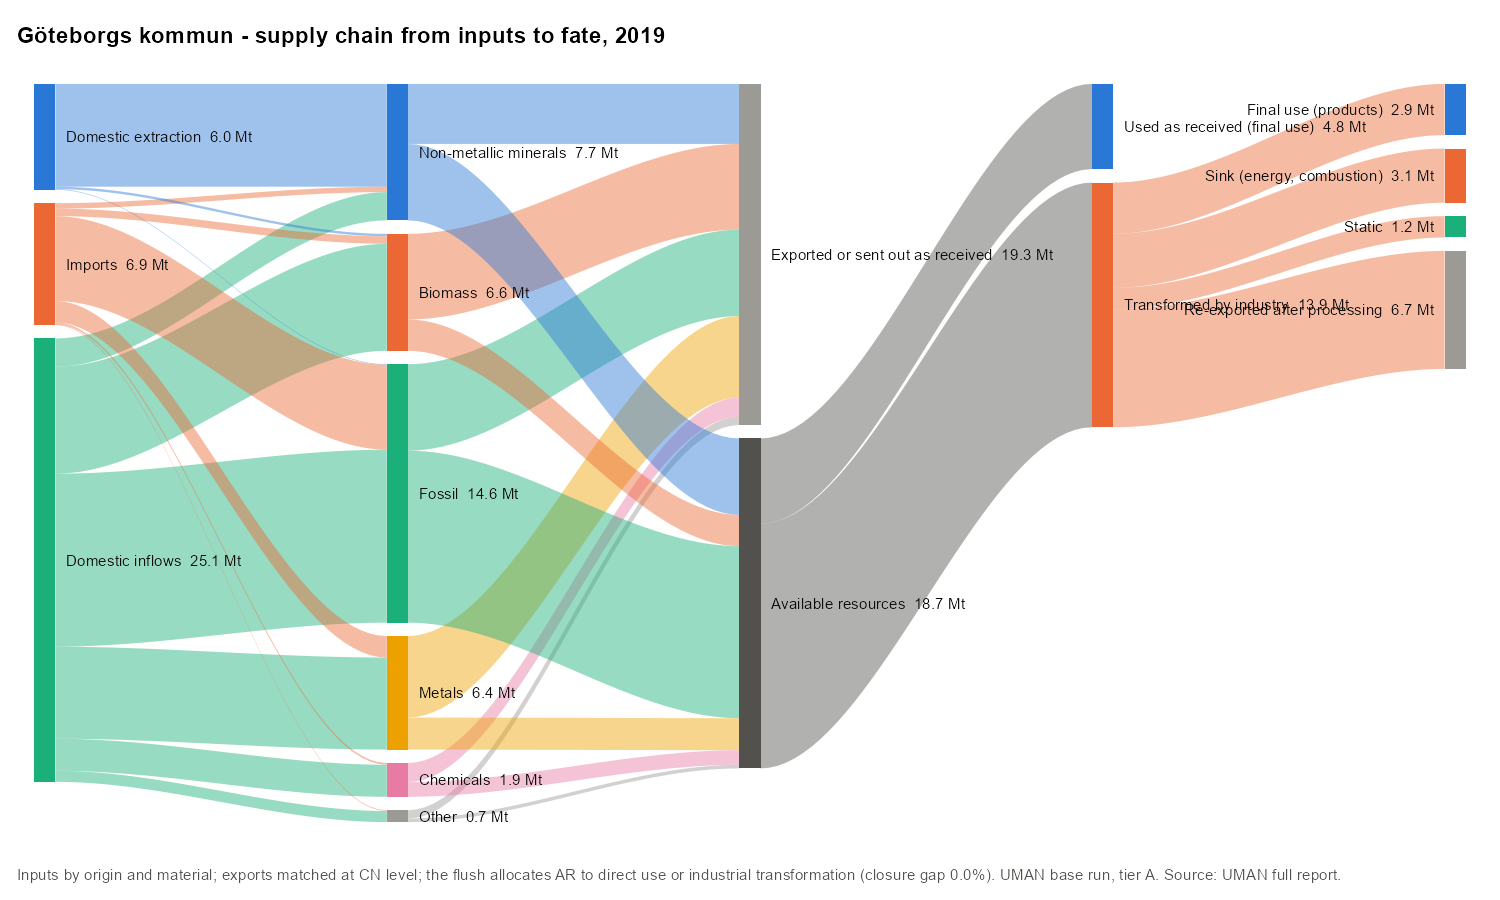
The flush needed 11 rounds. Round 1 handled 18.7 Mt; 55% of it was transformed into other products and re-entered round 2.
Domestic material consumption
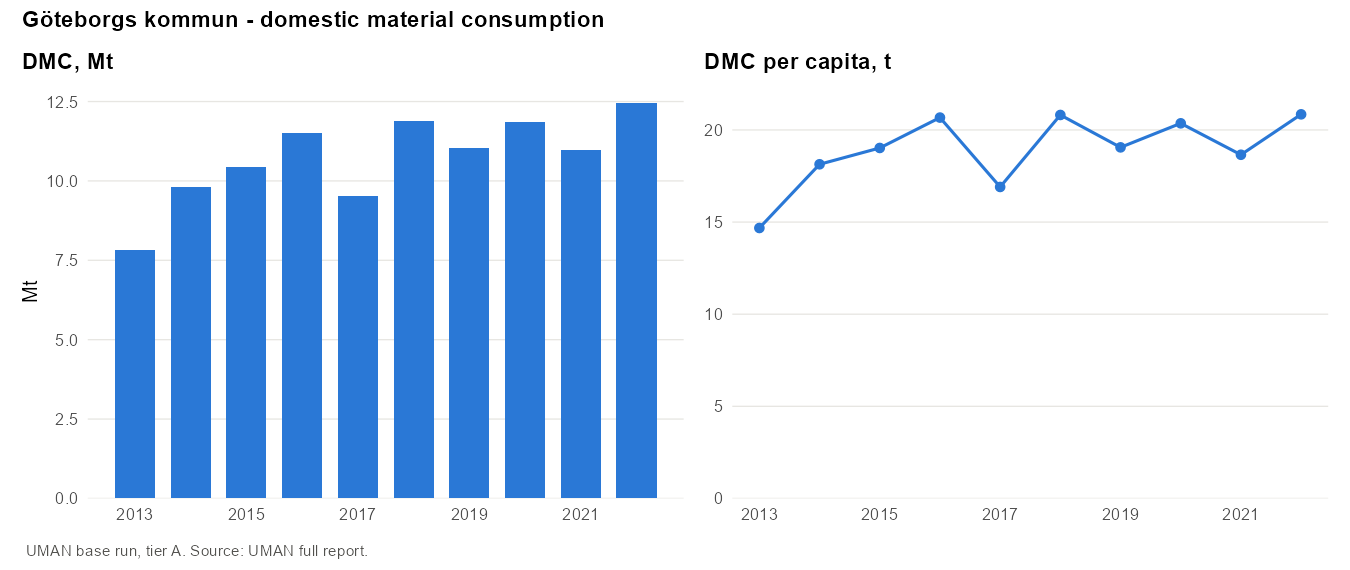
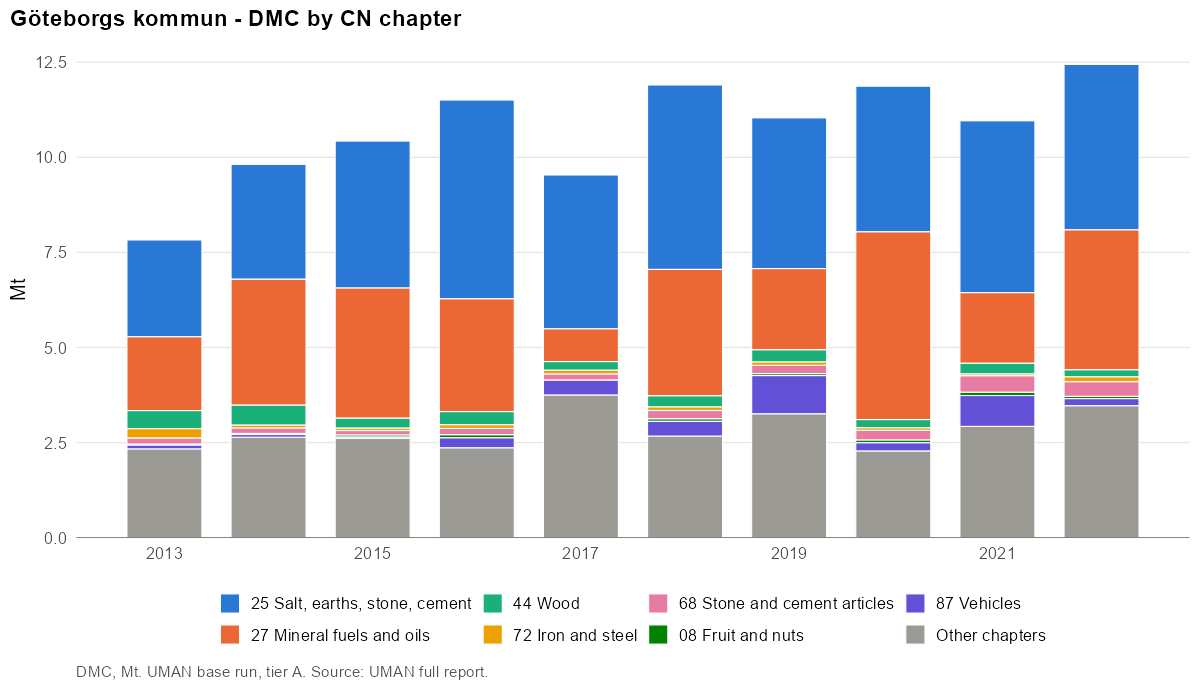
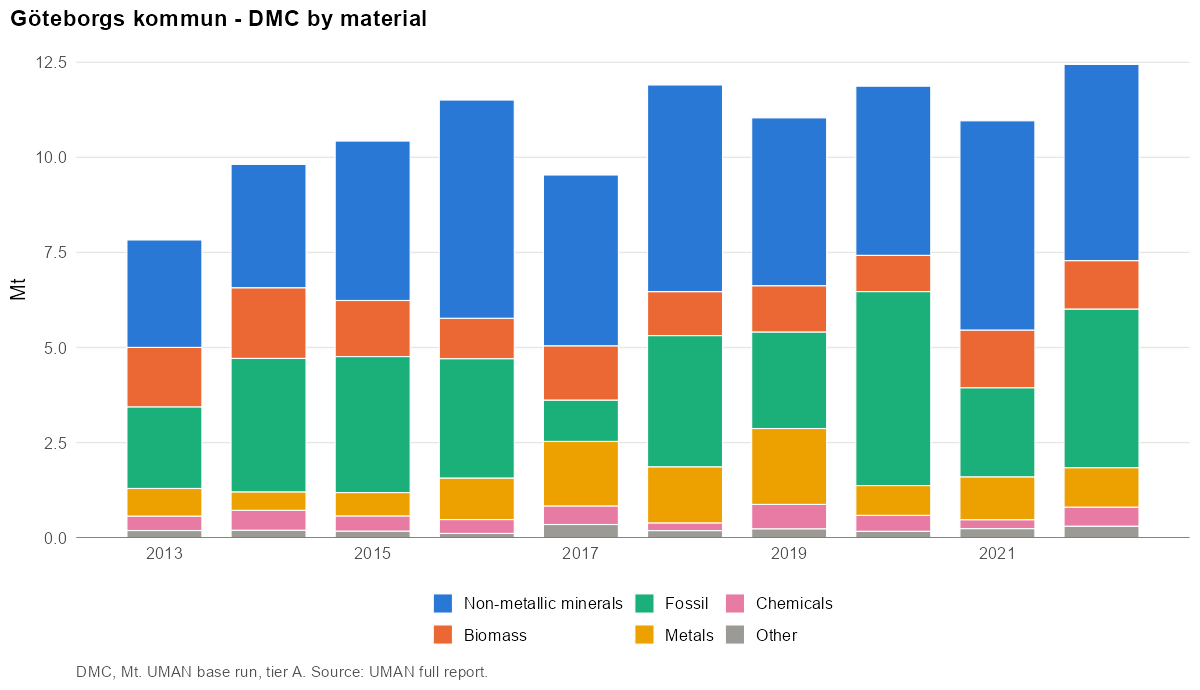
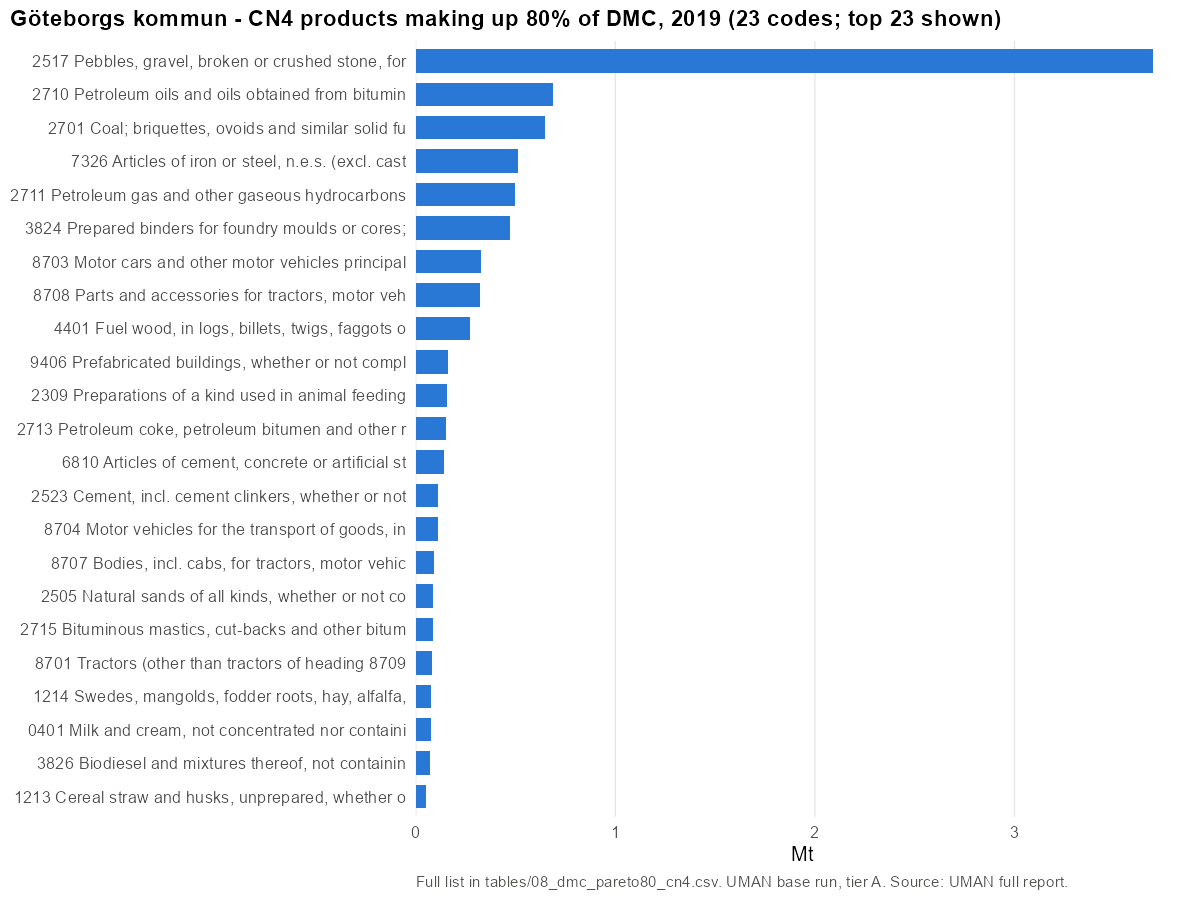
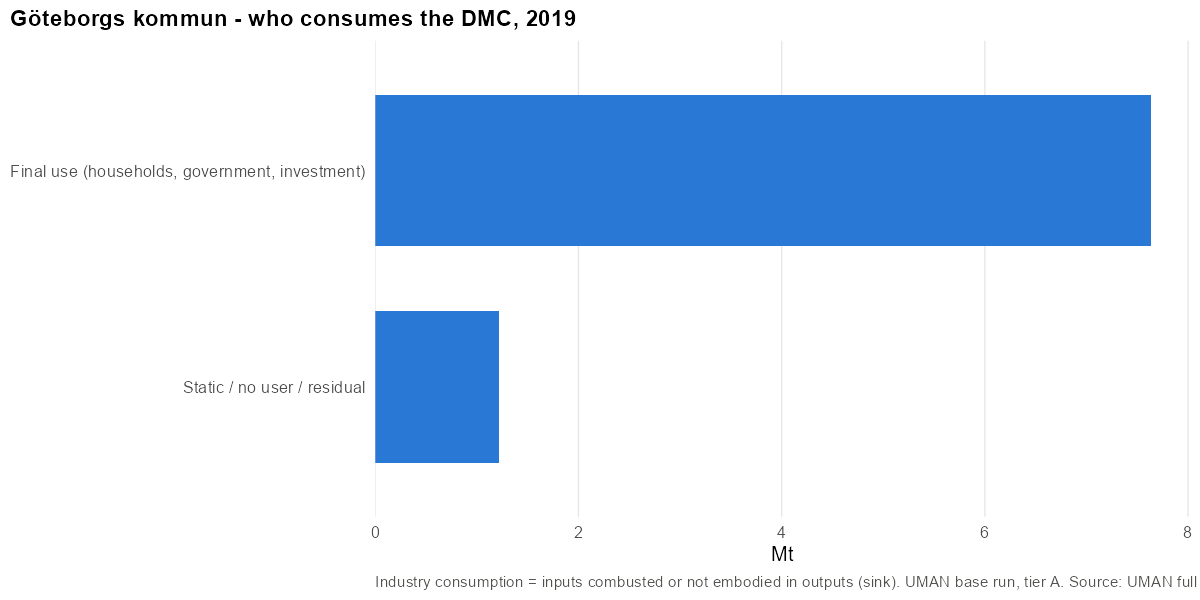
- Main CN4 codes (2019): 2517 Pebbles, gravel, broken or crushed stone, for concrete… (33%); 2710 Petroleum oils and oils obtained from bituminous minerals… (6%); 2701 Coal; briquettes, ovoids and similar solid fuels… (6%); 7326 Articles of iron or steel, n.e.s. (excl. cast articles) (5%); 2711 Petroleum gas and other gaseous hydrocarbons (5%).
- Main materials: Stone (35%); Iron, steel and ferro-alloys (17%); Fuels (16%).
23 CN4 codes make up 80% of DMC in 2019. Top 10:
| Rank | CN4 | Product | Mt | Share | Cumulative |
|---|---|---|---|---|---|
| 1 | 2517 | Pebbles, gravel, broken or crushed stone, for concrete… | 3.69 | 33.5% | 33% |
| 2 | 2710 | Petroleum oils and oils obtained from bituminous minerals… | 0.69 | 6.2% | 40% |
| 3 | 2701 | Coal; briquettes, ovoids and similar solid fuels… | 0.65 | 5.9% | 46% |
| 4 | 7326 | Articles of iron or steel, n.e.s. (excl. cast articles) | 0.51 | 4.6% | 50% |
| 5 | 2711 | Petroleum gas and other gaseous hydrocarbons | 0.50 | 4.5% | 55% |
| 6 | 3824 | Prepared binders for foundry moulds or cores; chemical… | 0.47 | 4.3% | 59% |
| 7 | 8703 | Motor cars and other motor vehicles principally designed… | 0.33 | 2.9% | 62% |
| 8 | 8708 | Parts and accessories for tractors, motor vehicles for the… | 0.32 | 2.9% | 65% |
| 9 | 4401 | Fuel wood, in logs, billets, twigs, faggots or similar… | 0.27 | 2.4% | 67% |
| 10 | 9406 | Prefabricated buildings, whether or not complete or already… | 0.16 | 1.5% | 69% |
Metrics
| Year | DMC/cap | AR/cap | DE/cap | Import dep. | Intl import dep. | Self-suff. | Export int. |
|---|---|---|---|---|---|---|---|
| 2013 | 14.7 | 11.5 | 5.9 | 88% | 67% | 40% | 76% |
| 2014 | 18.1 | 13.9 | 7.4 | 85% | 66% | 41% | 72% |
| 2015 | 19.0 | 13.6 | 8.0 | 86% | 69% | 42% | 77% |
| 2016 | 20.7 | 13.3 | 9.0 | 86% | 69% | 44% | 79% |
| 2017 | 16.9 | 9.6 | 11.1 | 83% | 65% | 65% | 85% |
| 2018 | 20.8 | 12.2 | 9.8 | 85% | 66% | 47% | 82% |
| 2019 | 19.1 | 12.8 | 10.4 | 84% | 54% | 54% | 80% |
| 2020 | 20.4 | 13.2 | 10.2 | 83% | 54% | 50% | 78% |
| 2021 | 18.7 | 10.9 | 8.9 | 85% | 57% | 48% | 82% |
| 2022 | 20.8 | 11.9 | 8.2 | 87% | 60% | 39% | 81% |
Rest of Sweden (SE - SE2)
Sweden · rest-of · code SE-SE2 · rest (SE - SE2) · years 2013–2022
Findings
- The rest of Sweden (Östra Sverige and Norra Sverige: 5.86 million people) consumes 134.8 Mt or 23.0 t/cap in 2019, more than Södra Sverige (20.5).
- It holds the mining and forest north: iron ore is 21% of its DE and 37% of its exports, and roundwood 28% of DE. Biomass is 37% of DMC (fuel wood 17%), against 26% in Södra Sverige.
- Self-sufficiency is about 1: DE is 23.9 t/cap. International import dependency is 28%, the same as Sweden's.
- Caveat: 1.4 Mt of negative DE cells, because the job-based downscaling gives Södra Sverige more extraction than Sweden for some products. Negative DMC cells are 1.5% of DMC.
Overview
| 2013 | 2019 | 2022 | |
|---|---|---|---|
| Population | 5 476 688 | 5 860 227 | 5 964 699 |
| DE (Mt) | 121.8 | 140.3 | 137.4 |
| Imports M (Mt) | 45.1 | 53.5 | 48.7 |
| Exports X (Mt) | 57.7 | 59.9 | 59.5 |
| Domestic in NI (Mt) | – | – | – |
| Domestic out NO (Mt) | – | – | – |
| AR (Mt) | 109.5 | 135.0 | 124.6 |
| DMC (Mt) | 110.4 | 134.8 | 123.4 |
| DMC (t/cap) | 20.2 | 23.0 | 20.7 |
| Unbalanced (% of gross AR) | 0.7% | -0.1% | -0.8% |
Domestic extraction
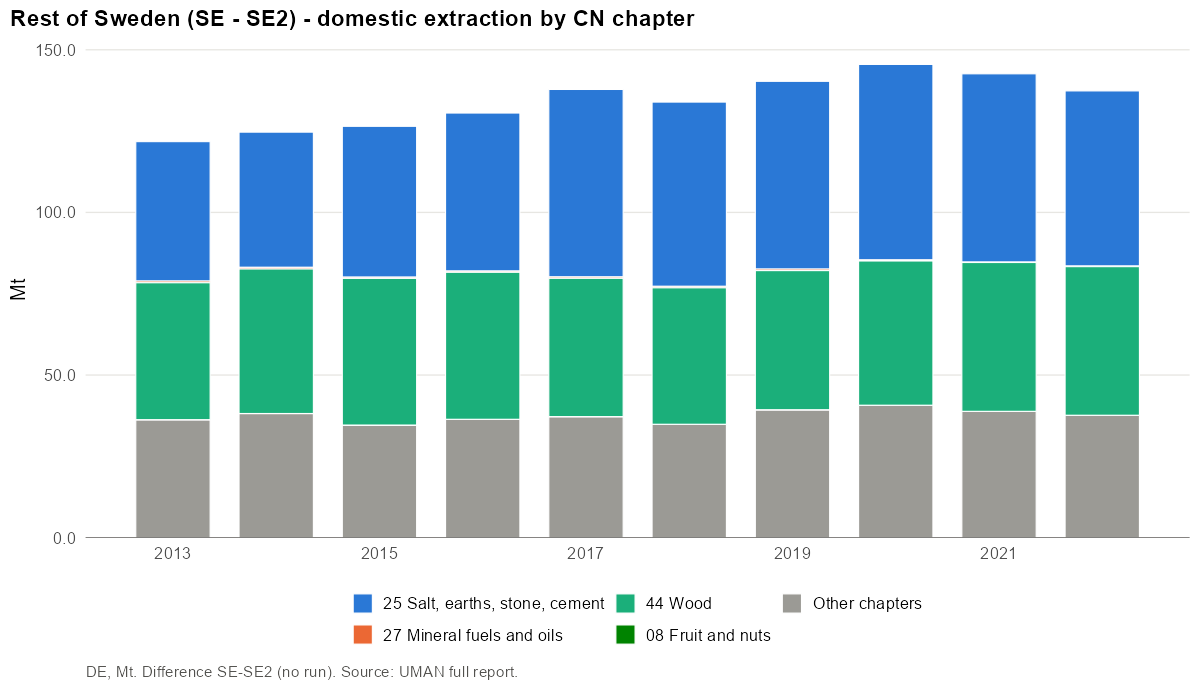
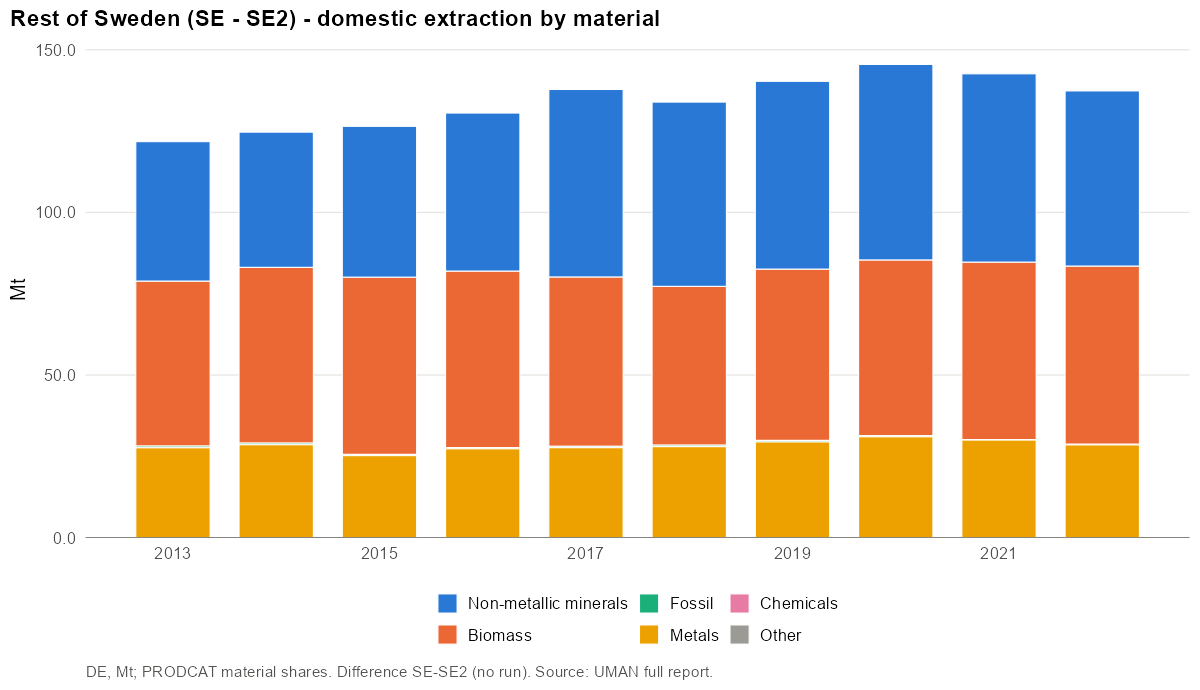
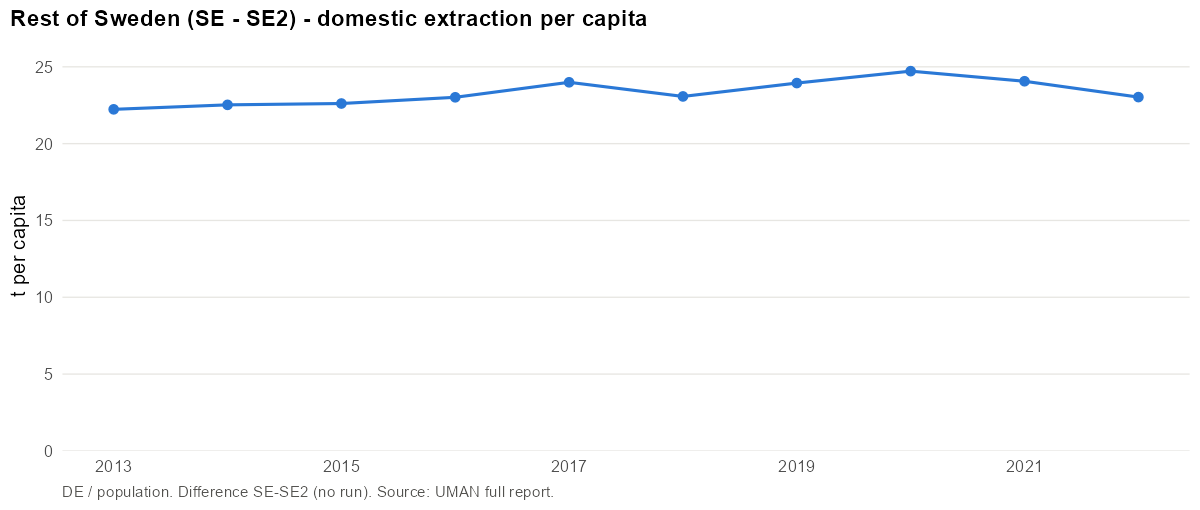
- Main CN4 codes (2019): 2517 Pebbles, gravel, broken or crushed stone, for concrete… (41%); 4403 Wood in the rough, whether or not stripped of bark or… (28%); 2601 Iron ores and concentrates, incl. roasted iron pyrites (21%); 4401 Fuel wood, in logs, billets, twigs, faggots or similar… (2%); 1214 Swedes, mangolds, fodder roots, hay, alfalfa, clover… (2%).
- Main materials: Stone (41%); Wood and wood fuels (30%); Iron, steel and ferro-alloys (21%).
International trade
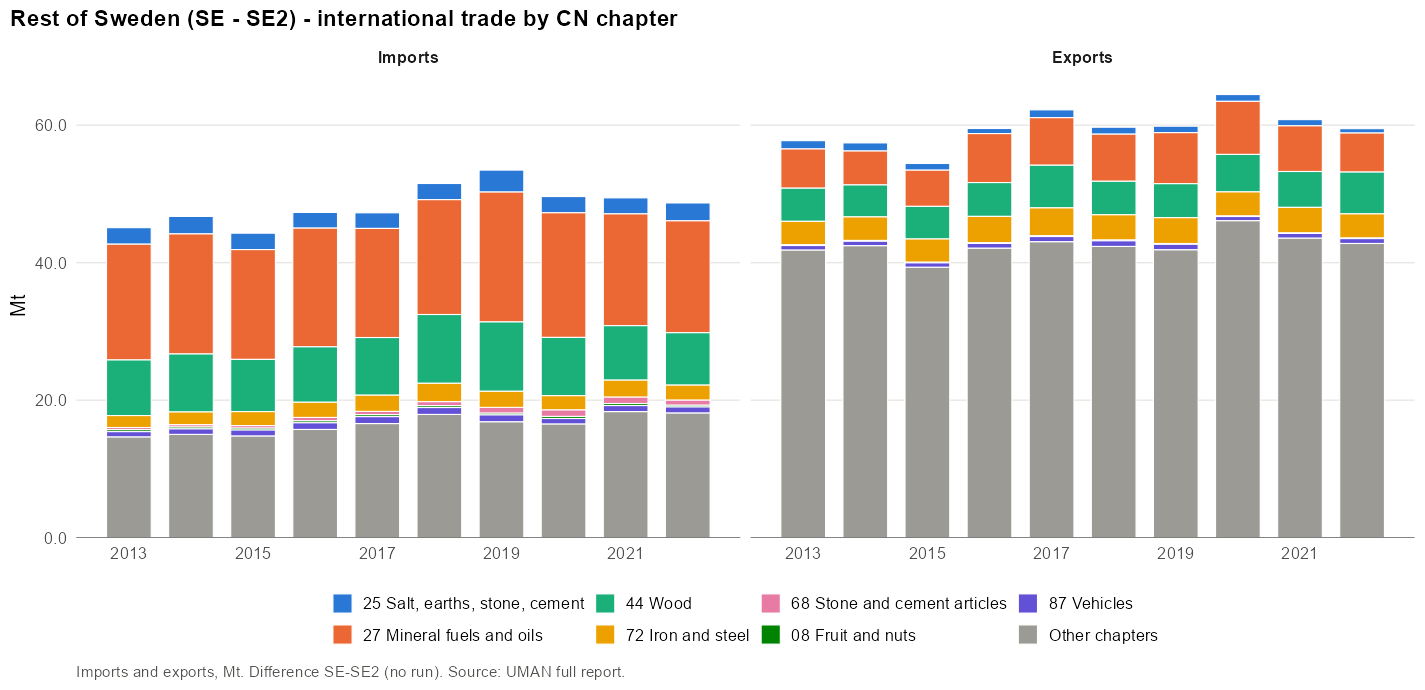
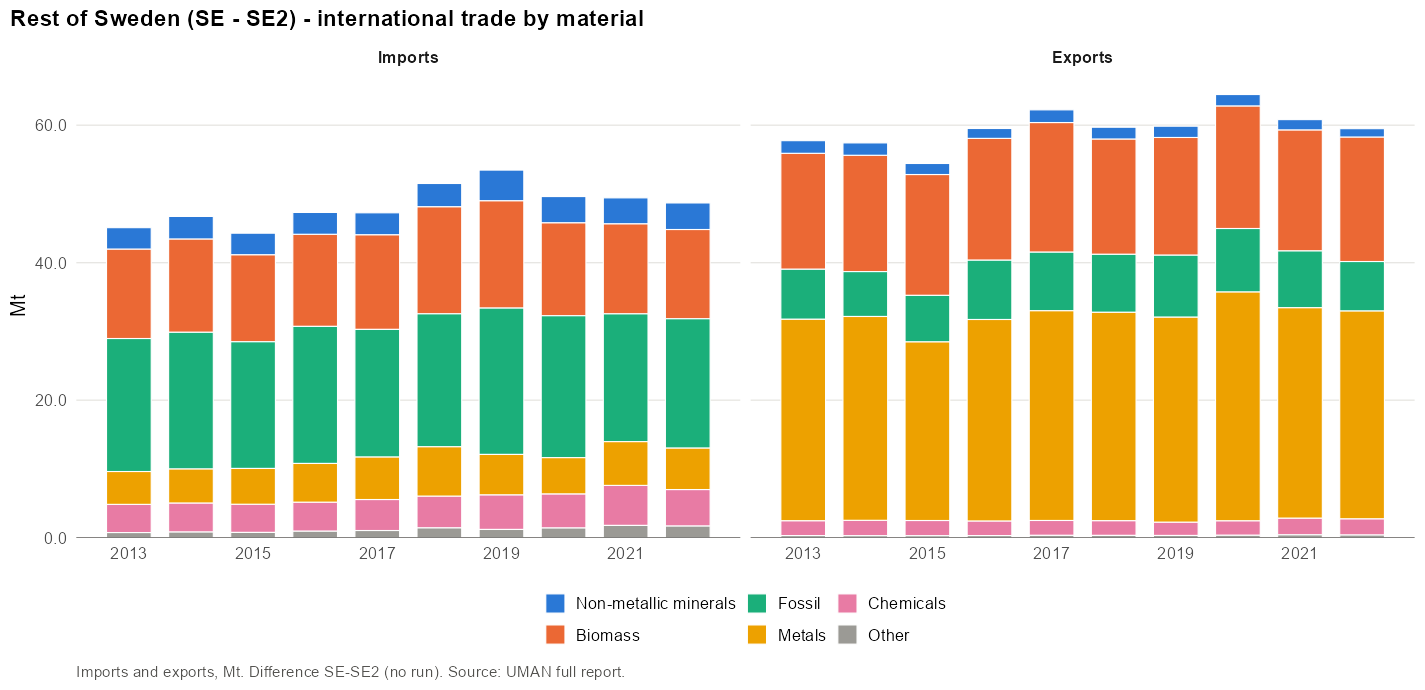
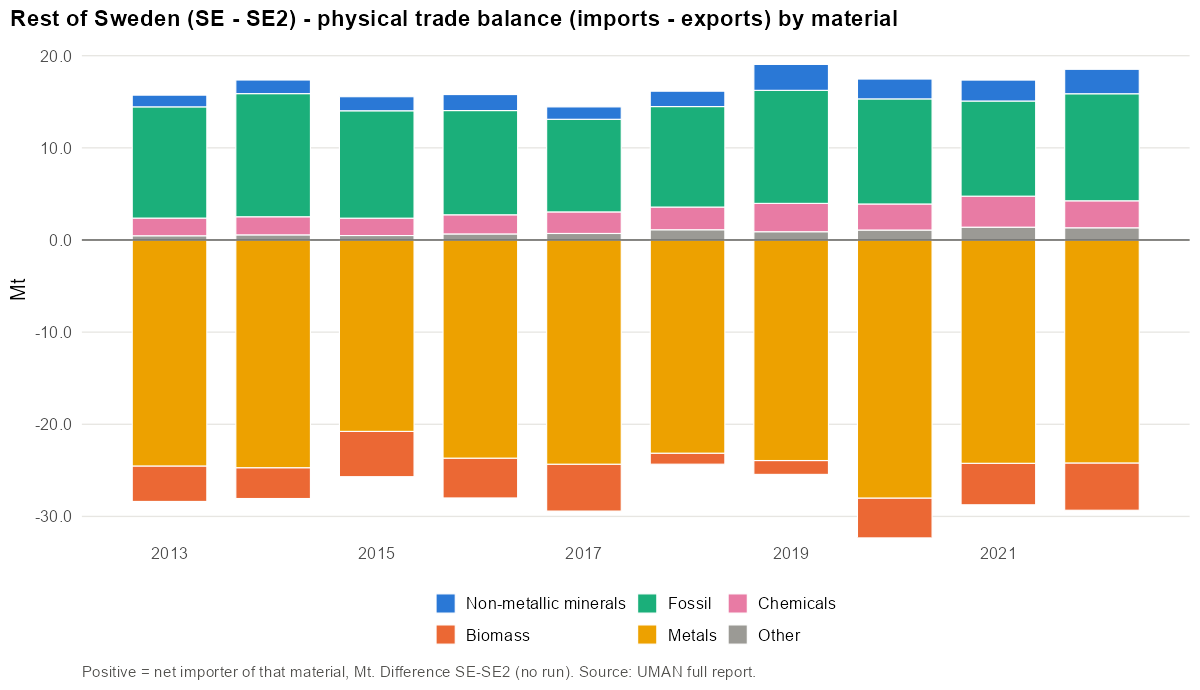
Imports:
- Main CN4 codes (2019): 2709 Petroleum oils and oils obtained from bituminous minerals… (14%); 2710 Petroleum oils and oils obtained from bituminous minerals… (14%); 4403 Wood in the rough, whether or not stripped of bark or… (12%); 4401 Fuel wood, in logs, billets, twigs, faggots or similar… (6%); 3824 Prepared binders for foundry moulds or cores; chemical… (4%).
- Main materials: Fuels (21%); Wood and wood fuels (20%); Iron, steel and ferro-alloys (9%).
Exports:
- Main CN4 codes (2019): 2601 Iron ores and concentrates, incl. roasted iron pyrites (37%); 2710 Petroleum oils and oils obtained from bituminous minerals… (10%); 4407 Wood sawn or chipped lengthwise, sliced or peeled, whether… (7%); 4810 Paper and paperboard, coated on one or both sides with… (5%); 4804 Uncoated kraft paper and paperboard, in rolls of a width >… (4%).
- Main materials: Iron, steel and ferro-alloys (47%); Paper and board (13%); Wood and wood fuels (11%).
Domestic movement of goods
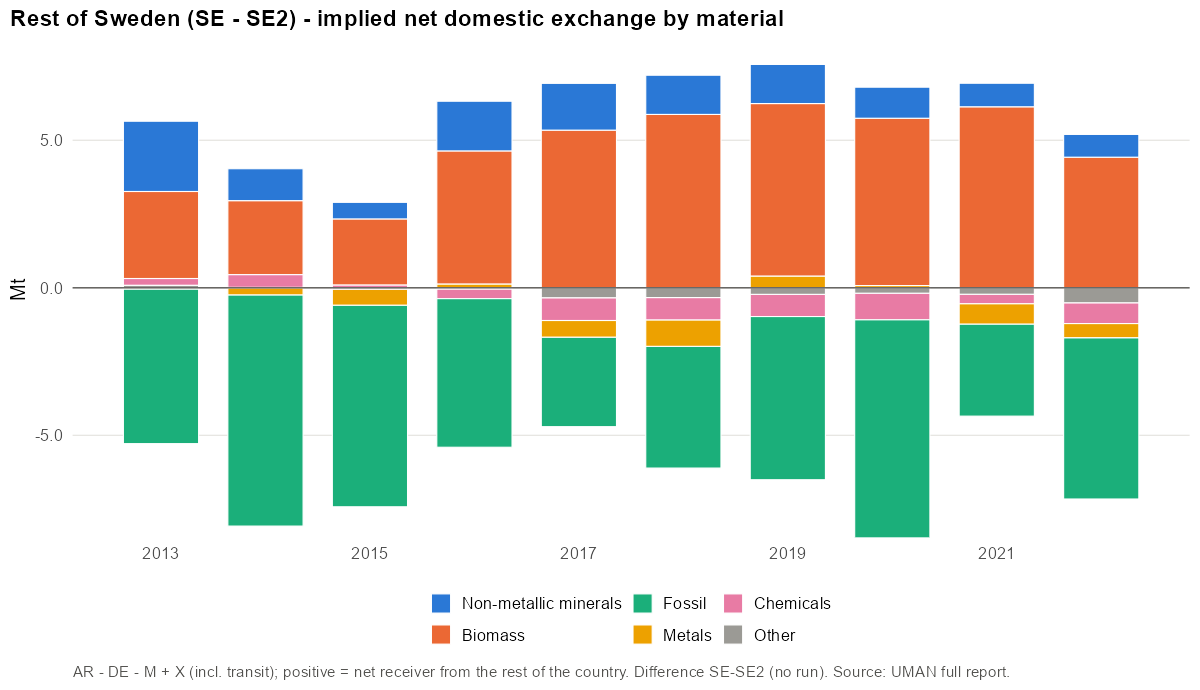
Gross domestic flows of a rest-of territory cannot be obtained by difference; only the implied net exchange is shown.
Available resources
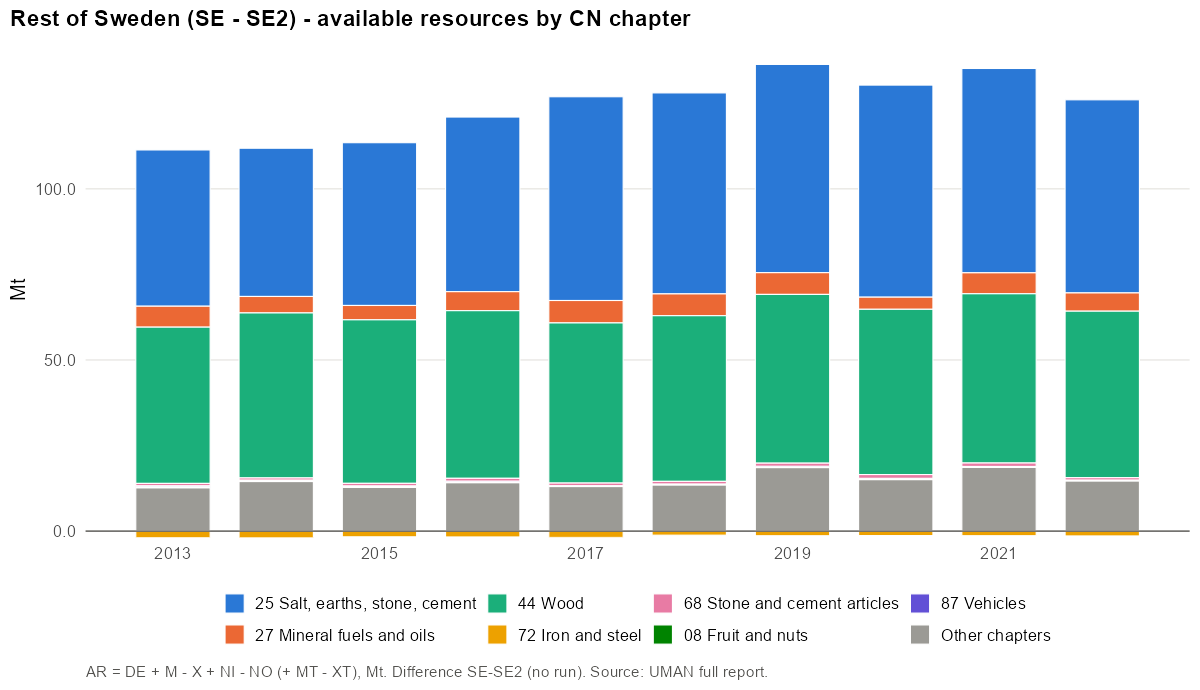
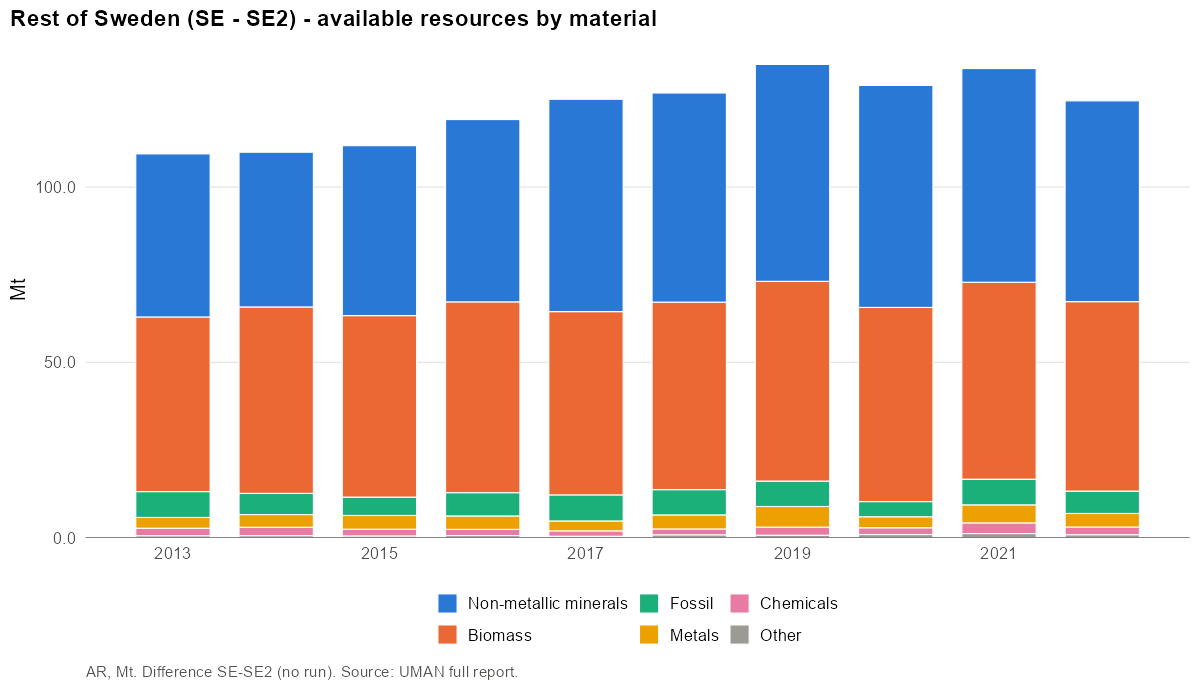
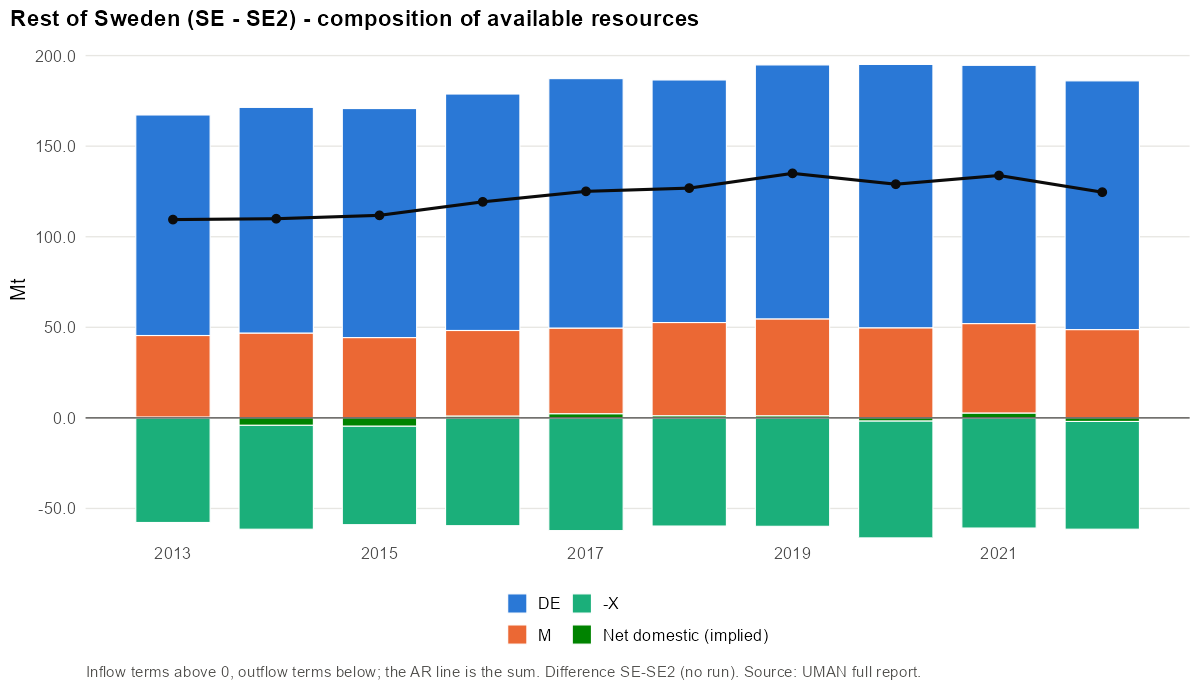
- Main CN4 codes (2019): 2517 Pebbles, gravel, broken or crushed stone, for concrete… (43%); 4403 Wood in the rough, whether or not stripped of bark or… (34%); 2601 Iron ores and concentrates, incl. roasted iron pyrites (5%); 4401 Fuel wood, in logs, billets, twigs, faggots or similar… (5%); 1214 Swedes, mangolds, fodder roots, hay, alfalfa, clover… (2%).
- Main materials: Stone (44%); Wood and wood fuels (36%); Agriculture biomass (8%).
Industrial production
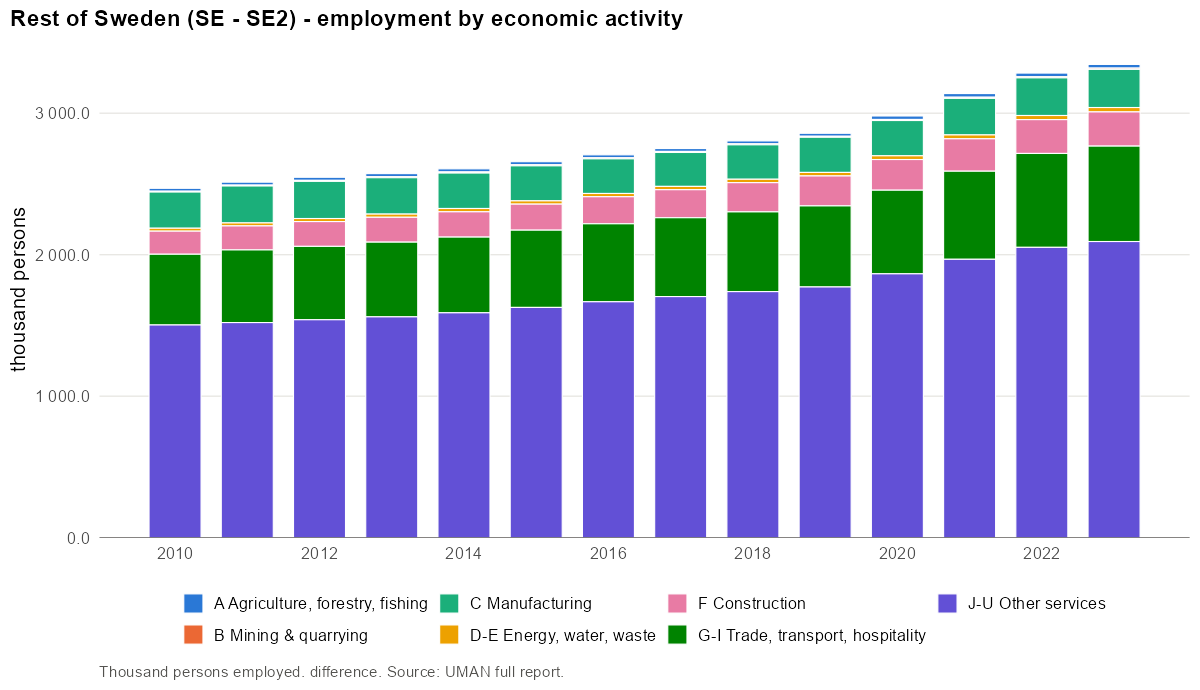
Production and the NACE-CN Sankey require a run; not available for a rest-of territory.
Largest employers (NACE divisions):
| NACE | Activity | Persons | Share |
|---|---|---|---|
| 85 | Education | 298 731 | 10.5% |
| 86 | Human health activities | 179 132 | 6.3% |
| 84 | Public administration and defence; compulsory social security | 177 510 | 6.2% |
| 88 | Social work activities without accommodation | 170 373 | 6.0% |
| 47 | Retail trade, except of motor vehicles and motorcycles | 163 156 | 5.7% |
| 87 | Residential care activities | 139 293 | 4.9% |
| 43 | Specialised construction activities | 137 316 | 4.8% |
| 46 | Wholesale trade, except of motor vehicles and motorcycles | 114 724 | 4.0% |
Product transformation
Product transformation requires a run; not available for a rest-of territory.
Domestic material consumption
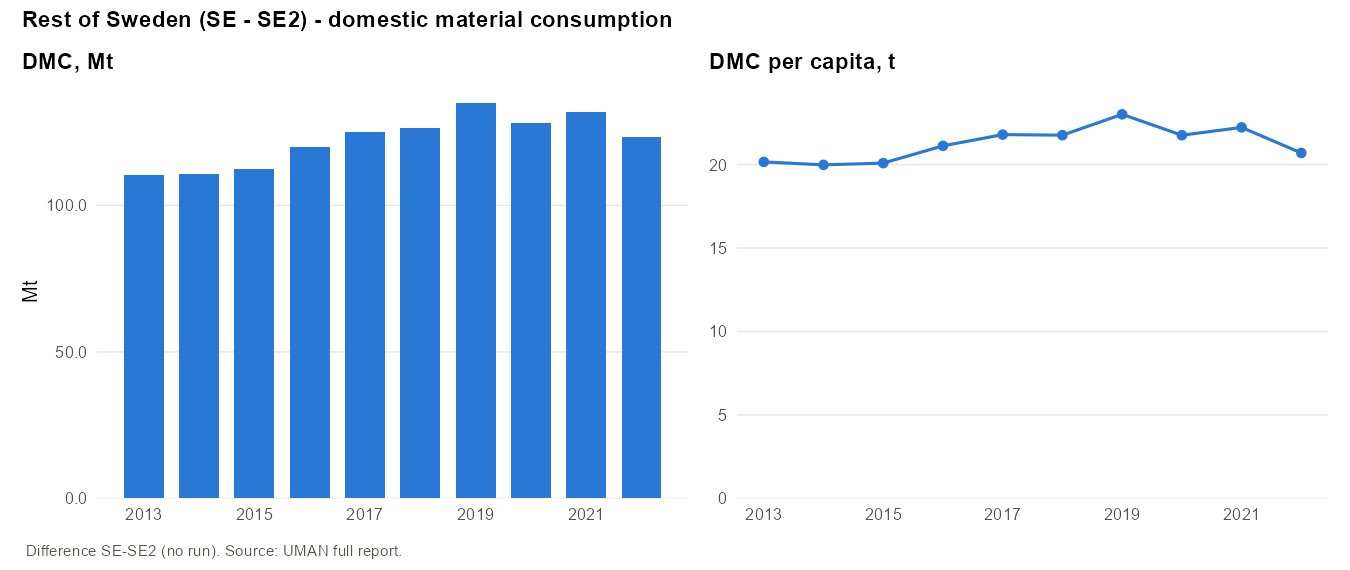
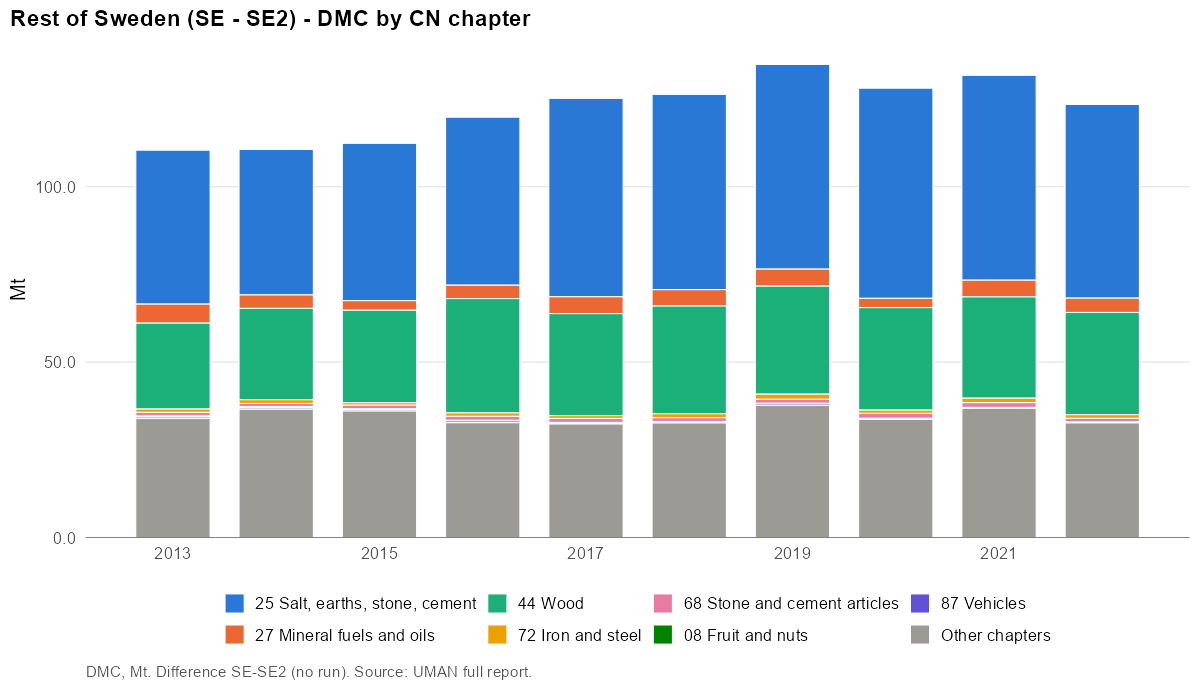
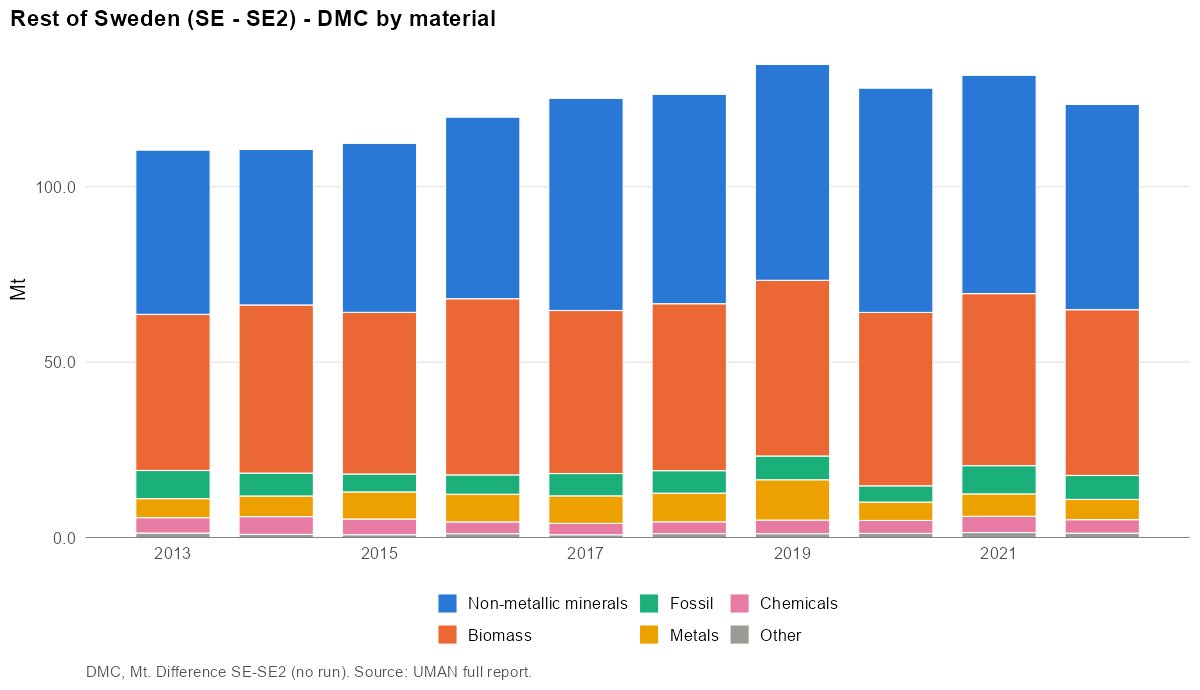
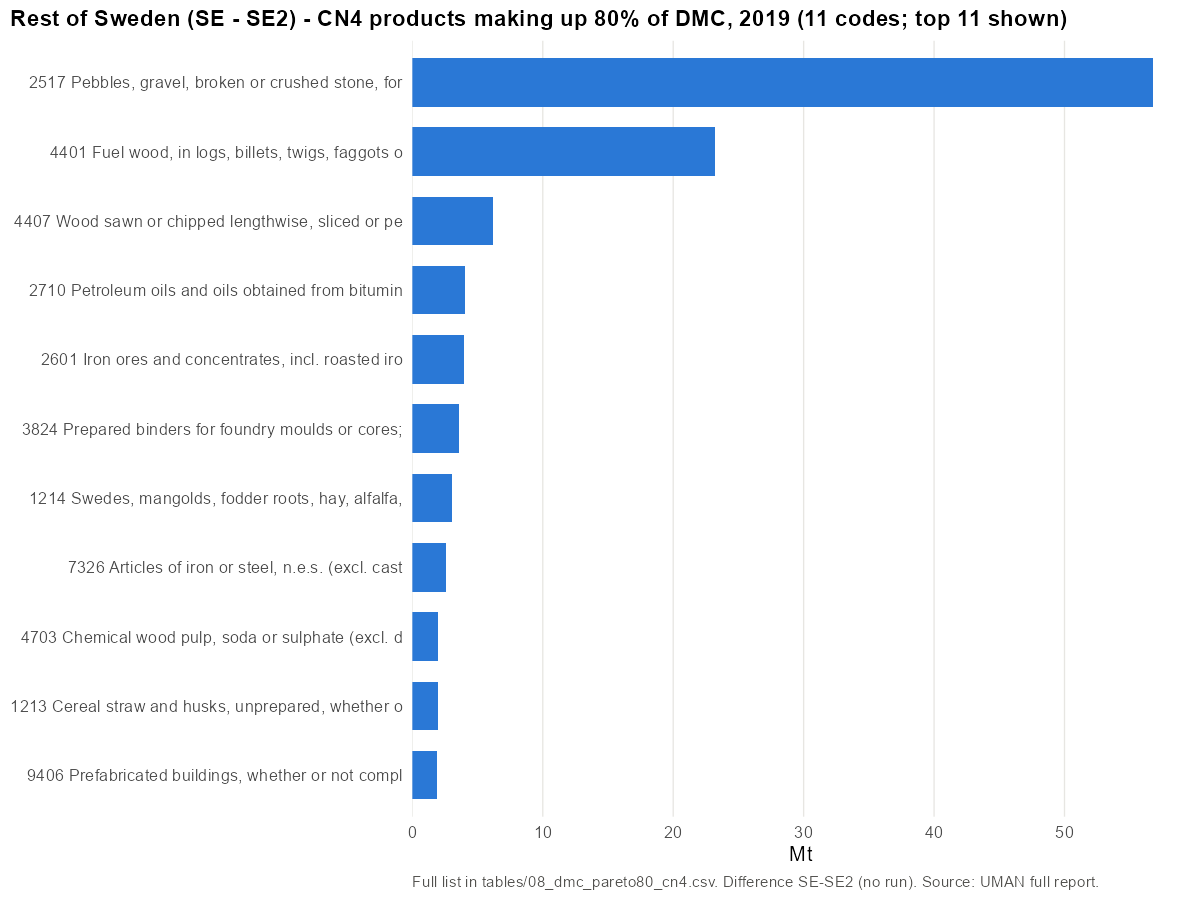
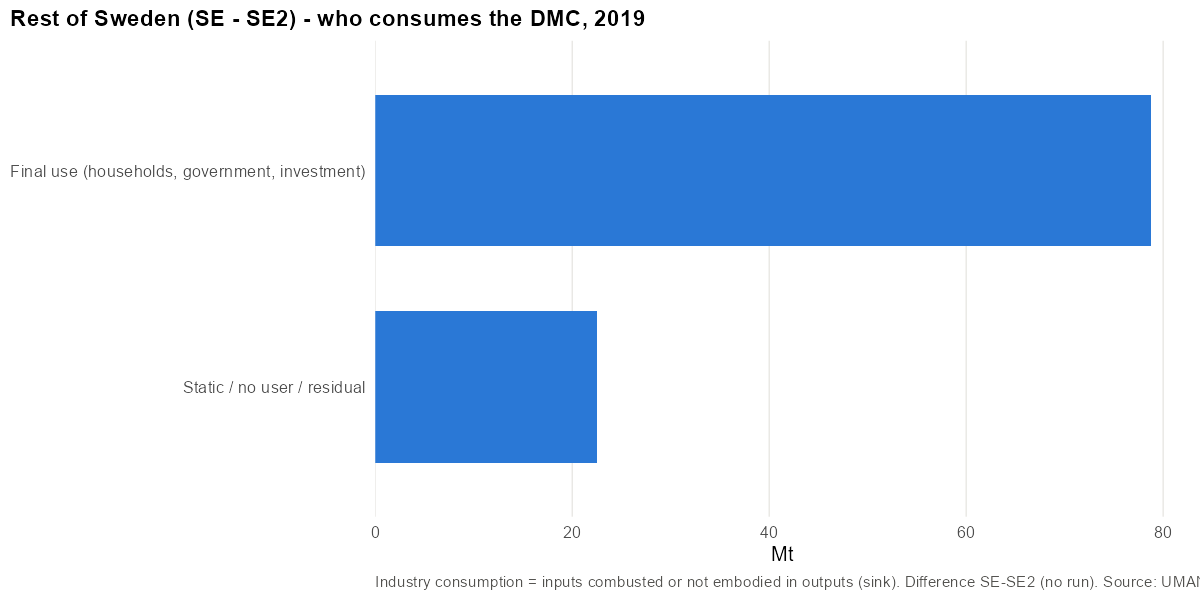
- Main CN4 codes (2019): 2517 Pebbles, gravel, broken or crushed stone, for concrete… (42%); 4401 Fuel wood, in logs, billets, twigs, faggots or similar… (17%); 4407 Wood sawn or chipped lengthwise, sliced or peeled, whether… (5%); 2710 Petroleum oils and oils obtained from bituminous minerals… (3%); 2601 Iron ores and concentrates, incl. roasted iron pyrites (3%).
- Main materials: Stone (43%); Wood and wood fuels (25%); Iron, steel and ferro-alloys (8%).
11 CN4 codes make up 80% of DMC in 2019. Top 10:
| Rank | CN4 | Product | Mt | Share | Cumulative |
|---|---|---|---|---|---|
| 1 | 2517 | Pebbles, gravel, broken or crushed stone, for concrete… | 56.75 | 42.1% | 42% |
| 2 | 4401 | Fuel wood, in logs, billets, twigs, faggots or similar… | 23.18 | 17.2% | 59% |
| 3 | 4407 | Wood sawn or chipped lengthwise, sliced or peeled, whether… | 6.16 | 4.6% | 64% |
| 4 | 2710 | Petroleum oils and oils obtained from bituminous minerals… | 4.03 | 3.0% | 67% |
| 5 | 2601 | Iron ores and concentrates, incl. roasted iron pyrites | 4.00 | 3.0% | 70% |
| 6 | 3824 | Prepared binders for foundry moulds or cores; chemical… | 3.57 | 2.6% | 72% |
| 7 | 1214 | Swedes, mangolds, fodder roots, hay, alfalfa, clover… | 3.03 | 2.2% | 75% |
| 8 | 7326 | Articles of iron or steel, n.e.s. (excl. cast articles) | 2.62 | 1.9% | 77% |
| 9 | 4703 | Chemical wood pulp, soda or sulphate (excl. dissolving… | 1.97 | 1.5% | 78% |
| 10 | 1213 | Cereal straw and husks, unprepared, whether or not chopped… | 1.94 | 1.4% | 80% |
Metrics
| Year | DMC/cap | AR/cap | DE/cap | Import dep. | Intl import dep. | Self-suff. | Export int. |
|---|---|---|---|---|---|---|---|
| 2013 | 20.2 | 20.0 | 22.2 | – | 27% | 110% | – |
| 2014 | 20.0 | 19.9 | 22.5 | – | 27% | 113% | – |
| 2015 | 20.1 | 20.0 | 22.6 | – | 26% | 113% | – |
| 2016 | 21.1 | 21.0 | 23.0 | – | 27% | 109% | – |
| 2017 | 21.8 | 21.8 | 24.0 | – | 26% | 110% | – |
| 2018 | 21.8 | 21.9 | 23.1 | – | 28% | 106% | – |
| 2019 | 23.0 | 23.0 | 23.9 | – | 28% | 104% | – |
| 2020 | 21.8 | 21.9 | 24.7 | – | 25% | 114% | – |
| 2021 | 22.2 | 22.6 | 24.1 | – | 26% | 108% | – |
| 2022 | 20.7 | 20.9 | 23.0 | – | 26% | 111% | – |
Negative cells in 2019 (child > parent for a CN code): DE -1.44 Mt; M -0.00 Mt; X -0.00 Mt; dmc -2.08 Mt.
Rest of Södra Sverige (SE2 - SE23)
Sweden · rest-of · code SE2-SE23 · rest (SE2 - SE23) · years 2013–2022
Findings
- The rest of Södra Sverige (Småland with the islands, and Sydsverige: 2.41 million people) consumes 48.2 Mt or 20.0 t/cap in 2019.
- The profile is wood and stone: sawn wood (14%) and pulp (9%) lead exports. DMC is 55% non-metallic minerals and 31% biomass. Fossil is only 4% of DMC, against 15% in West Sweden, which hosts the refineries.
- Low international dependency (23%) and self-sufficiency of 0.97.
- Negative DMC cells are 2.1% of DMC.
Overview
| 2013 | 2019 | 2022 | |
|---|---|---|---|
| Population | 2 246 252 | 2 407 633 | 2 455 396 |
| DE (Mt) | 42.8 | 46.9 | 47.6 |
| Imports M (Mt) | 12.4 | 14.2 | 13.3 |
| Exports X (Mt) | 11.9 | 12.3 | 12.1 |
| Domestic in NI (Mt) | – | – | – |
| Domestic out NO (Mt) | – | – | – |
| AR (Mt) | 41.9 | 45.5 | 48.3 |
| DMC (Mt) | 43.7 | 48.2 | 50.4 |
| DMC (t/cap) | 19.5 | 20.0 | 20.5 |
| Unbalanced (% of gross AR) | 3.4% | 4.6% | 3.3% |
Domestic extraction
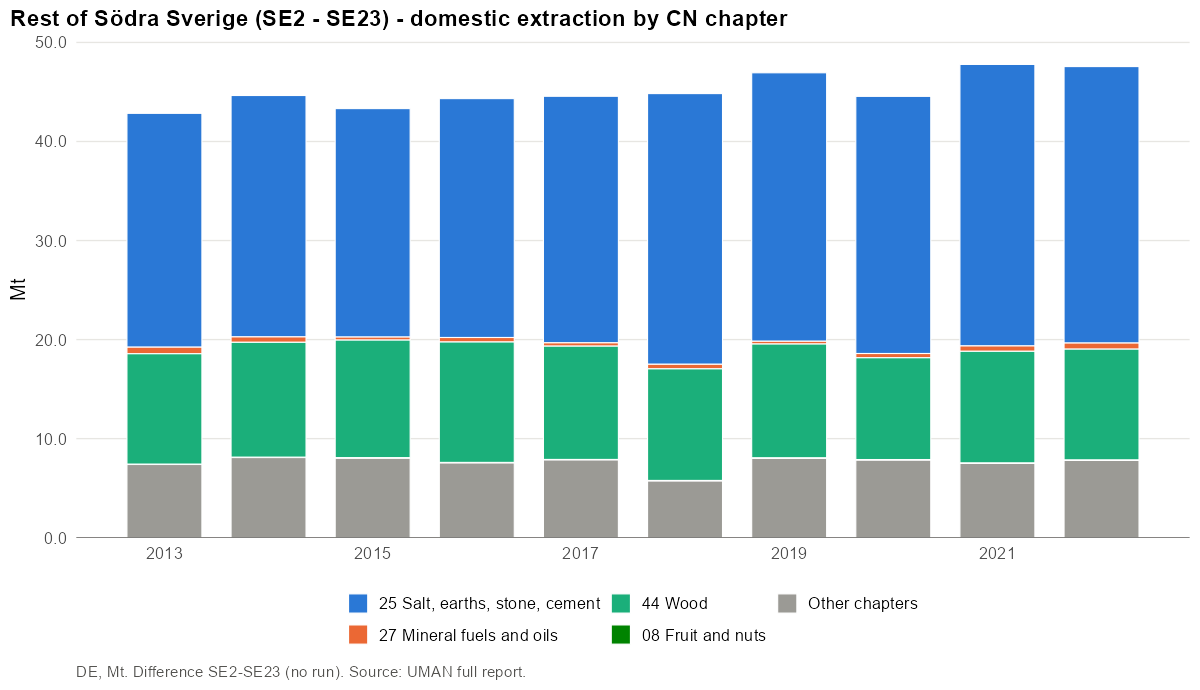
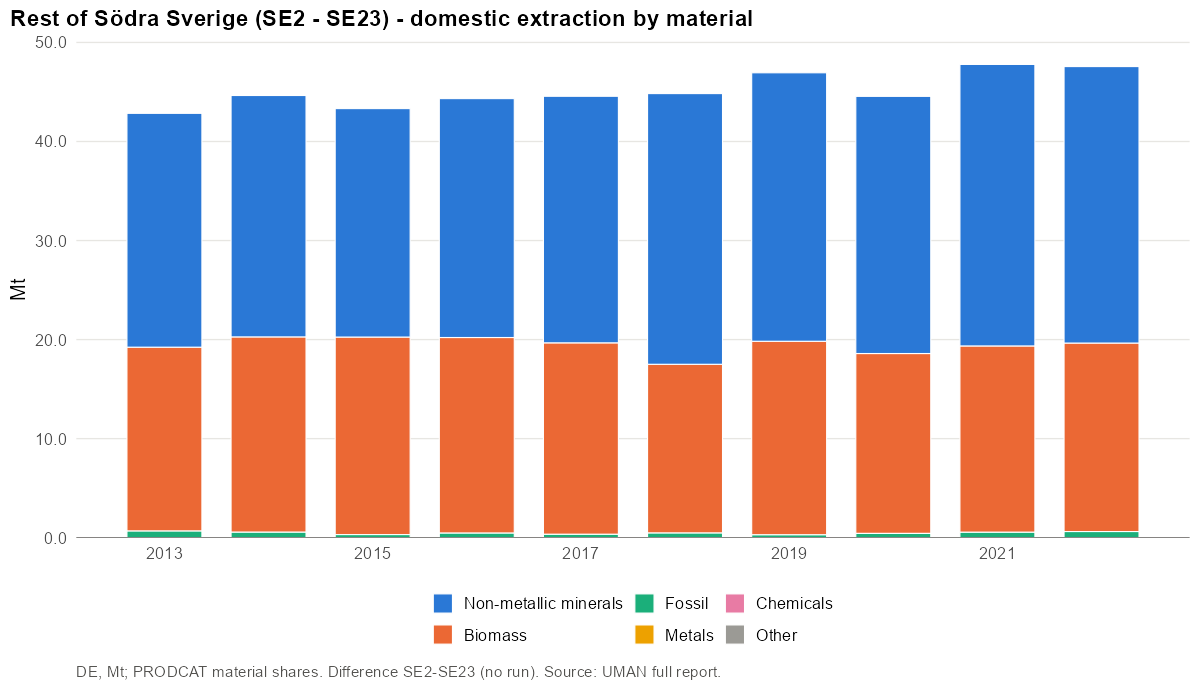
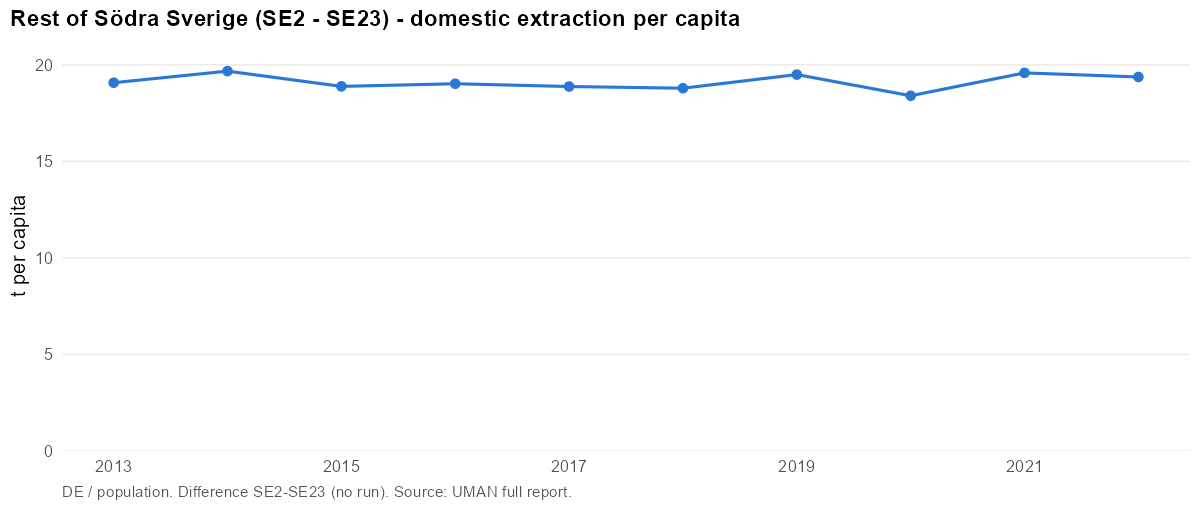
- Main CN4 codes (2019): 2517 Pebbles, gravel, broken or crushed stone, for concrete… (57%); 4403 Wood in the rough, whether or not stripped of bark or… (23%); 1214 Swedes, mangolds, fodder roots, hay, alfalfa, clover… (4%); 1213 Cereal straw and husks, unprepared, whether or not chopped… (3%); 1001 Wheat and meslin (3%).
- Main materials: Stone (58%); Wood and wood fuels (24%); Agriculture biomass (14%).
International trade
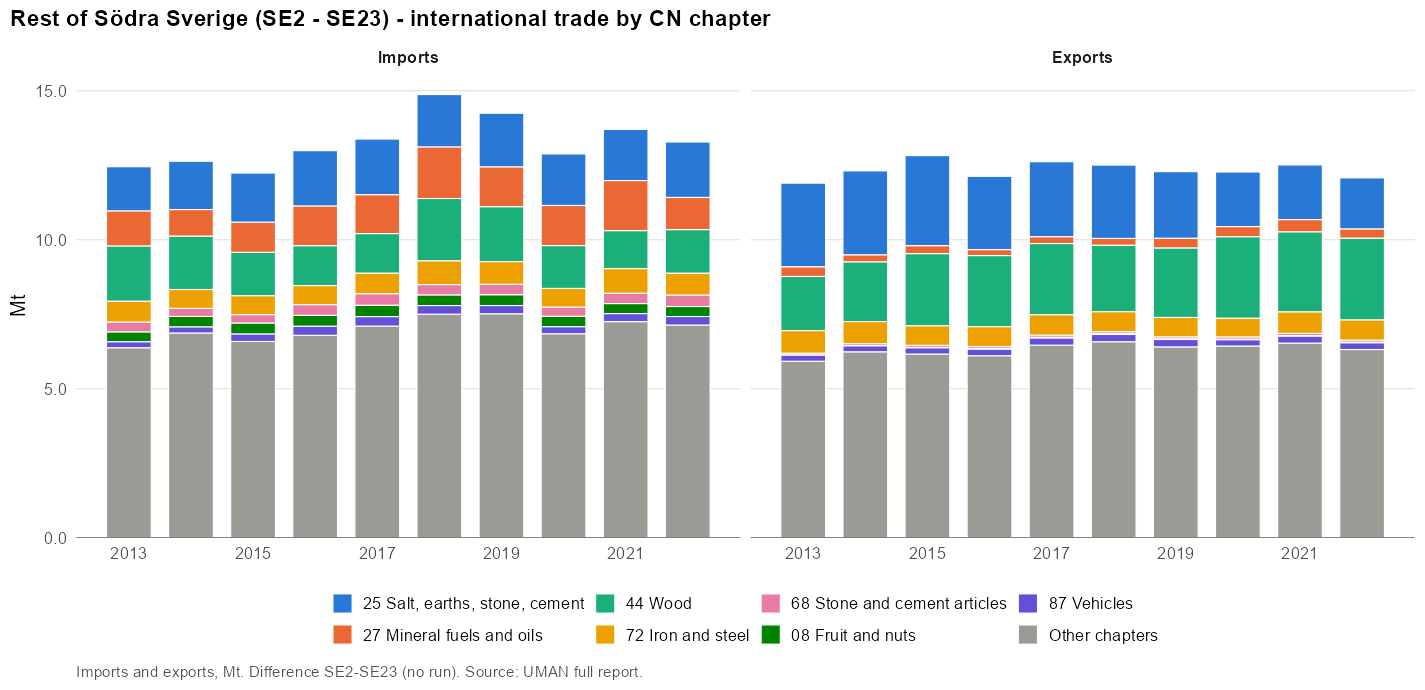
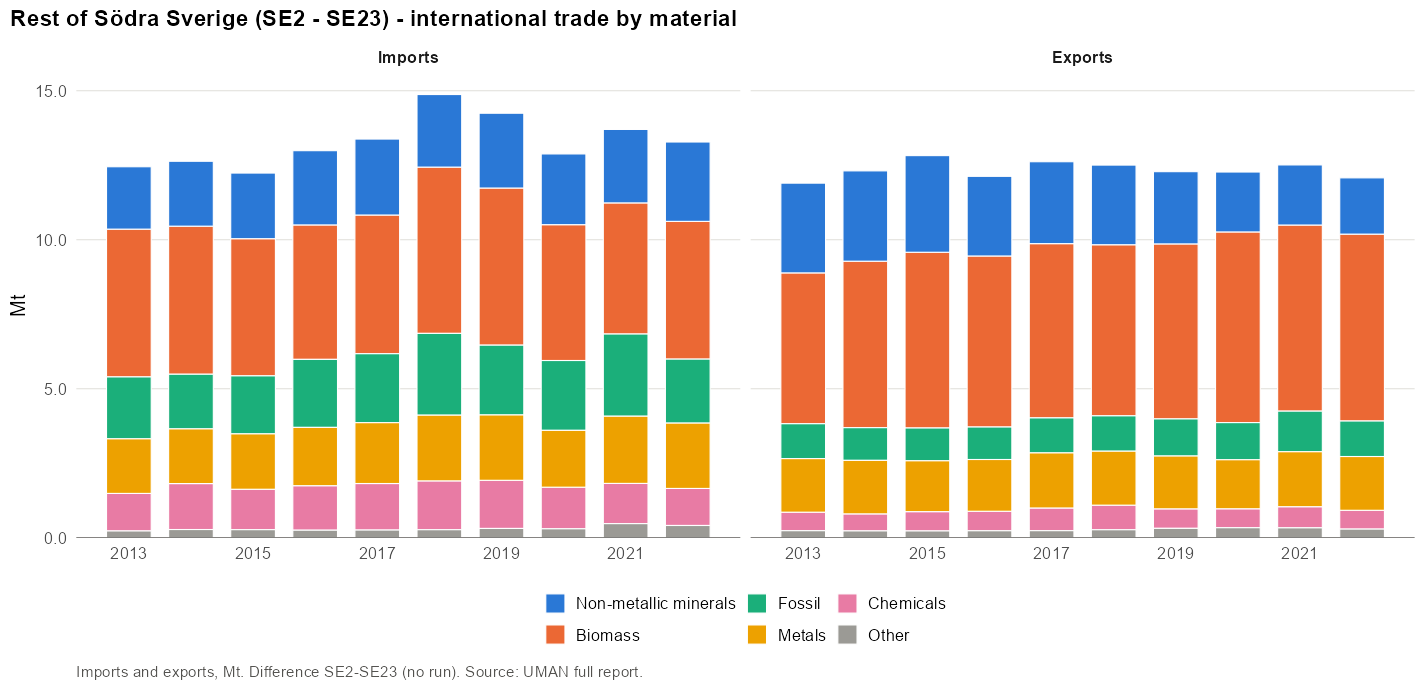
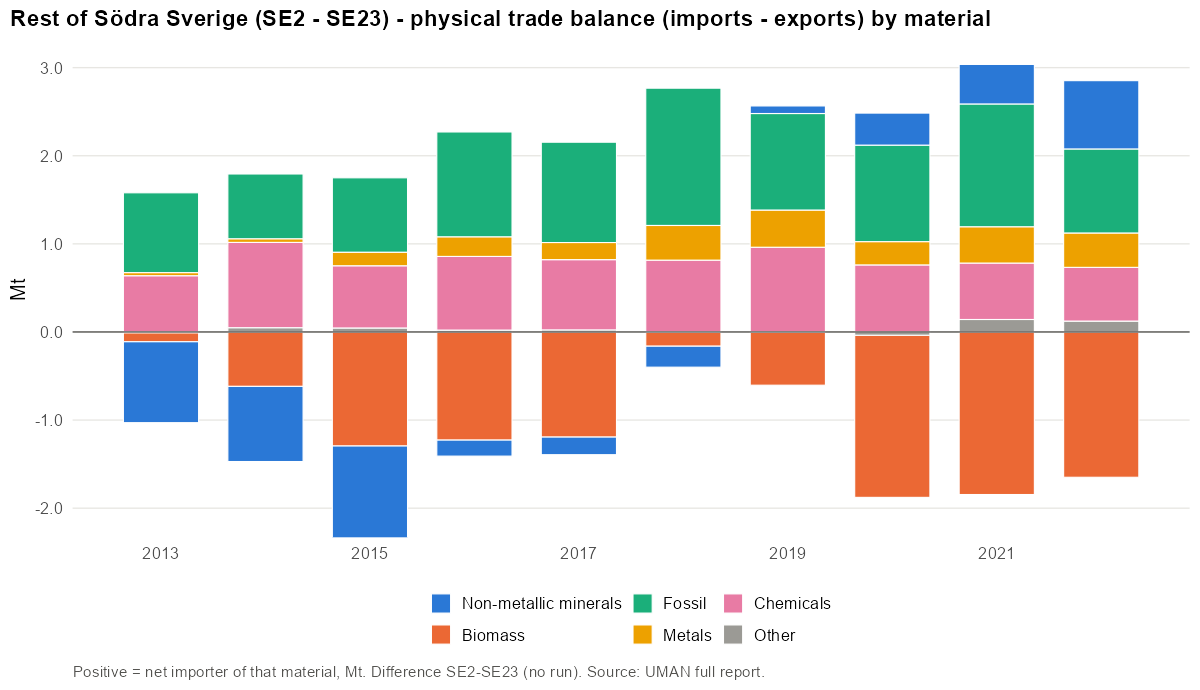
Imports:
- Main CN4 codes (2019): 4403 Wood in the rough, whether or not stripped of bark or… (7%); 2711 Petroleum gas and other gaseous hydrocarbons (4%); 2523 Cement, incl. cement clinkers, whether or not coloured (3%); 3102 Mineral or chemical nitrogenous fertilisers (excl. those in… (3%); 9403 Furniture and parts thereof, n.e.s. (excl. seats and… (2%).
- Main materials: Wood and wood fuels (13%); Iron, steel and ferro-alloys (13%); Agriculture biomass (11%).
Exports:
- Main CN4 codes (2019): 4407 Wood sawn or chipped lengthwise, sliced or peeled, whether… (14%); 4703 Chemical wood pulp, soda or sulphate (excl. dissolving… (9%); 2517 Pebbles, gravel, broken or crushed stone, for concrete… (9%); 2521 Limestone flux; limestone and other calcareous stone, of a… (4%); 2523 Cement, incl. cement clinkers, whether or not coloured (4%).
- Main materials: Wood and wood fuels (27%); Iron, steel and ferro-alloys (11%); Stone (9%).
Domestic movement of goods
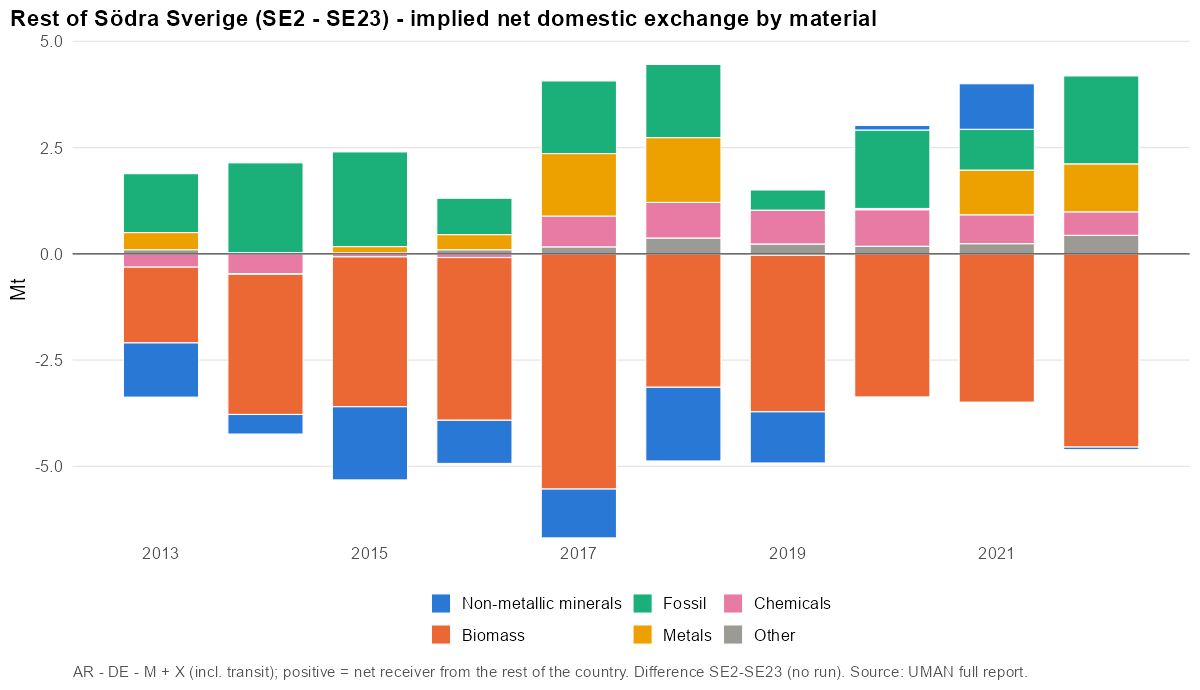
Gross domestic flows of a rest-of territory cannot be obtained by difference; only the implied net exchange is shown.
Available resources
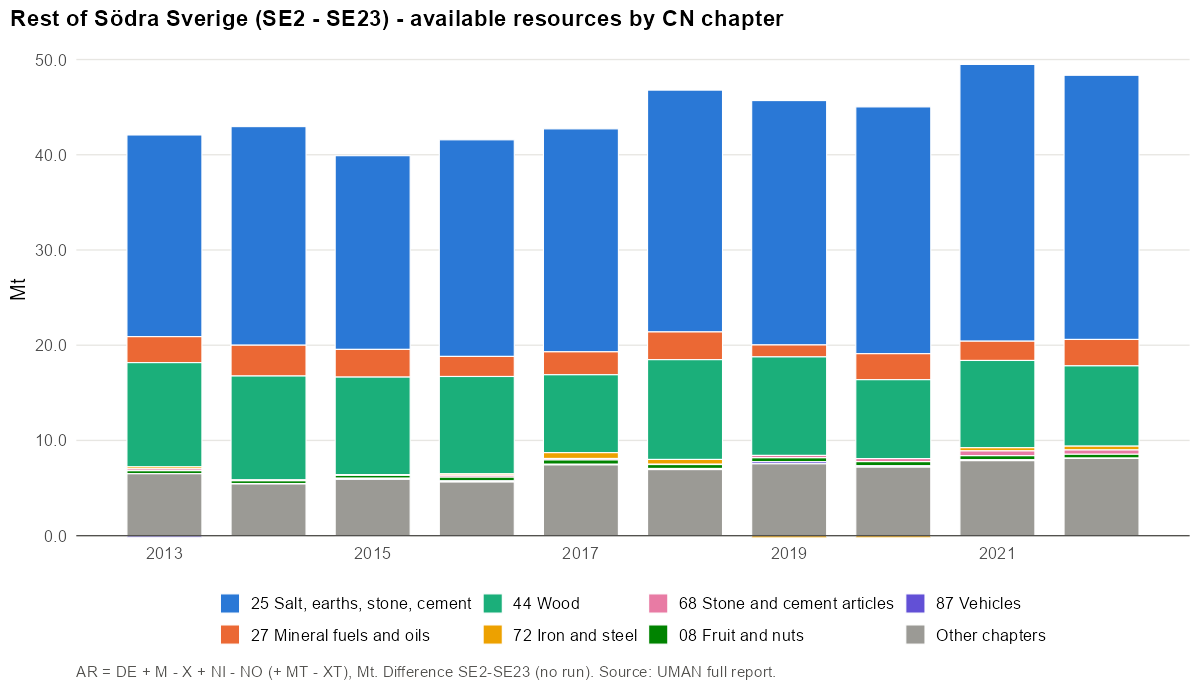
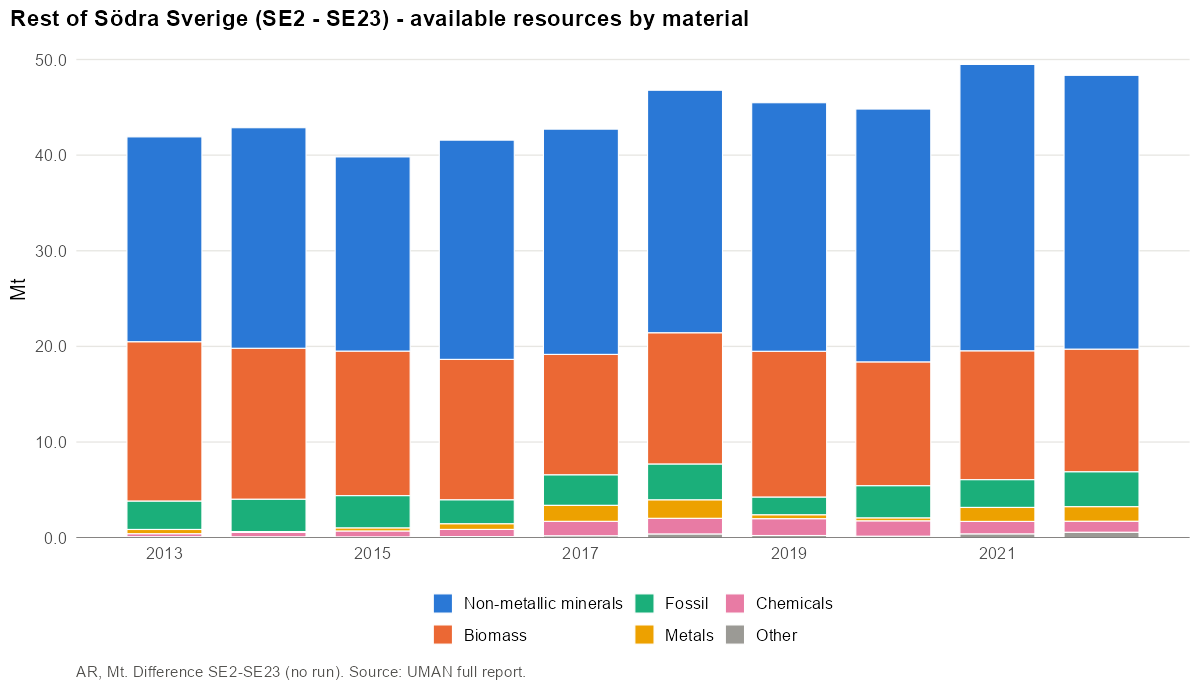
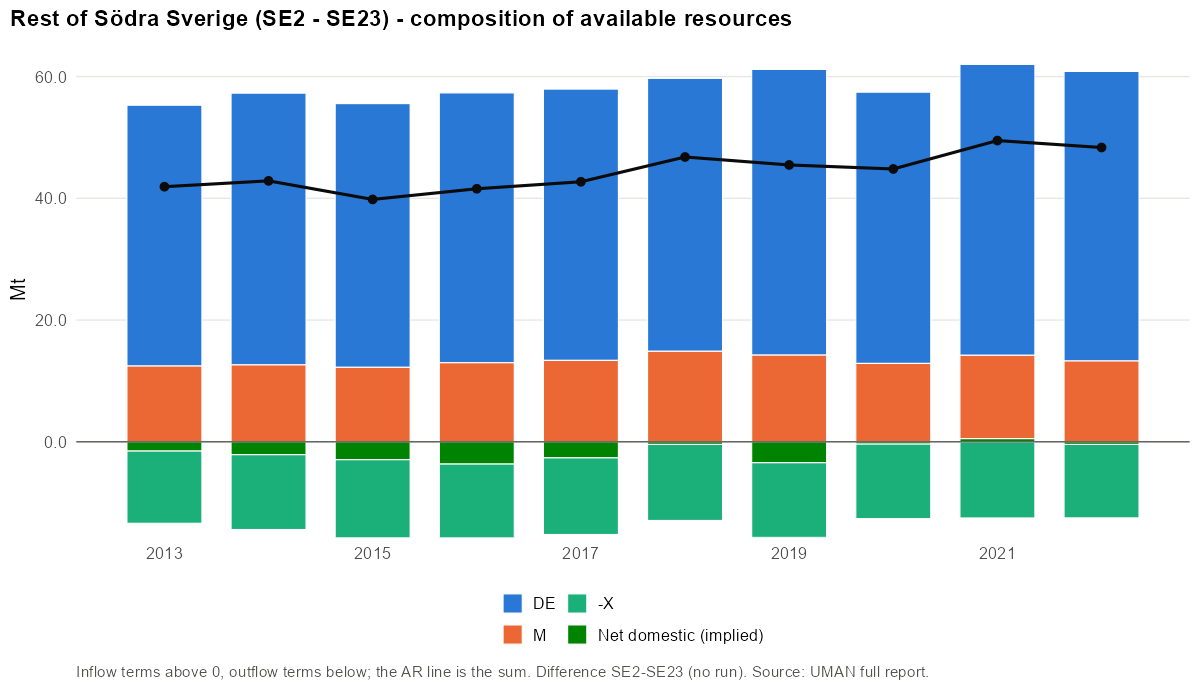
- Main CN4 codes (2019): 2517 Pebbles, gravel, broken or crushed stone, for concrete… (57%); 4403 Wood in the rough, whether or not stripped of bark or… (26%); 1214 Swedes, mangolds, fodder roots, hay, alfalfa, clover… (4%); 1213 Cereal straw and husks, unprepared, whether or not chopped… (3%); 1001 Wheat and meslin (2%).
- Main materials: Stone (57%); Wood and wood fuels (20%); Agriculture biomass (15%).
Industrial production
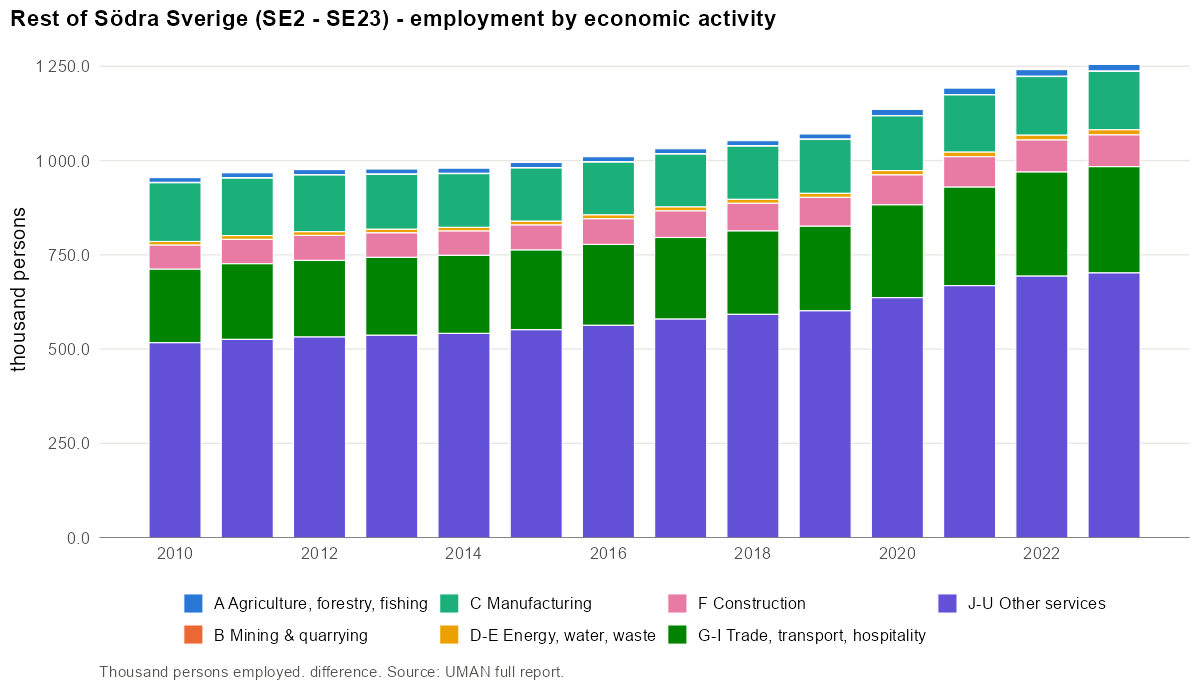
Production and the NACE-CN Sankey require a run; not available for a rest-of territory.
Largest employers (NACE divisions):
| NACE | Activity | Persons | Share |
|---|---|---|---|
| 85 | Education | 116 733 | 10.9% |
| 86 | Human health activities | 74 790 | 7.0% |
| 88 | Social work activities without accommodation | 65 695 | 6.1% |
| 47 | Retail trade, except of motor vehicles and motorcycles | 63 088 | 5.9% |
| 87 | Residential care activities | 61 337 | 5.7% |
| 84 | Public administration and defence; compulsory social security | 58 478 | 5.5% |
| 46 | Wholesale trade, except of motor vehicles and motorcycles | 51 653 | 4.8% |
| 43 | Specialised construction activities | 47 834 | 4.5% |
Product transformation
Product transformation requires a run; not available for a rest-of territory.
Domestic material consumption
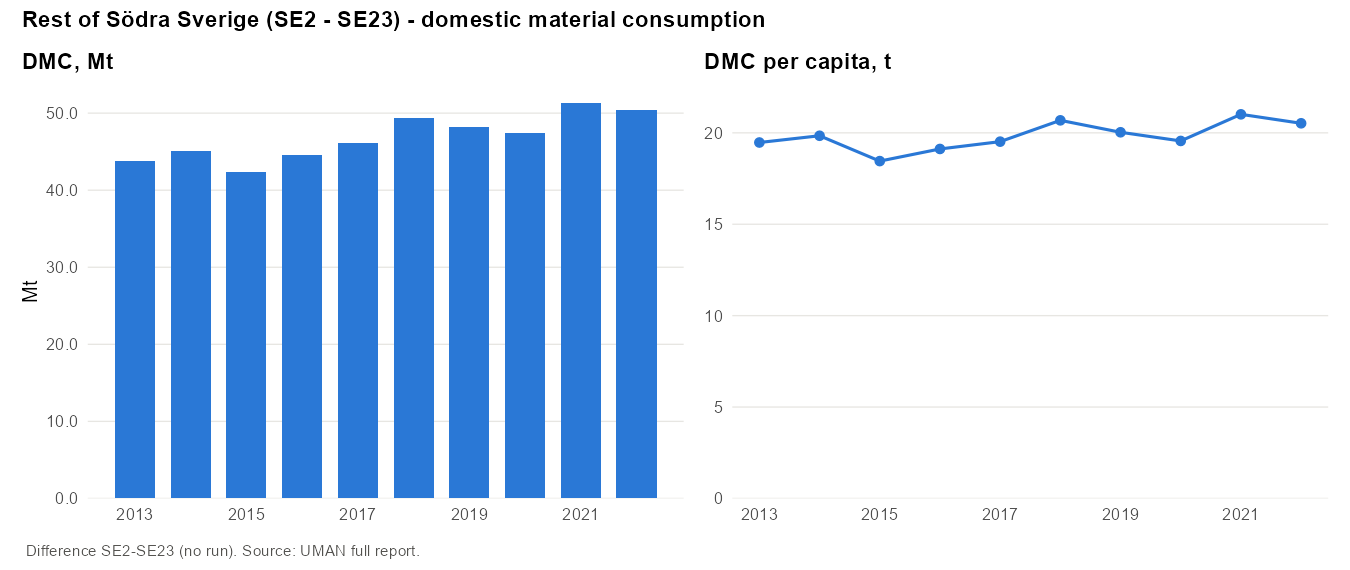
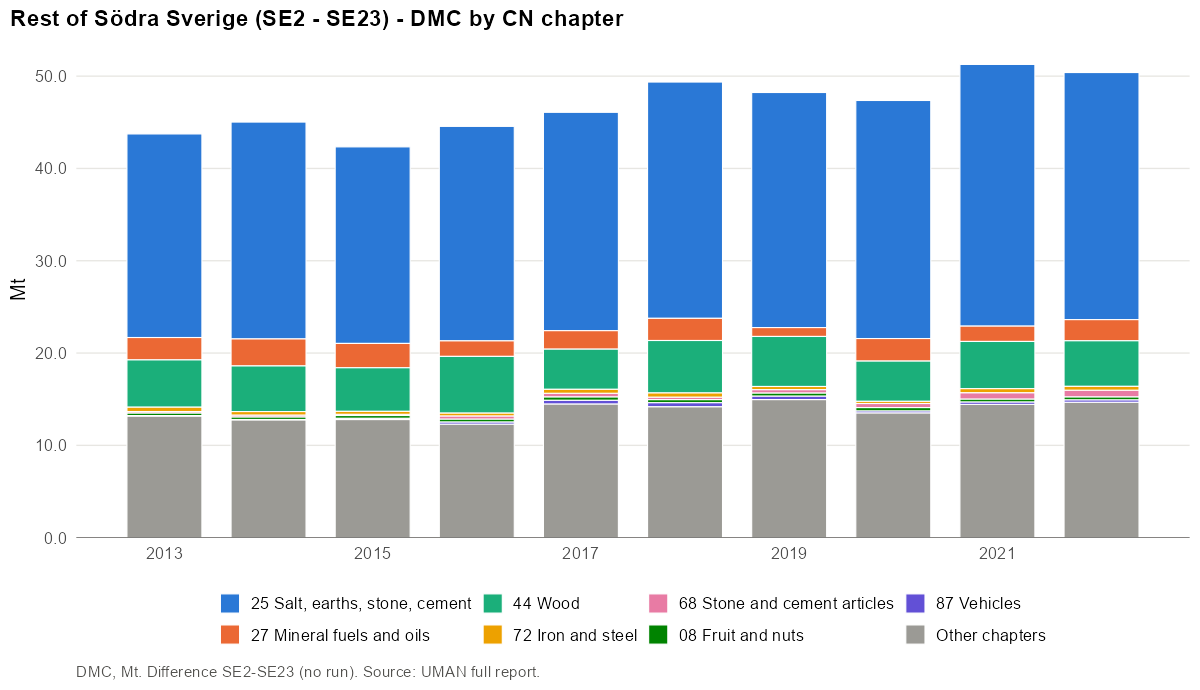
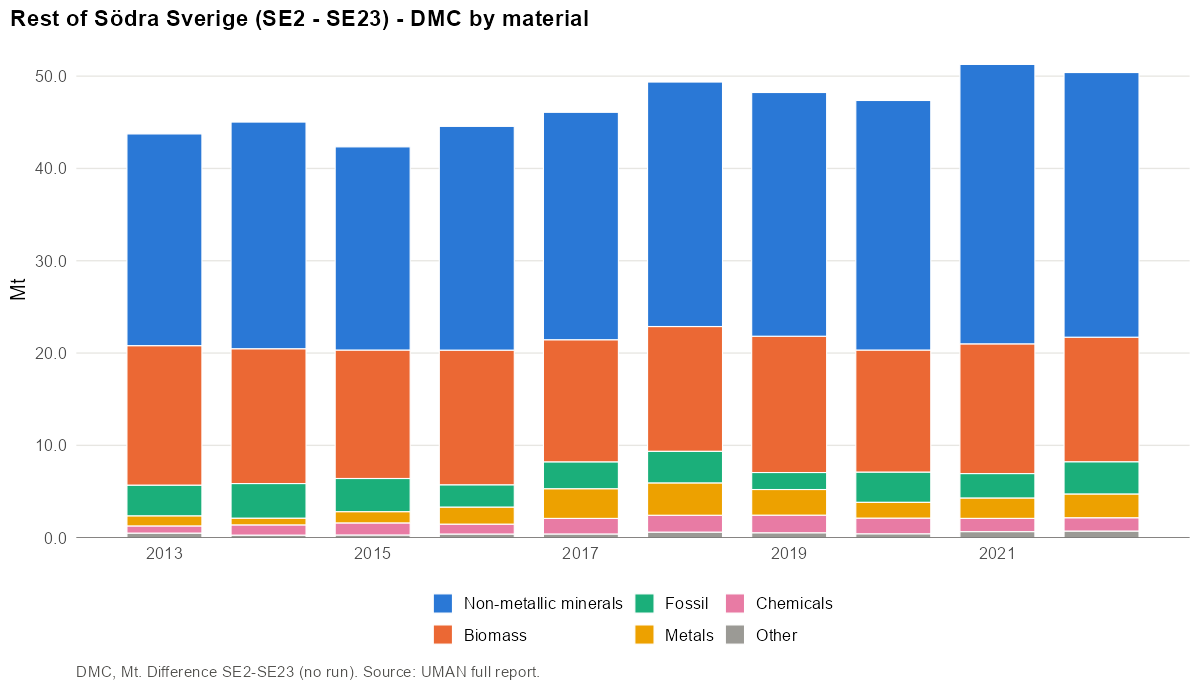
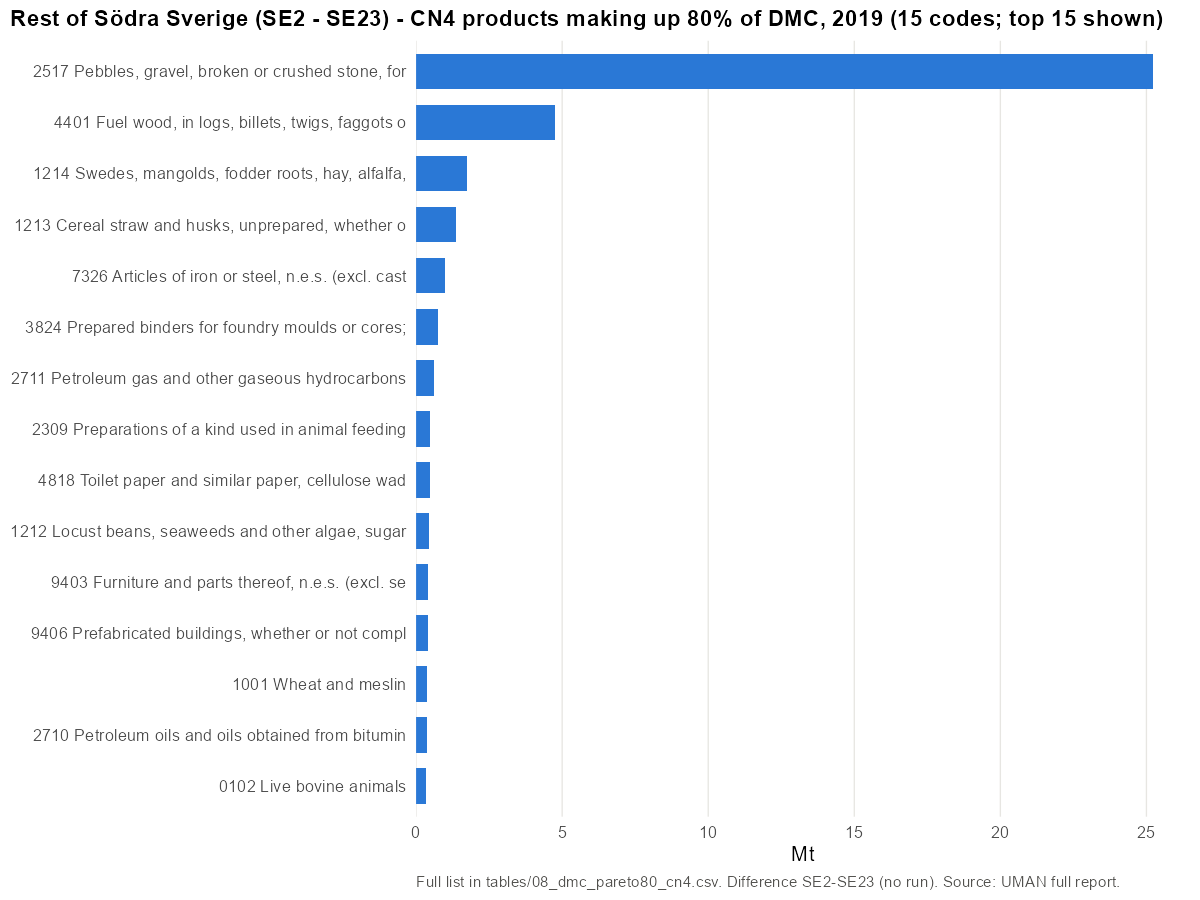
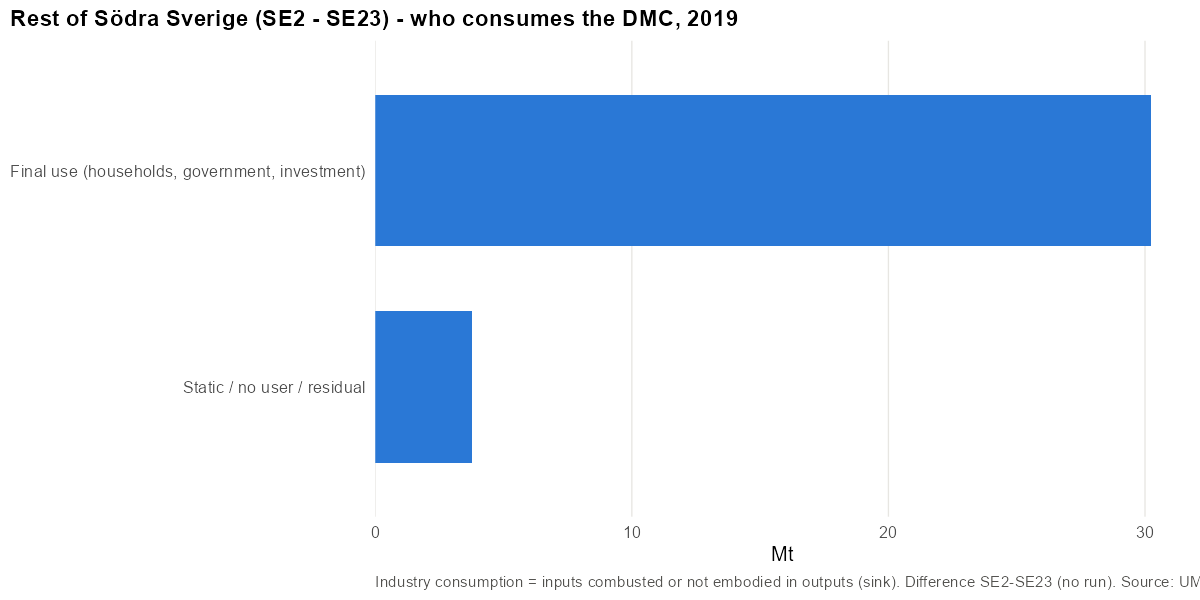
- Main CN4 codes (2019): 2517 Pebbles, gravel, broken or crushed stone, for concrete… (52%); 4401 Fuel wood, in logs, billets, twigs, faggots or similar… (10%); 1214 Swedes, mangolds, fodder roots, hay, alfalfa, clover… (4%); 1213 Cereal straw and husks, unprepared, whether or not chopped… (3%); 7326 Articles of iron or steel, n.e.s. (excl. cast articles) (2%).
- Main materials: Stone (53%); Agriculture biomass (13%); Wood and wood fuels (12%).
15 CN4 codes make up 80% of DMC in 2019. Top 10:
| Rank | CN4 | Product | Mt | Share | Cumulative |
|---|---|---|---|---|---|
| 1 | 2517 | Pebbles, gravel, broken or crushed stone, for concrete… | 25.22 | 52.3% | 52% |
| 2 | 4401 | Fuel wood, in logs, billets, twigs, faggots or similar… | 4.77 | 9.9% | 62% |
| 3 | 1214 | Swedes, mangolds, fodder roots, hay, alfalfa, clover… | 1.75 | 3.6% | 66% |
| 4 | 1213 | Cereal straw and husks, unprepared, whether or not chopped… | 1.36 | 2.8% | 69% |
| 5 | 7326 | Articles of iron or steel, n.e.s. (excl. cast articles) | 1.00 | 2.1% | 71% |
| 6 | 3824 | Prepared binders for foundry moulds or cores; chemical… | 0.75 | 1.6% | 72% |
| 7 | 2711 | Petroleum gas and other gaseous hydrocarbons | 0.60 | 1.3% | 74% |
| 8 | 2309 | Preparations of a kind used in animal feeding | 0.47 | 1.0% | 74% |
| 9 | 4818 | Toilet paper and similar paper, cellulose wadding or webs… | 0.47 | 1.0% | 75% |
| 10 | 1212 | Locust beans, seaweeds and other algae, sugar beet and… | 0.45 | 0.9% | 76% |
Metrics
| Year | DMC/cap | AR/cap | DE/cap | Import dep. | Intl import dep. | Self-suff. | Export int. |
|---|---|---|---|---|---|---|---|
| 2013 | 19.5 | 18.7 | 19.1 | – | 23% | 98% | – |
| 2014 | 19.8 | 18.9 | 19.7 | – | 22% | 99% | – |
| 2015 | 18.5 | 17.4 | 18.9 | – | 22% | 102% | – |
| 2016 | 19.1 | 17.8 | 19.0 | – | 23% | 99% | – |
| 2017 | 19.5 | 18.1 | 18.9 | – | 23% | 97% | – |
| 2018 | 20.7 | 19.6 | 18.8 | – | 25% | 91% | – |
| 2019 | 20.0 | 18.9 | 19.5 | – | 23% | 97% | – |
| 2020 | 19.6 | 18.5 | 18.4 | – | 22% | 94% | – |
| 2021 | 21.0 | 20.3 | 19.6 | – | 22% | 93% | – |
| 2022 | 20.5 | 19.7 | 19.4 | – | 22% | 94% | – |
Negative cells in 2019 (child > parent for a CN code): DE 0.00 Mt; M 0.00 Mt; X 0.00 Mt; dmc -0.99 Mt.
Rest of Västsverige (SE23 - SE232)
Sweden · rest-of · code SE23-SE232 · rest (SE23 - SE232) · years 2013–2022
Findings
- The rest of West Sweden is Halland (0.33 million people): 7.0 Mt or 21.0 t/cap in 2019, but very volatile (16.0–29.8 t/cap over 2013–2022).
- Exports are forest products: sawn wood 20%, pulp 19%, paper 10%.
- Refined petroleum products are 23% of its DMC. This comes from the difference of two large fossil accounts and should be read with care.
- This is the least reliable difference in the report: negative DMC cells are 14% of DMC. A run of its own would be needed for firm conclusions.
Overview
| 2013 | 2019 | 2022 | |
|---|---|---|---|
| Population | 306 840 | 333 848 | 342 805 |
| DE (Mt) | 5.4 | 5.0 | 4.8 |
| Imports M (Mt) | 1.7 | 1.6 | 1.4 |
| Exports X (Mt) | 1.8 | 1.7 | 1.6 |
| Domestic in NI (Mt) | – | – | – |
| Domestic out NO (Mt) | – | – | – |
| AR (Mt) | 4.8 | 6.8 | 8.3 |
| DMC (Mt) | 5.1 | 7.0 | 8.0 |
| DMC (t/cap) | 16.5 | 21.0 | 23.4 |
| Unbalanced (% of gross AR) | 3.1% | 2.1% | -2.5% |
Domestic extraction
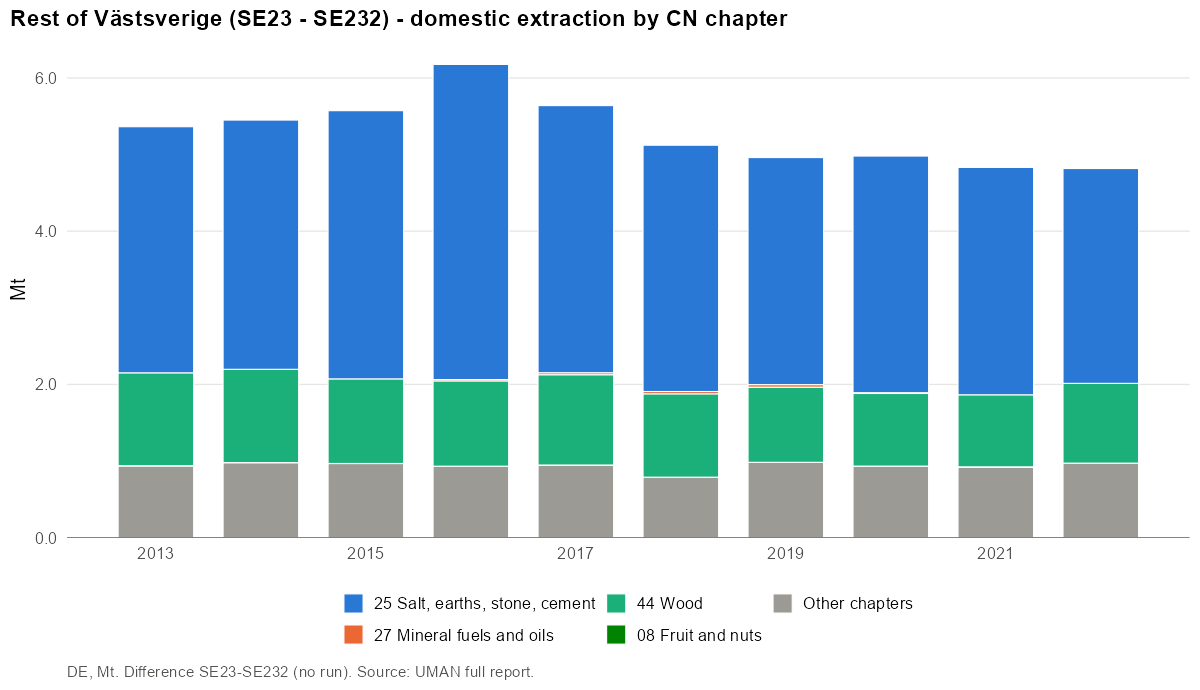
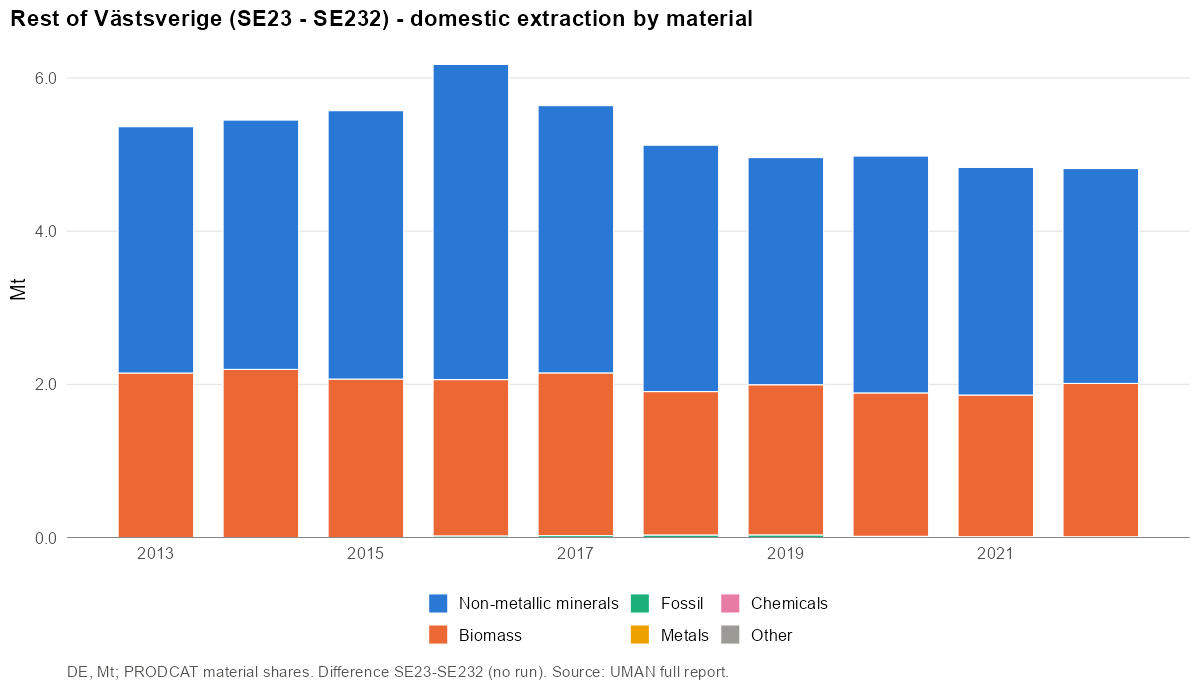
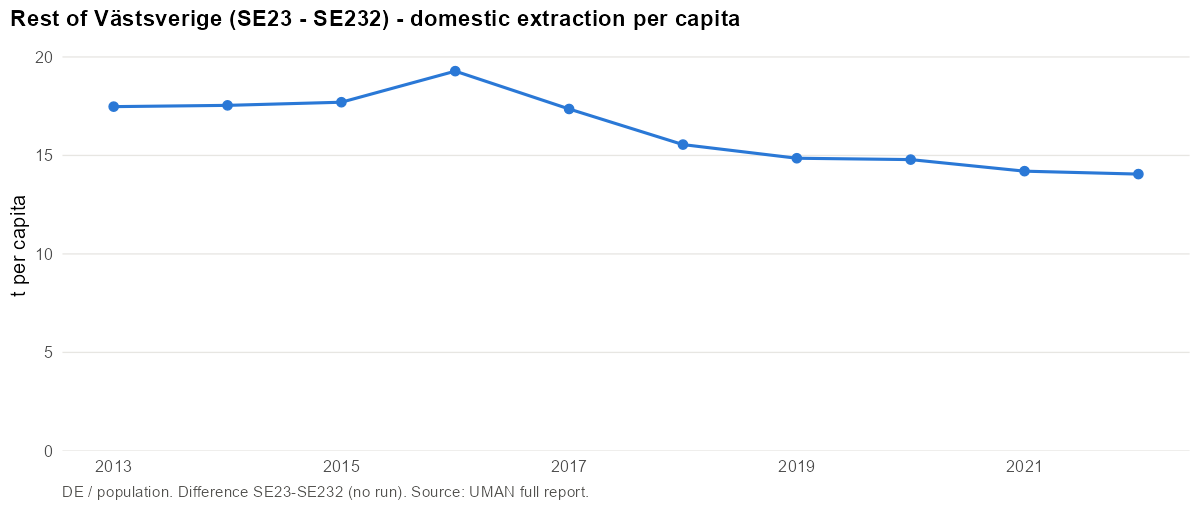
- Main CN4 codes (2019): 2517 Pebbles, gravel, broken or crushed stone, for concrete… (59%); 4403 Wood in the rough, whether or not stripped of bark or… (18%); 1214 Swedes, mangolds, fodder roots, hay, alfalfa, clover… (8%); 1212 Locust beans, seaweeds and other algae, sugar beet and… (2%); 1213 Cereal straw and husks, unprepared, whether or not chopped… (2%).
- Main materials: Stone (60%); Wood and wood fuels (20%); Agriculture biomass (16%).
International trade
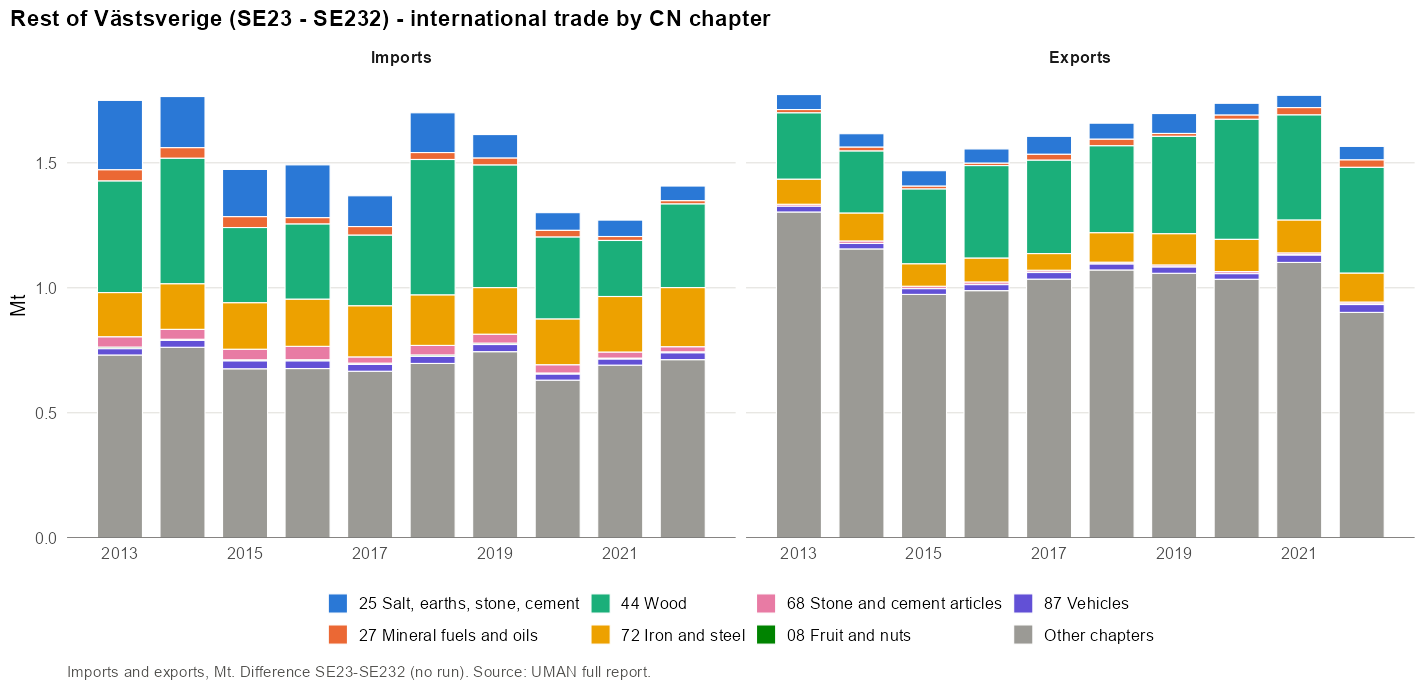
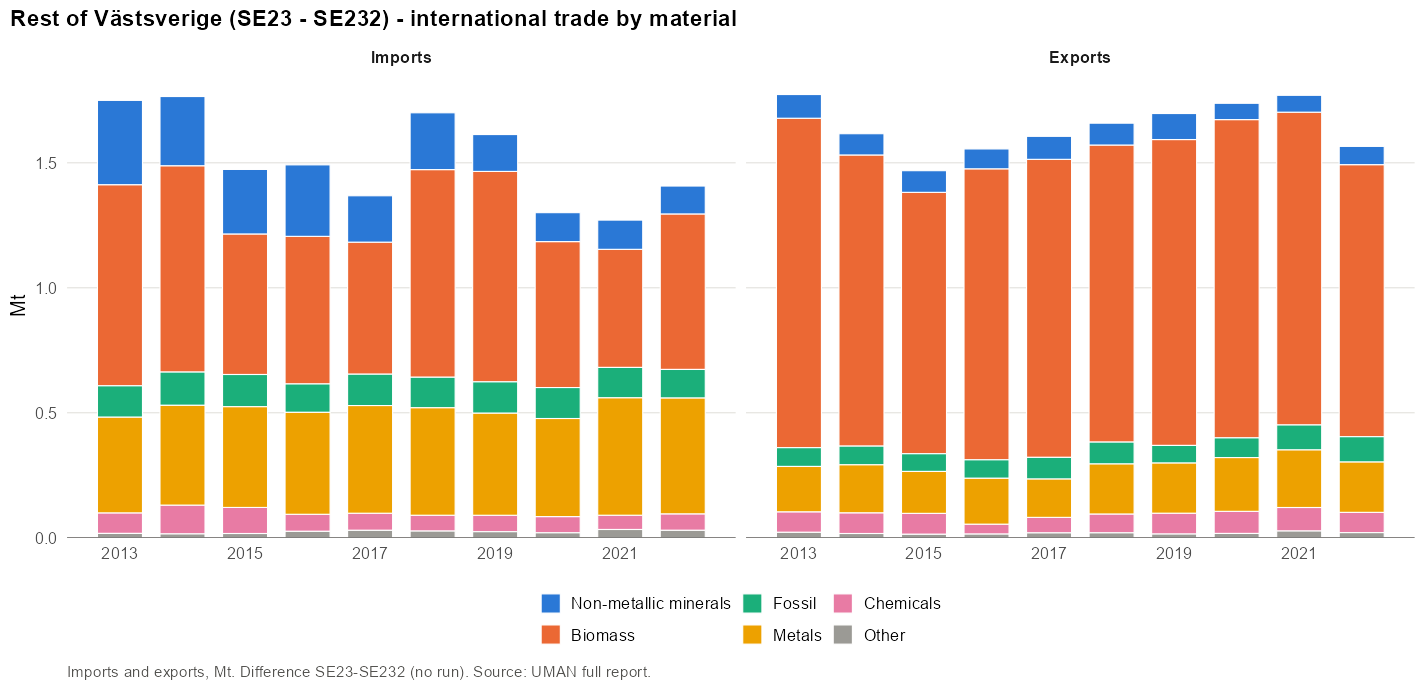
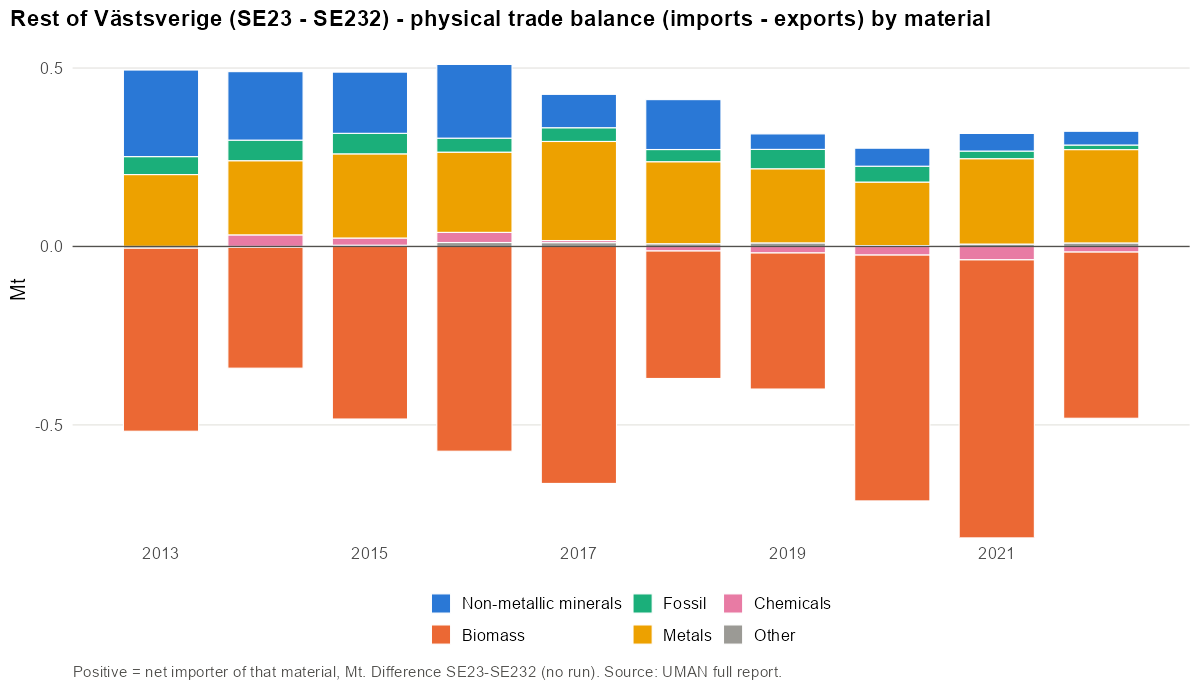
Imports:
- Main CN4 codes (2019): 4403 Wood in the rough, whether or not stripped of bark or… (22%); 4401 Fuel wood, in logs, billets, twigs, faggots or similar… (6%); 1003 Barley (4%); 7306 Tubes, pipes and hollow profiles ""e.g., open seam or… (4%); 7213 Bars and rods of iron or non-alloy steel, hot-rolled, in… (4%).
- Main materials: Wood and wood fuels (31%); Iron, steel and ferro-alloys (23%); Agriculture biomass (10%).
Exports:
- Main CN4 codes (2019): 4407 Wood sawn or chipped lengthwise, sliced or peeled, whether… (20%); 4703 Chemical wood pulp, soda or sulphate (excl. dissolving… (19%); 4802 Uncoated paper and paperboard, of a kind used for writing… (10%); 1107 Malt, whether or not roasted (8%); 4801 Newsprint as specified in Note 4 to chapter 48, in rolls of… (7%).
- Main materials: Wood and wood fuels (39%); Paper and board (22%); Iron, steel and ferro-alloys (11%).
Domestic movement of goods
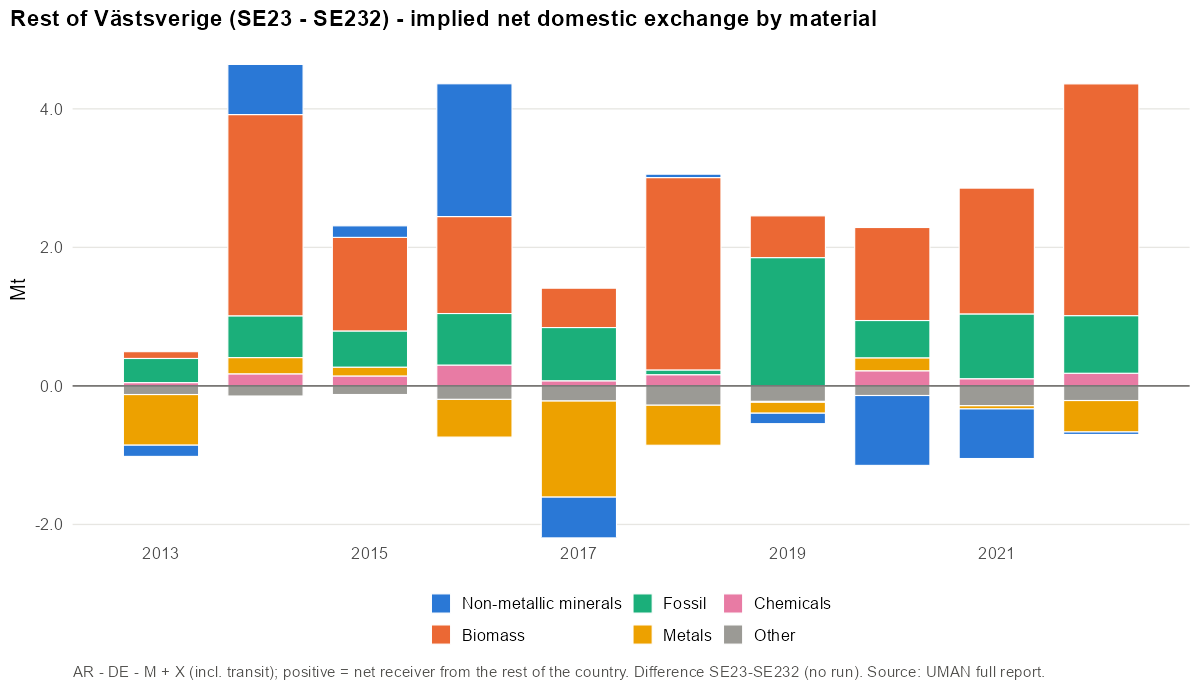
Gross domestic flows of a rest-of territory cannot be obtained by difference; only the implied net exchange is shown.
Available resources
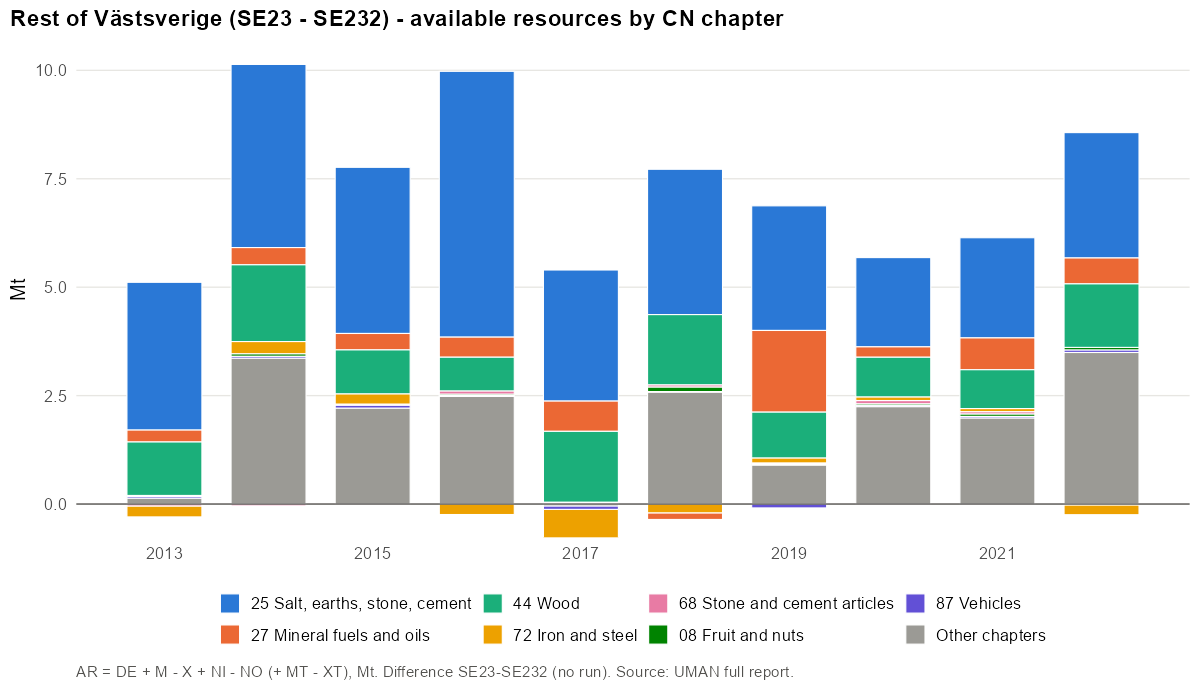
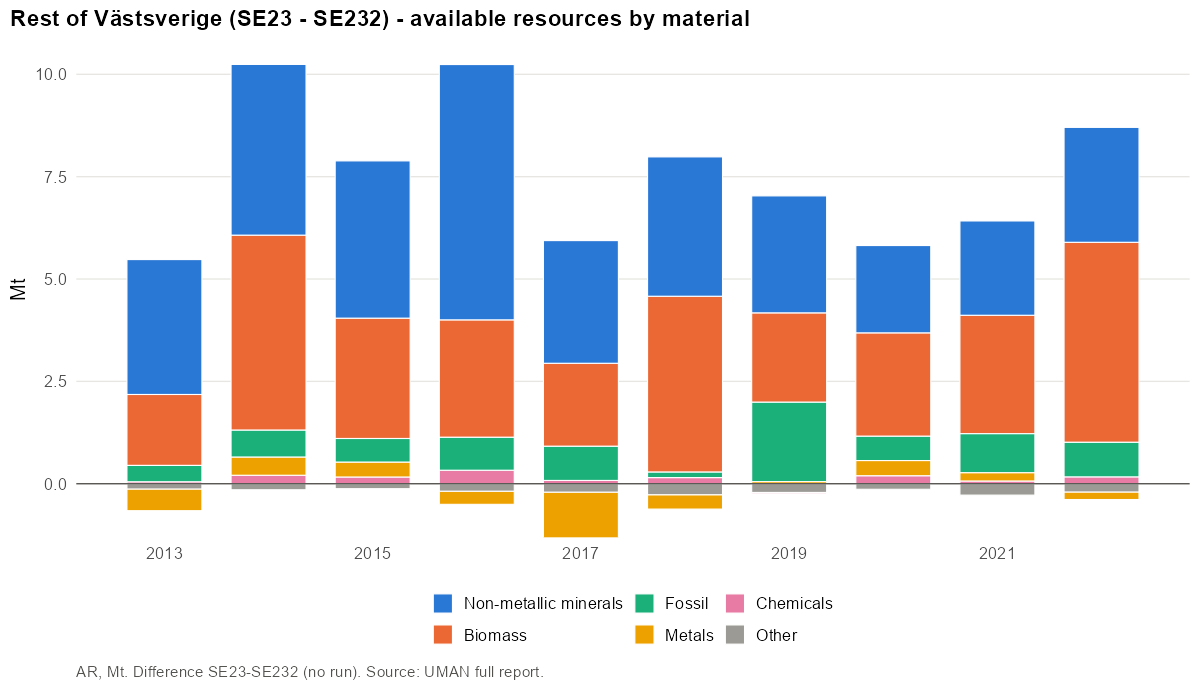
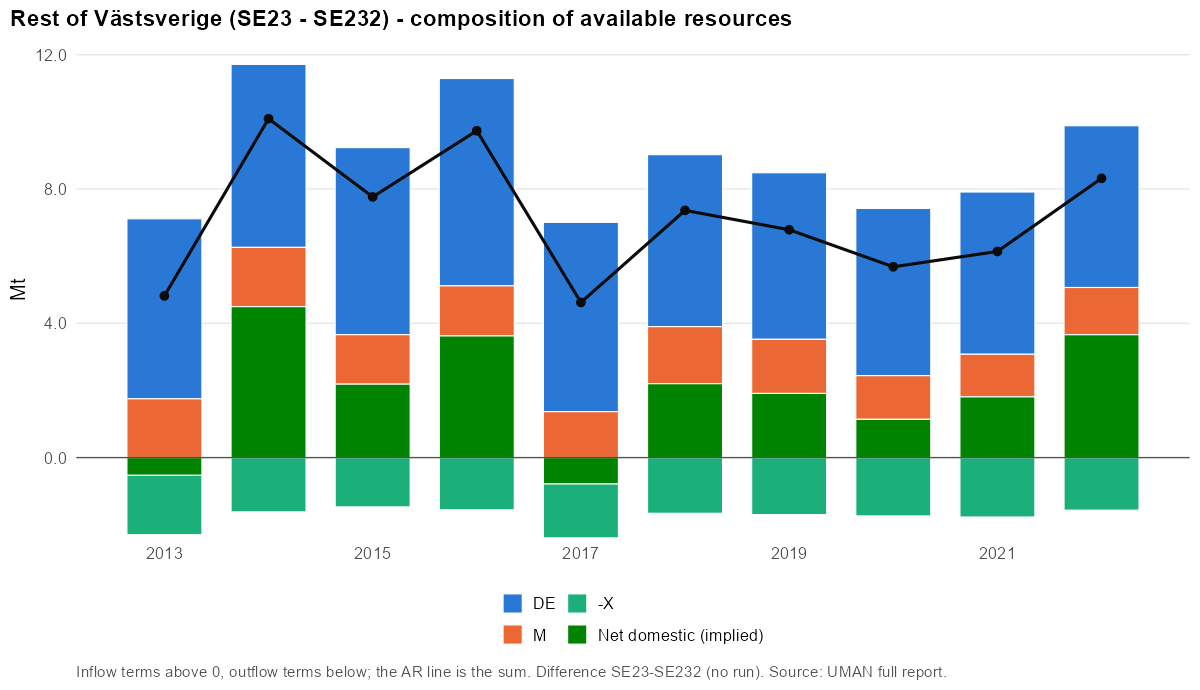
- Main CN4 codes (2019): 2517 Pebbles, gravel, broken or crushed stone, for concrete… (40%); 2710 Petroleum oils and oils obtained from bituminous minerals… (24%); 4403 Wood in the rough, whether or not stripped of bark or… (23%); 1214 Swedes, mangolds, fodder roots, hay, alfalfa, clover… (7%); 1003 Barley (5%).
- Main materials: Stone (40%); Fuels (23%); Agriculture biomass (19%).
Industrial production
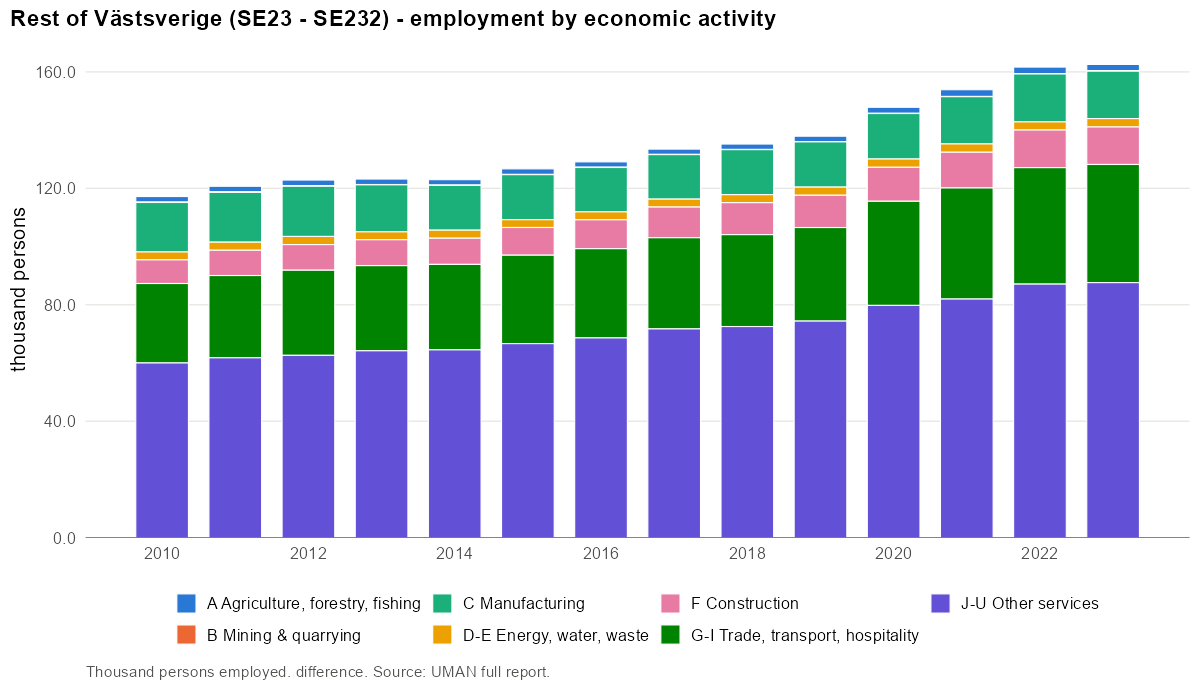
Production and the NACE-CN Sankey require a run; not available for a rest-of territory.
Largest employers (NACE divisions):
| NACE | Activity | Persons | Share |
|---|---|---|---|
| 85 | Education | 17 603 | 12.8% |
| 47 | Retail trade, except of motor vehicles and motorcycles | 10 684 | 7.7% |
| 88 | Social work activities without accommodation | 9 306 | 6.7% |
| 86 | Human health activities | 8 422 | 6.1% |
| 43 | Specialised construction activities | 7 470 | 5.4% |
| 87 | Residential care activities | 7 251 | 5.3% |
| 84 | Public administration and defence; compulsory social security | 6 694 | 4.9% |
| 46 | Wholesale trade, except of motor vehicles and motorcycles | 6 682 | 4.8% |
Product transformation
Product transformation requires a run; not available for a rest-of territory.
Domestic material consumption
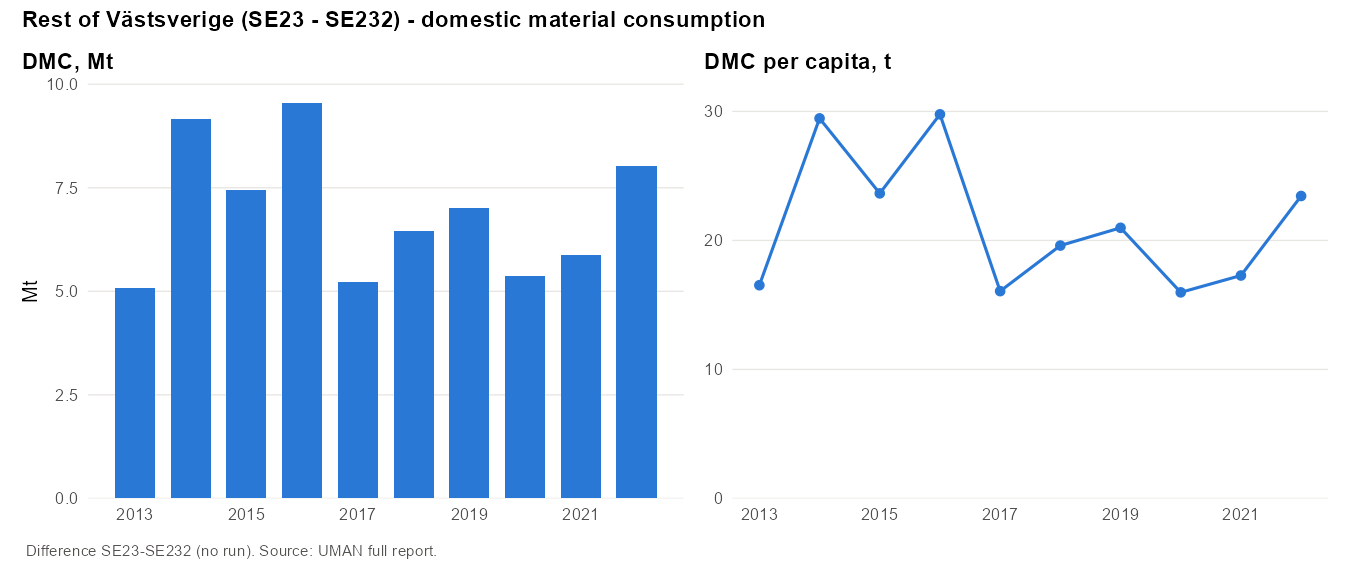
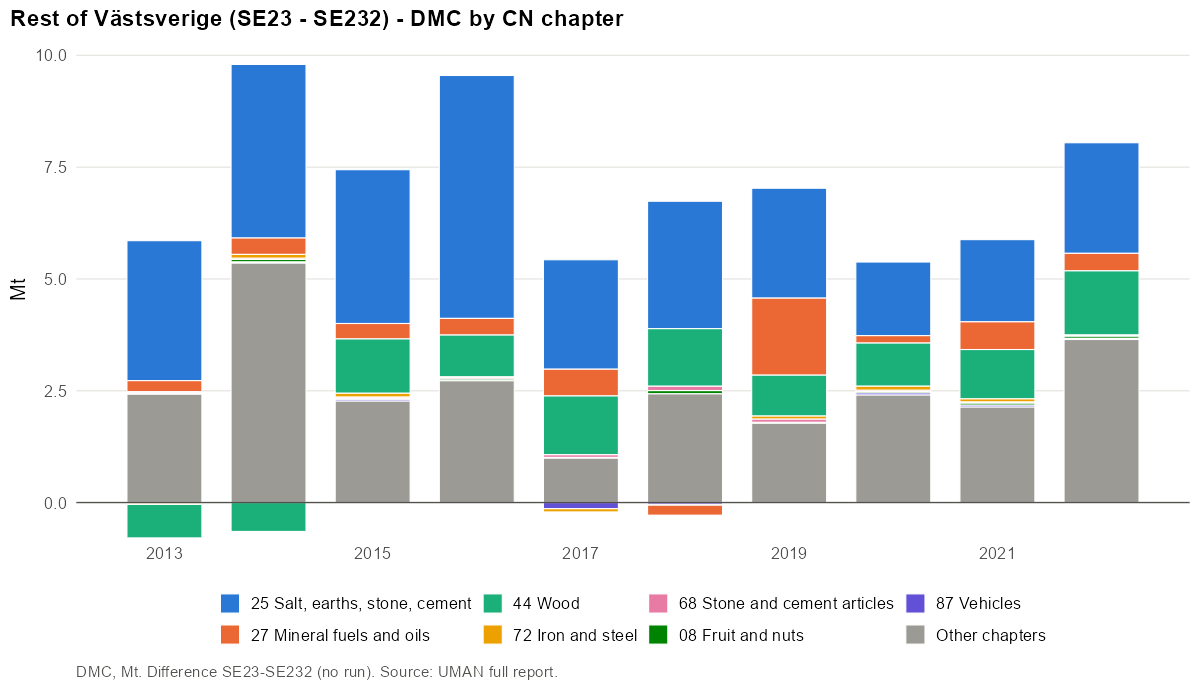
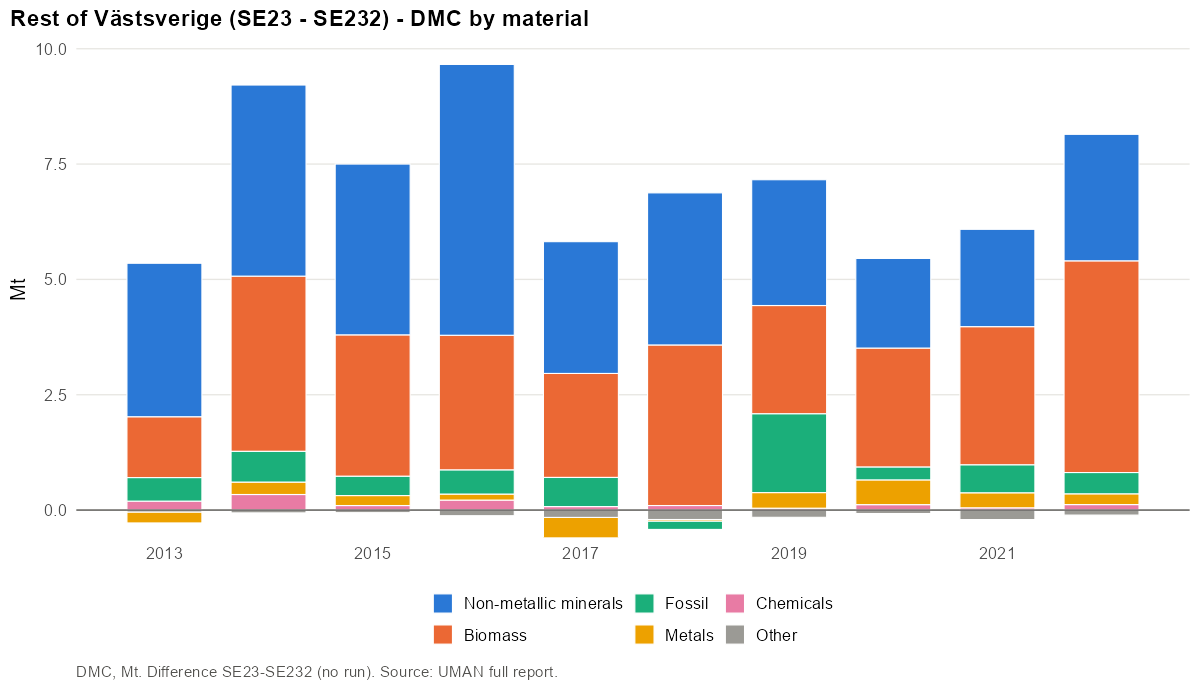
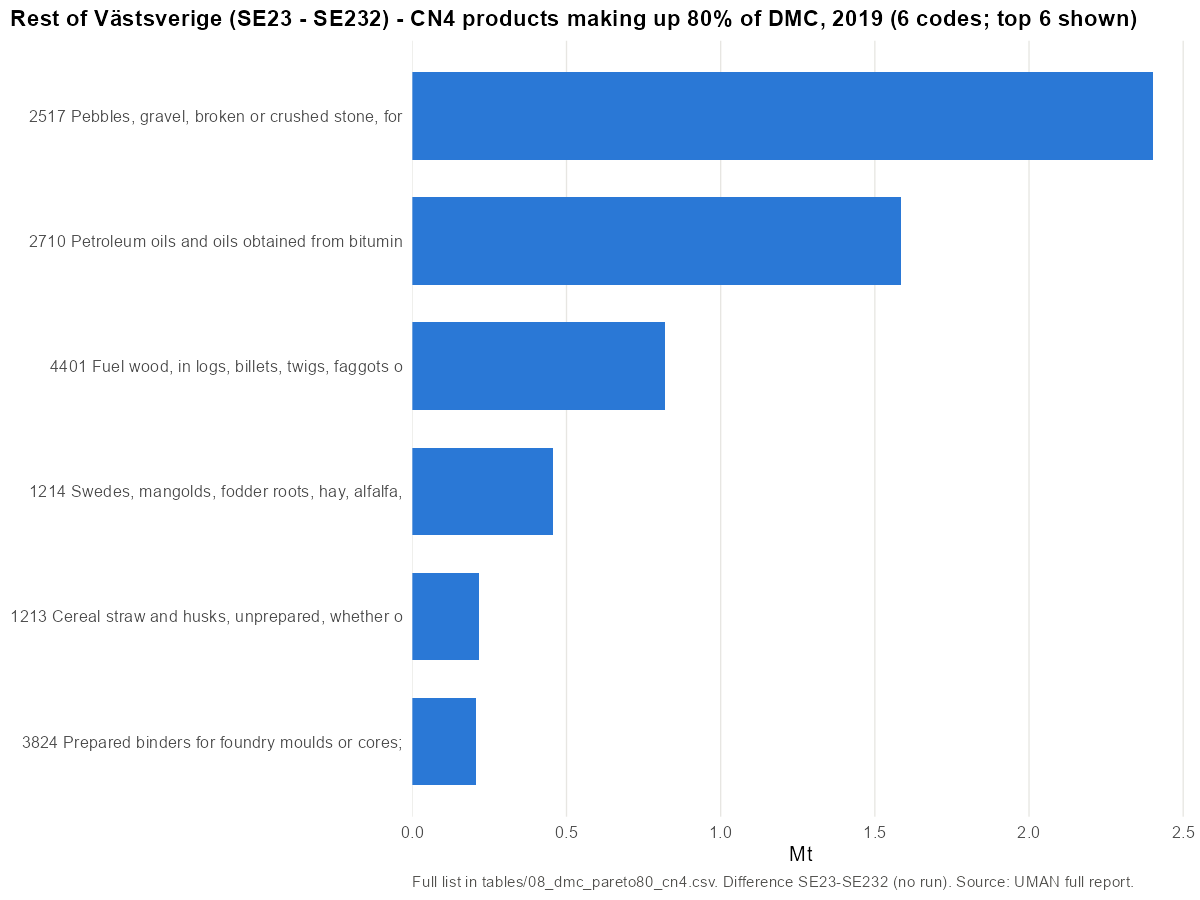
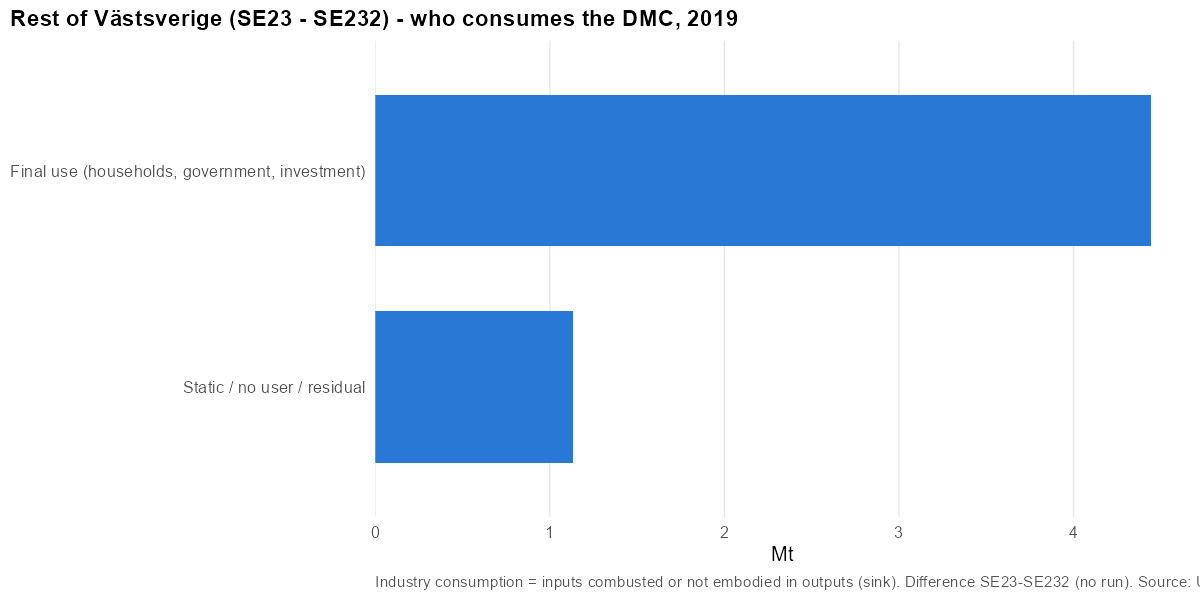
- Main CN4 codes (2019): 2517 Pebbles, gravel, broken or crushed stone, for concrete… (34%); 2710 Petroleum oils and oils obtained from bituminous minerals… (23%); 4401 Fuel wood, in logs, billets, twigs, faggots or similar… (12%); 1214 Swedes, mangolds, fodder roots, hay, alfalfa, clover… (6%); 1213 Cereal straw and husks, unprepared, whether or not chopped… (3%).
- Main materials: Stone (37%); Fuels (21%); Agriculture biomass (16%).
6 CN4 codes make up 80% of DMC in 2019. Top 10:
| Rank | CN4 | Product | Mt | Share | Cumulative |
|---|---|---|---|---|---|
| 1 | 2517 | Pebbles, gravel, broken or crushed stone, for concrete… | 2.40 | 34.3% | 34% |
| 2 | 2710 | Petroleum oils and oils obtained from bituminous minerals… | 1.58 | 22.6% | 57% |
| 3 | 4401 | Fuel wood, in logs, billets, twigs, faggots or similar… | 0.82 | 11.7% | 69% |
| 4 | 1214 | Swedes, mangolds, fodder roots, hay, alfalfa, clover… | 0.46 | 6.5% | 75% |
| 5 | 1213 | Cereal straw and husks, unprepared, whether or not chopped… | 0.22 | 3.1% | 78% |
| 6 | 3824 | Prepared binders for foundry moulds or cores; chemical… | 0.21 | 2.9% | 81% |
Metrics
| Year | DMC/cap | AR/cap | DE/cap | Import dep. | Intl import dep. | Self-suff. | Export int. |
|---|---|---|---|---|---|---|---|
| 2013 | 16.5 | 15.7 | 17.5 | – | 25% | 106% | – |
| 2014 | 29.5 | 32.5 | 17.5 | – | 24% | 60% | – |
| 2015 | 23.6 | 24.7 | 17.7 | – | 21% | 75% | – |
| 2016 | 29.8 | 30.4 | 19.3 | – | 19% | 65% | – |
| 2017 | 16.1 | 14.2 | 17.4 | – | 20% | 108% | – |
| 2018 | 19.6 | 22.4 | 15.6 | – | 25% | 79% | – |
| 2019 | 21.0 | 20.3 | 14.9 | – | 25% | 71% | – |
| 2020 | 16.0 | 16.9 | 14.8 | – | 21% | 93% | – |
| 2021 | 17.3 | 18.0 | 14.2 | – | 21% | 82% | – |
| 2022 | 23.4 | 24.3 | 14.1 | – | 23% | 60% | – |
Negative cells in 2019 (child > parent for a CN code): DE 0.00 Mt; M 0.00 Mt; X -0.00 Mt; dmc -0.98 Mt.
Rest of Västra Götaland (SE232 - 1480)
Sweden · rest-of · code SE232-1480 · rest (SE232 - GBG) · years 2013–2022
Findings
- Västra Götaland without Göteborg (1.15 million people) consumes 25.4 Mt or 22.2 t/cap in 2019, more than the city (19.1).
- It is the stone and refining hinterland: crushed stone is 64% of DMC (4 CN4 codes make up 80%). The Brofjorden refinery explains crude oil at 49% of imports and refined products at 59% of exports.
- DE is 20.9 t/cap, twice the city's 10.4.
- Caveat: negative DMC cells are 6.4% of DMC, and the difference of unbalanced outflows is negative (−2.8% of gross AR).
Overview
| 2013 | 2019 | 2022 | |
|---|---|---|---|
| Population | 1 081 813 | 1 146 600 | 1 161 815 |
| DE (Mt) | 21.5 | 24.0 | 24.5 |
| Imports M (Mt) | 11.0 | 11.8 | 13.7 |
| Exports X (Mt) | 9.0 | 8.7 | 9.4 |
| Domestic in NI (Mt) | – | – | – |
| Domestic out NO (Mt) | – | – | – |
| AR (Mt) | 23.0 | 26.5 | 24.9 |
| DMC (Mt) | 23.7 | 25.4 | 23.1 |
| DMC (t/cap) | 21.9 | 22.2 | 19.8 |
| Unbalanced (% of gross AR) | 2.2% | -2.8% | -4.8% |
Domestic extraction
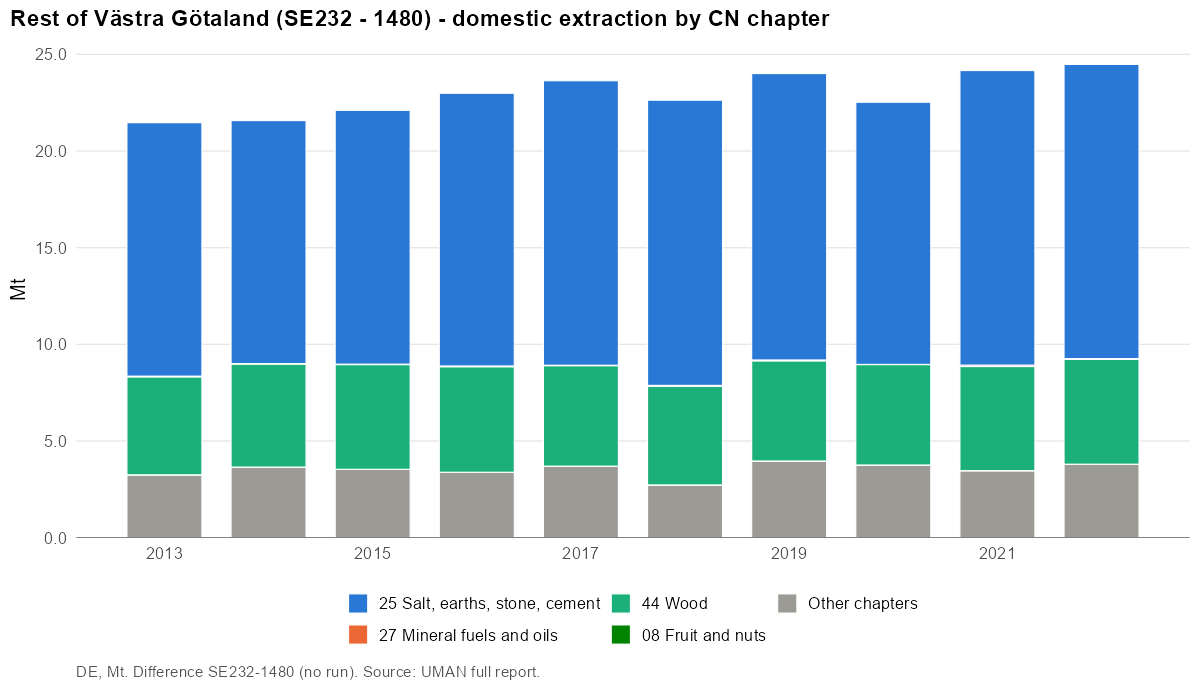
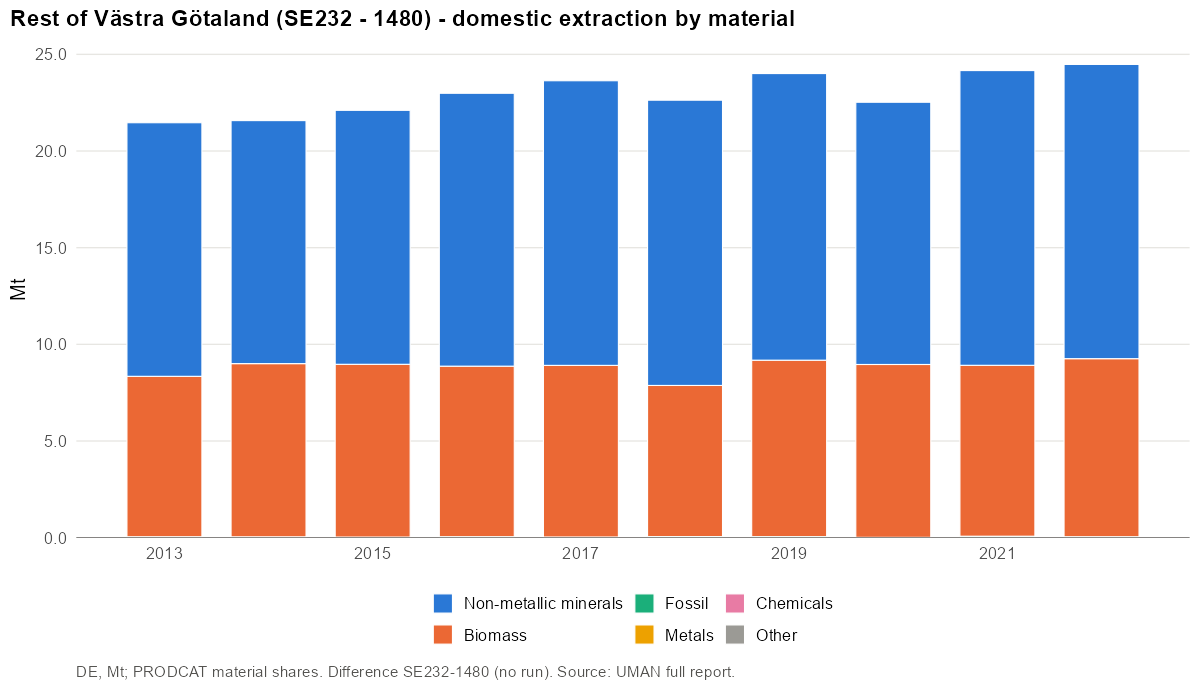
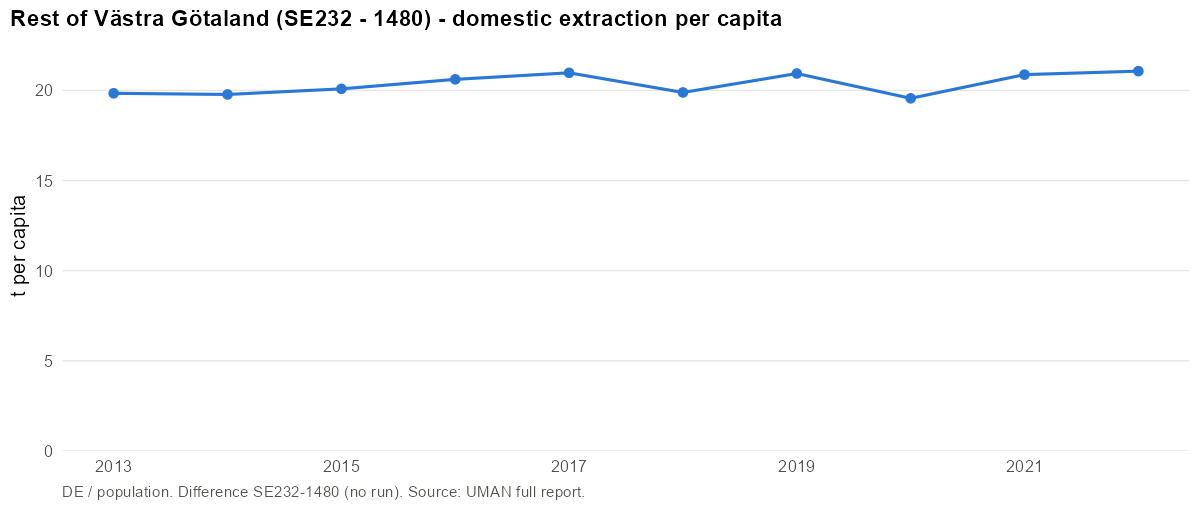
- Main CN4 codes (2019): 2517 Pebbles, gravel, broken or crushed stone, for concrete… (59%); 4403 Wood in the rough, whether or not stripped of bark or… (20%); 1214 Swedes, mangolds, fodder roots, hay, alfalfa, clover… (4%); 1213 Cereal straw and husks, unprepared, whether or not chopped… (3%); 1001 Wheat and meslin (3%).
- Main materials: Stone (60%); Wood and wood fuels (22%); Agriculture biomass (14%).
International trade
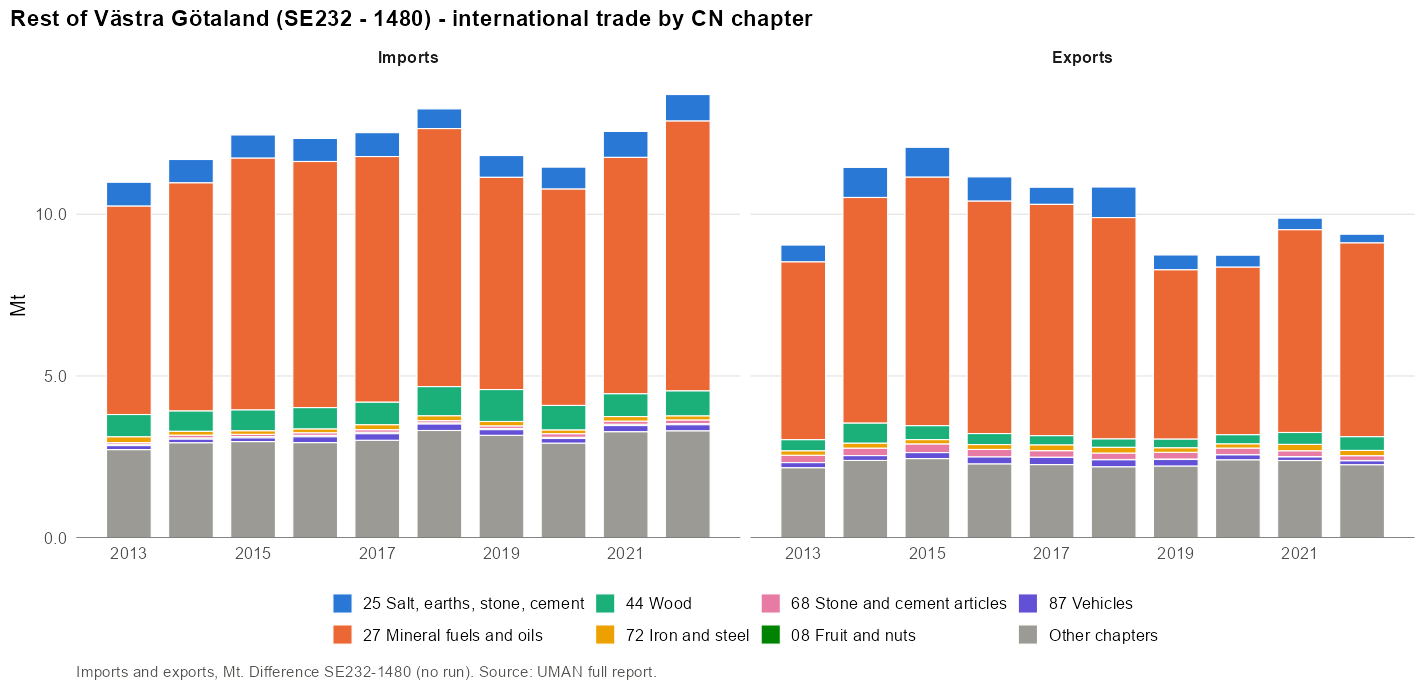
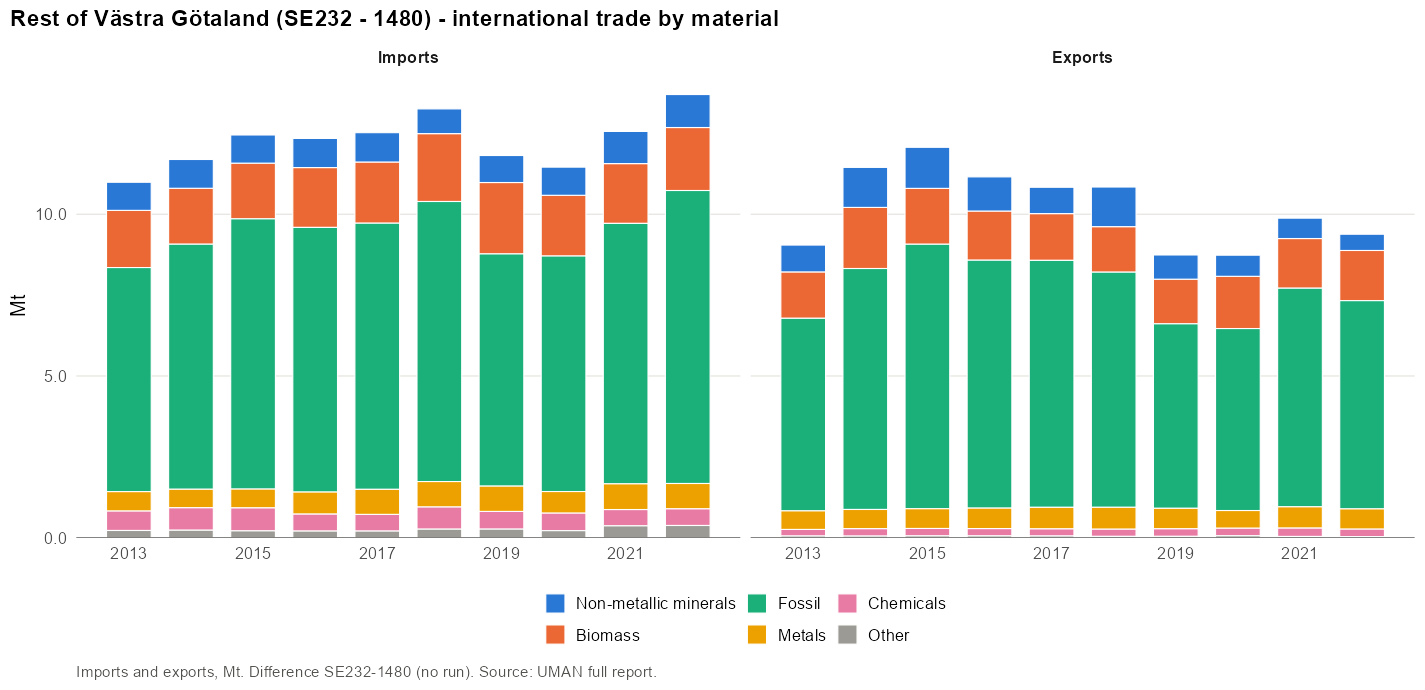
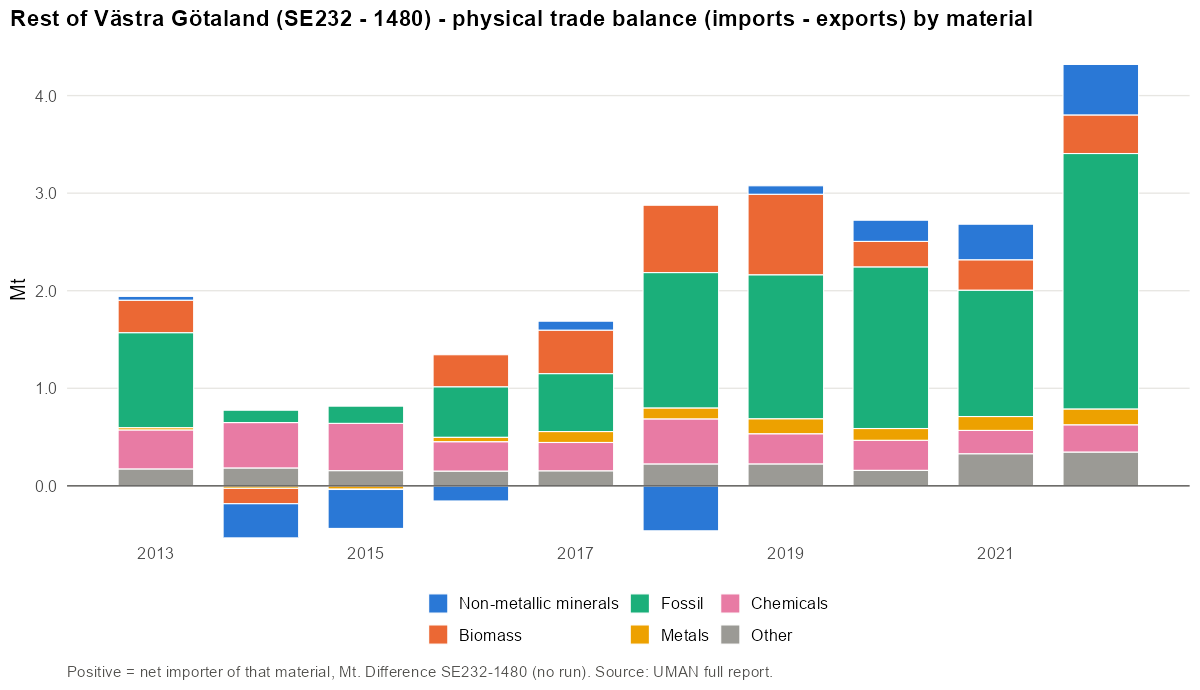
Imports:
- Main CN4 codes (2019): 2709 Petroleum oils and oils obtained from bituminous minerals… (49%); 2710 Petroleum oils and oils obtained from bituminous minerals… (5%); 4403 Wood in the rough, whether or not stripped of bark or… (5%); 4401 Fuel wood, in logs, billets, twigs, faggots or similar… (2%); 2501 Salts, incl. table salt and denatured salt, and pure sodium… (2%).
- Main materials: Plastics and rubbers (17%); Fuels (16%); Lubricants, oils and solvents (14%).
Exports:
- Main CN4 codes (2019): 2710 Petroleum oils and oils obtained from bituminous minerals… (59%); 6810 Articles of cement, concrete or artificial stone, whether… (2%); 1001 Wheat and meslin (2%); 2516 Granite, porphyry, basalt, sandstone and other monumental… (2%); 2523 Cement, incl. cement clinkers, whether or not coloured (2%).
- Main materials: Fuels (55%); Paper and board (6%); Iron, steel and ferro-alloys (6%).
Domestic movement of goods
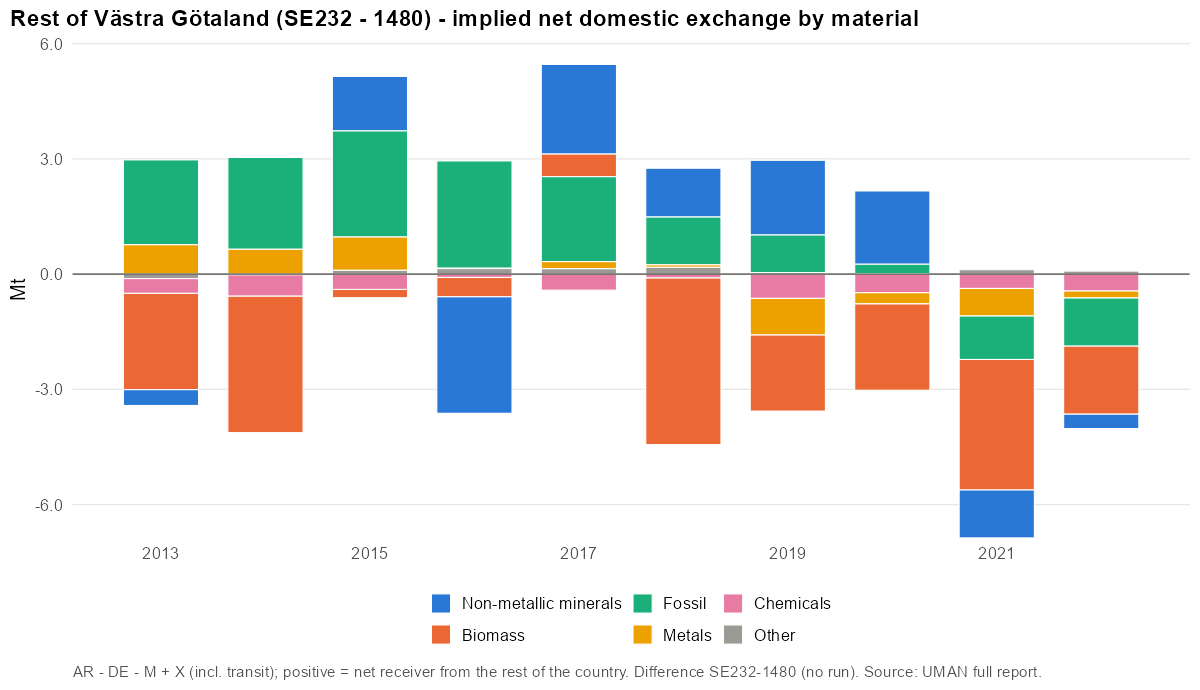
Gross domestic flows of a rest-of territory cannot be obtained by difference; only the implied net exchange is shown.
Available resources
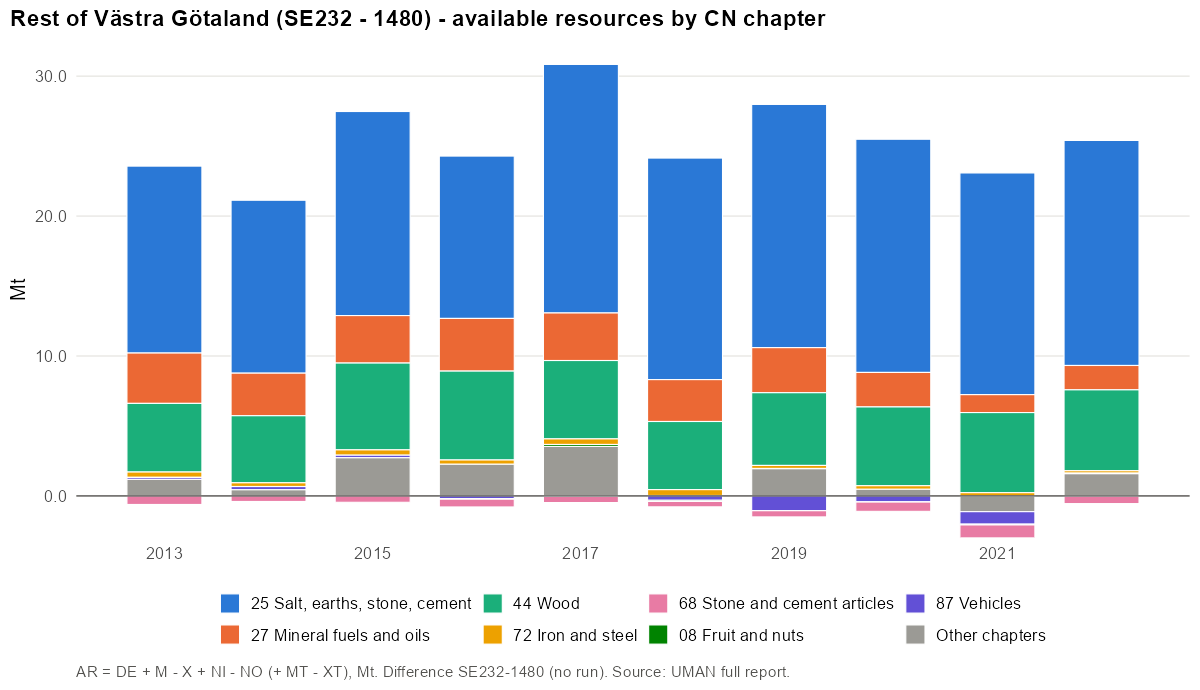
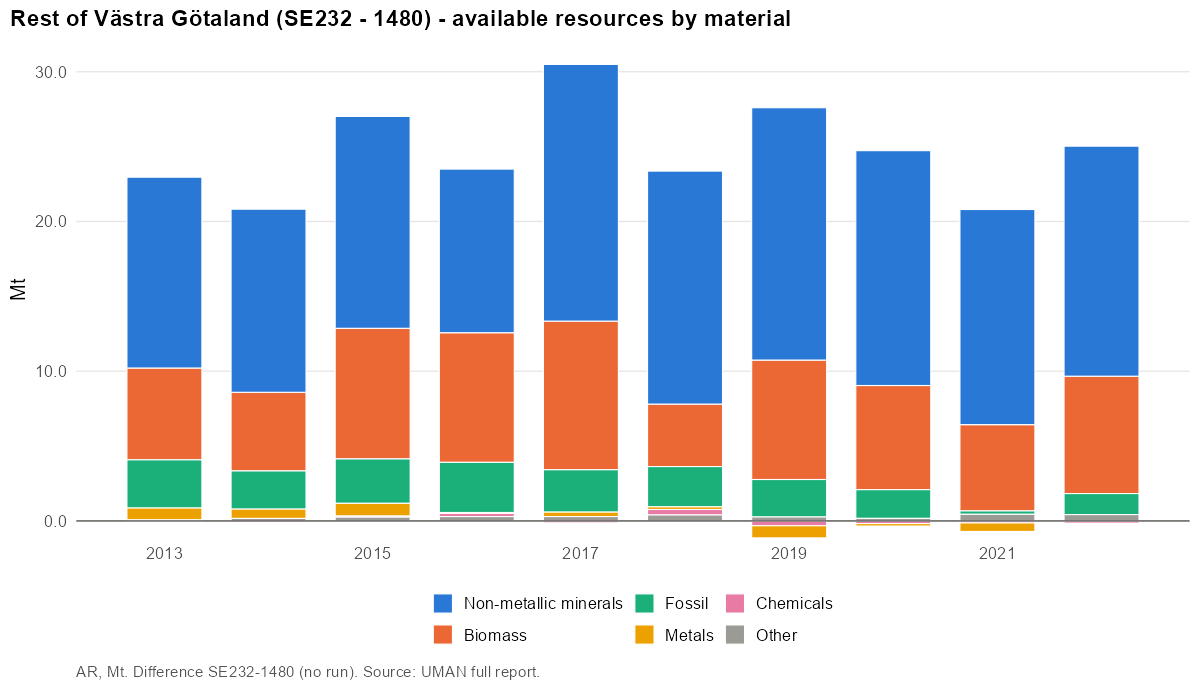
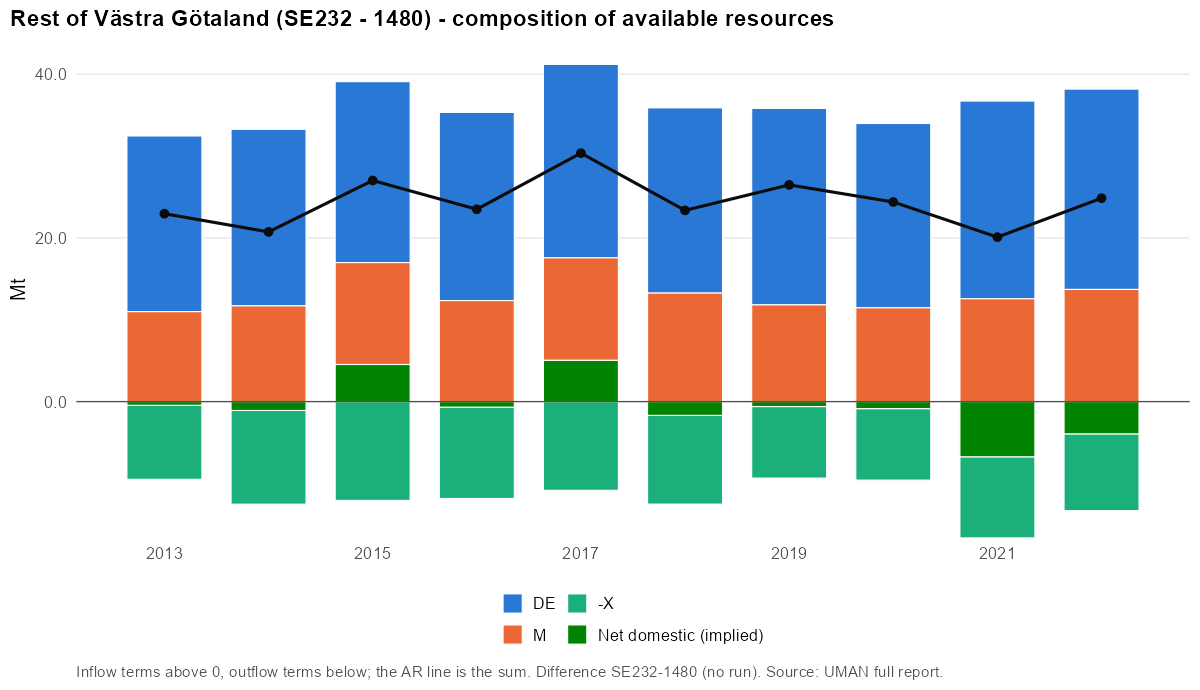
- Main CN4 codes (2019): 2517 Pebbles, gravel, broken or crushed stone, for concrete… (62%); 2709 Petroleum oils and oils obtained from bituminous minerals… (25%); 4403 Wood in the rough, whether or not stripped of bark or… (17%); 2505 Natural sands of all kinds, whether or not coloured (excl.… (3%); 4401 Fuel wood, in logs, billets, twigs, faggots or similar… (3%).
- Main materials: Stone (61%); Wood and wood fuels (20%); Agriculture biomass (9%).
Industrial production
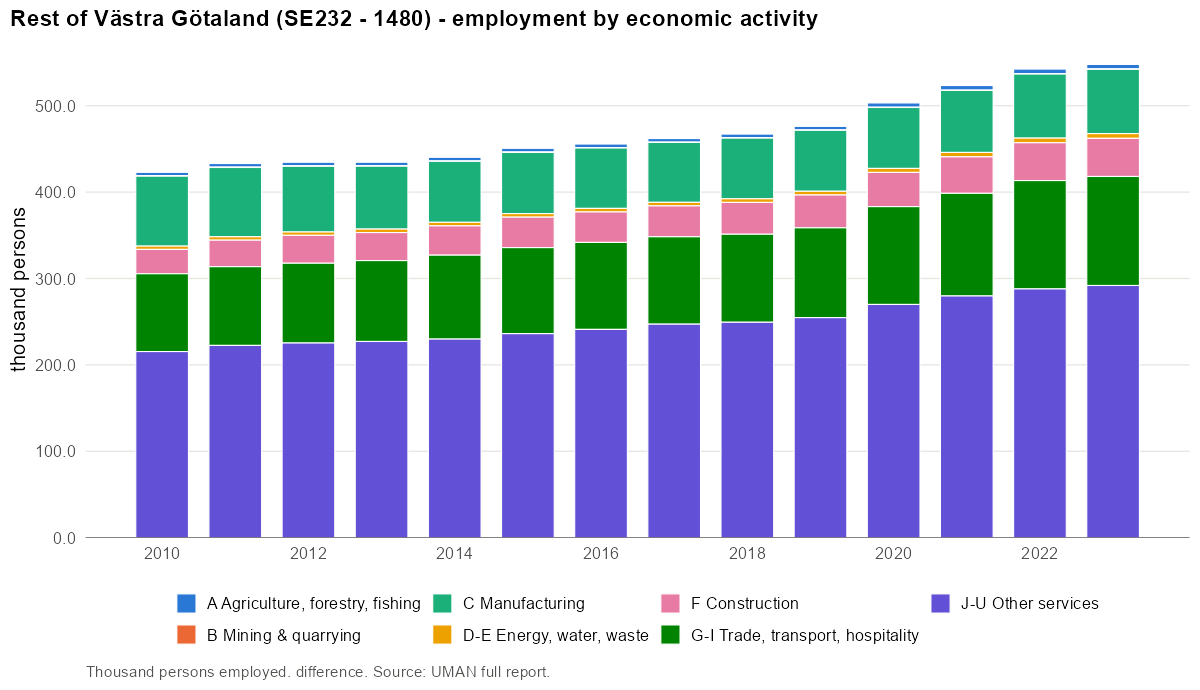
Production and the NACE-CN Sankey require a run; not available for a rest-of territory.
Largest employers (NACE divisions):
| NACE | Activity | Persons | Share |
|---|---|---|---|
| 85 | Education | 52 284 | 11.0% |
| 88 | Social work activities without accommodation | 33 141 | 7.0% |
| 86 | Human health activities | 31 398 | 6.6% |
| 47 | Retail trade, except of motor vehicles and motorcycles | 31 255 | 6.6% |
| 87 | Residential care activities | 29 468 | 6.2% |
| 43 | Specialised construction activities | 26 068 | 5.5% |
| 84 | Public administration and defence; compulsory social security | 25 324 | 5.3% |
| 46 | Wholesale trade, except of motor vehicles and motorcycles | 23 680 | 5.0% |
Product transformation
Product transformation requires a run; not available for a rest-of territory.
Domestic material consumption
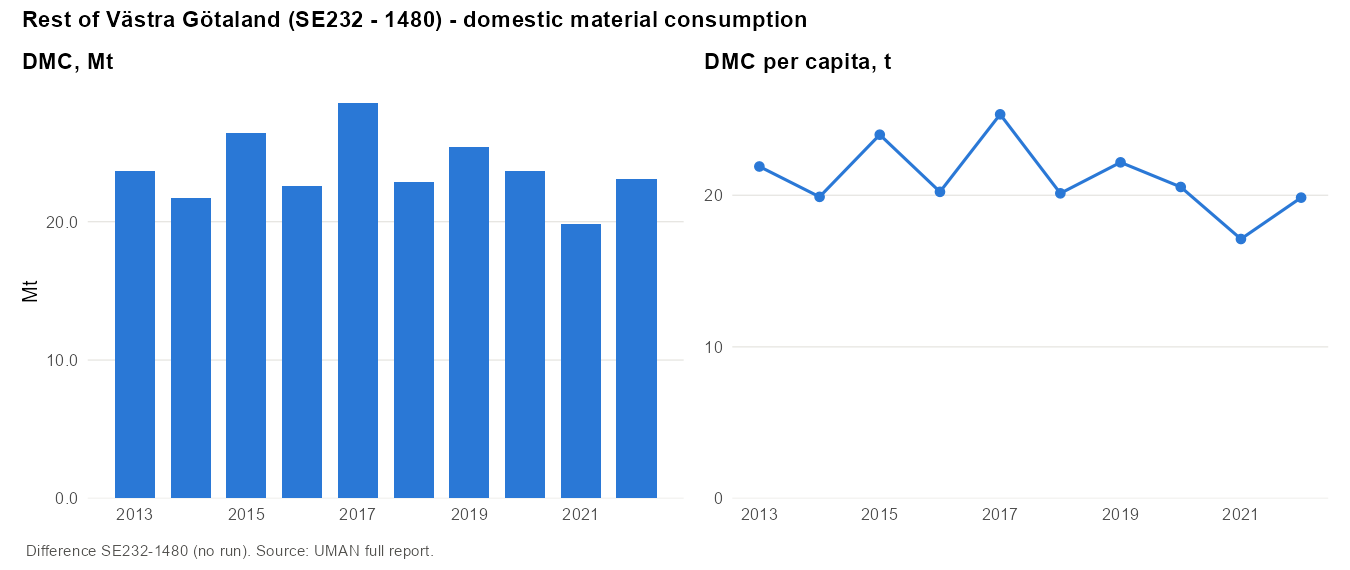
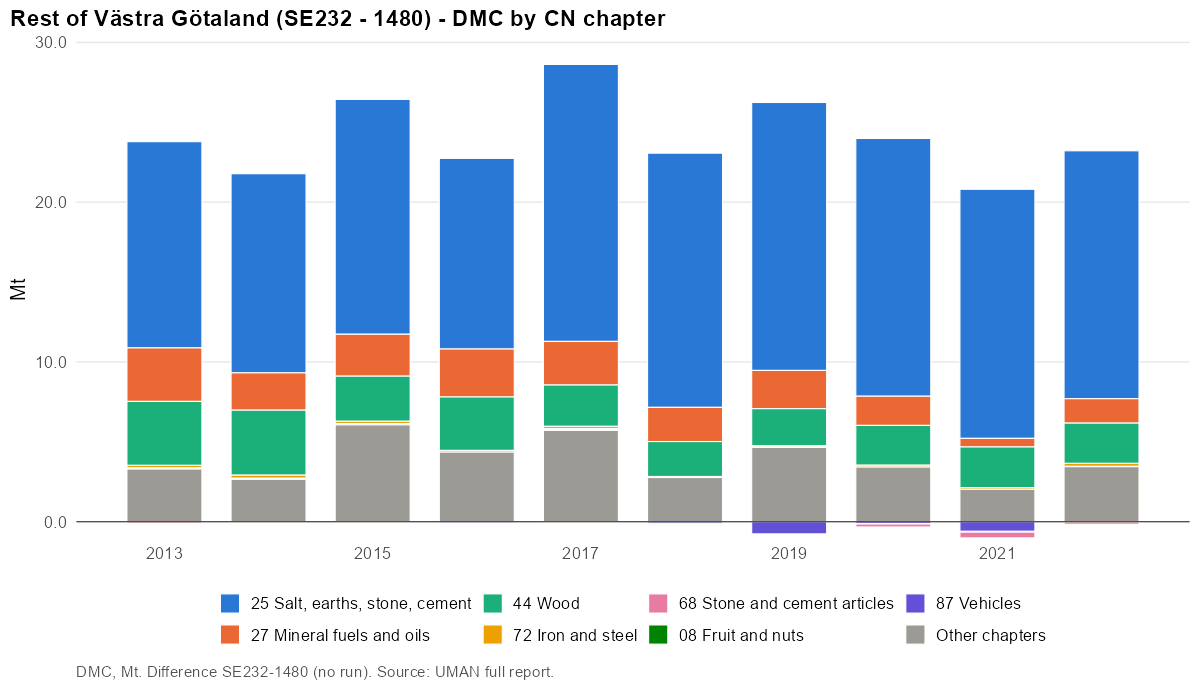
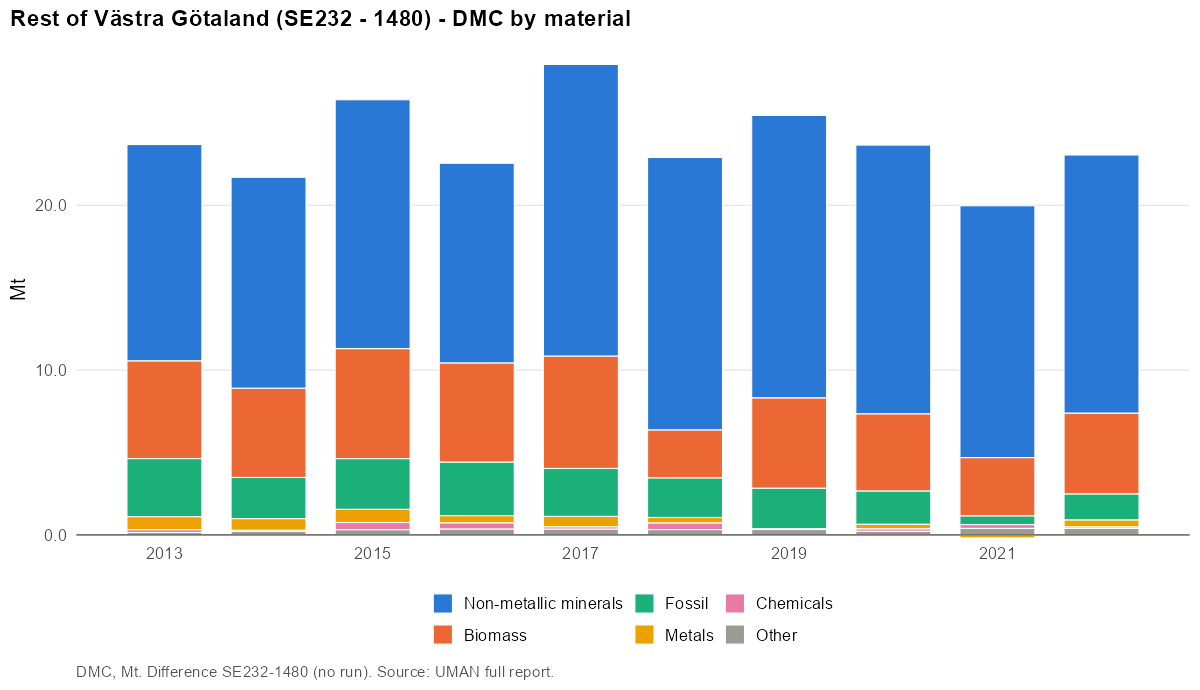
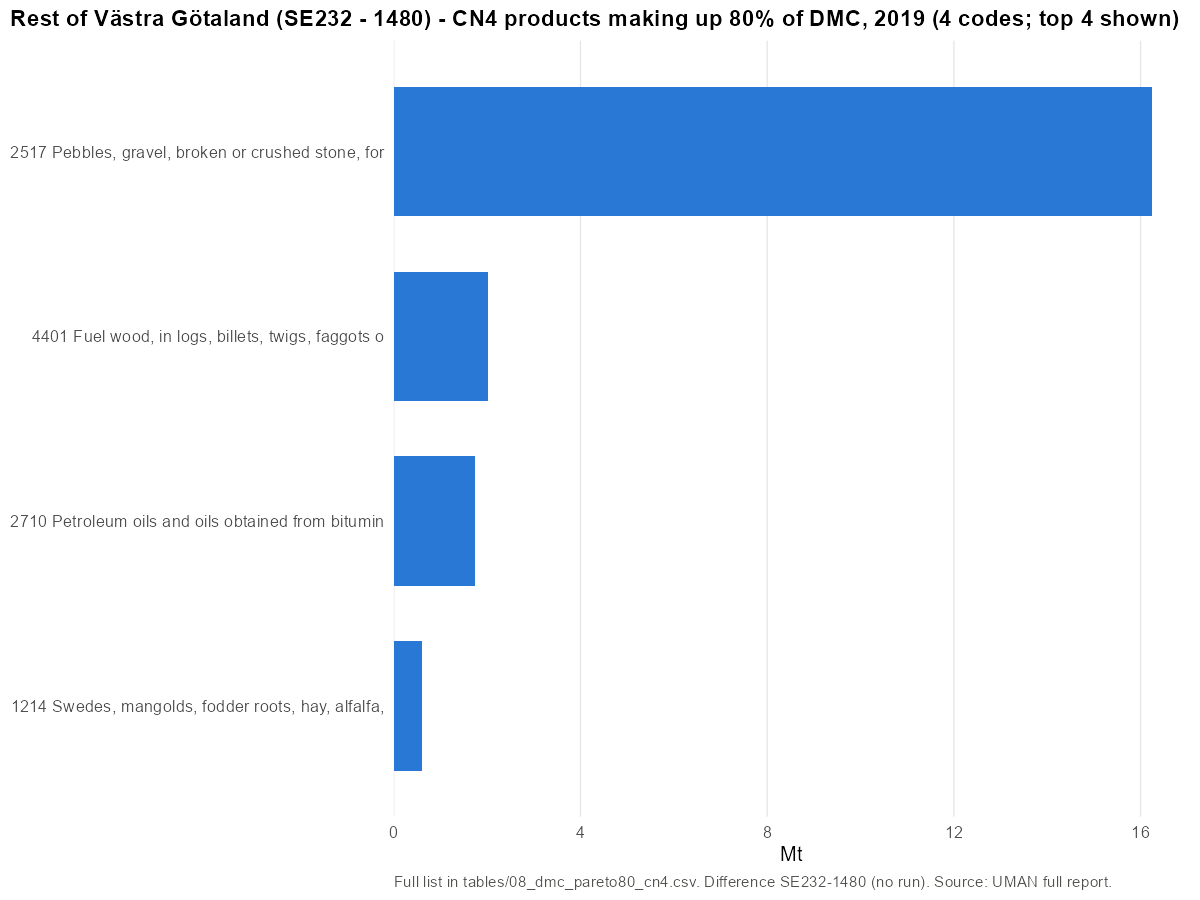
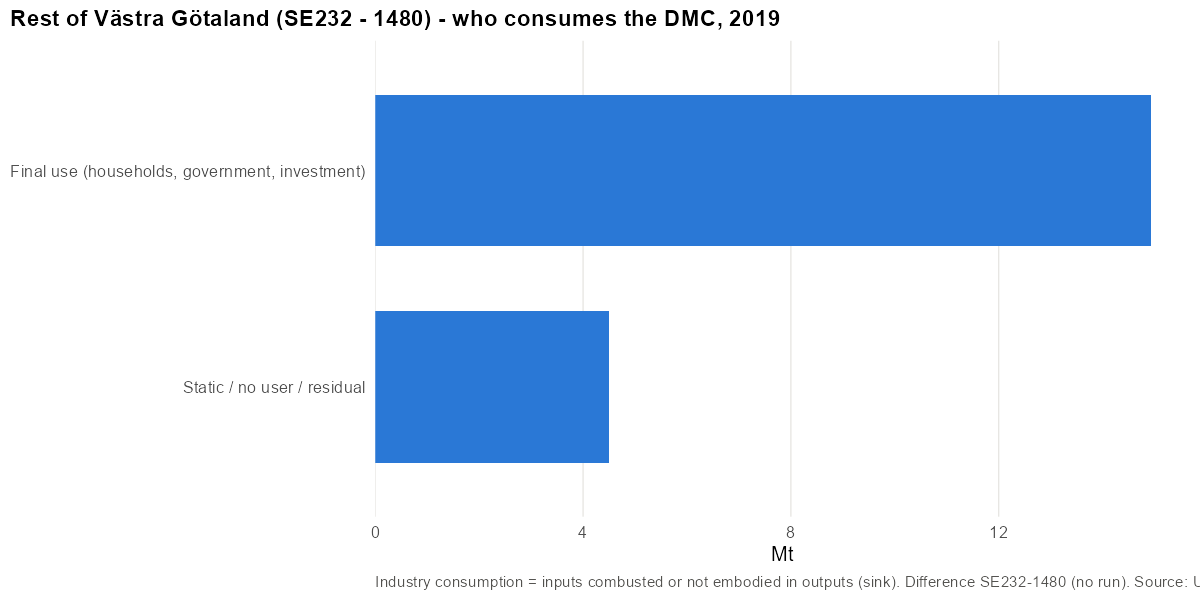
- Main CN4 codes (2019): 2517 Pebbles, gravel, broken or crushed stone, for concrete… (64%); 4401 Fuel wood, in logs, billets, twigs, faggots or similar… (8%); 2710 Petroleum oils and oils obtained from bituminous minerals… (7%); 1214 Swedes, mangolds, fodder roots, hay, alfalfa, clover… (2%); 2505 Natural sands of all kinds, whether or not coloured (excl.… (2%).
- Main materials: Stone (64%); Wood and wood fuels (10%); Agriculture biomass (8%).
4 CN4 codes make up 80% of DMC in 2019. Top 10:
| Rank | CN4 | Product | Mt | Share | Cumulative |
|---|---|---|---|---|---|
| 1 | 2517 | Pebbles, gravel, broken or crushed stone, for concrete… | 16.24 | 63.9% | 64% |
| 2 | 4401 | Fuel wood, in logs, billets, twigs, faggots or similar… | 2.03 | 8.0% | 72% |
| 3 | 2710 | Petroleum oils and oils obtained from bituminous minerals… | 1.74 | 6.8% | 79% |
| 4 | 1214 | Swedes, mangolds, fodder roots, hay, alfalfa, clover… | 0.61 | 2.4% | 81% |
Metrics
| Year | DMC/cap | AR/cap | DE/cap | Import dep. | Intl import dep. | Self-suff. | Export int. |
|---|---|---|---|---|---|---|---|
| 2013 | 21.9 | 21.2 | 19.8 | – | 34% | 91% | – |
| 2014 | 19.9 | 19.0 | 19.8 | – | 35% | 99% | – |
| 2015 | 24.0 | 24.6 | 20.1 | – | 36% | 84% | – |
| 2016 | 20.2 | 21.1 | 20.6 | – | 35% | 102% | – |
| 2017 | 25.3 | 26.9 | 21.0 | – | 35% | 83% | – |
| 2018 | 20.1 | 20.5 | 19.9 | – | 37% | 99% | – |
| 2019 | 22.2 | 23.1 | 20.9 | – | 33% | 94% | – |
| 2020 | 20.5 | 21.2 | 19.6 | – | 34% | 95% | – |
| 2021 | 17.1 | 17.4 | 20.9 | – | 34% | 122% | – |
| 2022 | 19.8 | 21.4 | 21.1 | – | 36% | 106% | – |
Negative cells in 2019 (child > parent for a CN code): DE 0.00 Mt; M 0.00 Mt; X 0.00 Mt; dmc -1.62 Mt.
Comparison across scales
Method · Italy · Portugal · Sweden · Comparison · About
- National DMC per capita follows extraction. Sweden (21.9 t/cap), Portugal (10.9) and Italy (7.6) rank as their domestic extraction per capita does (21.5, 7.8, 4.4). Italy compensates for low extraction with imports (54% dependency).
- Scale changes openness, not intensity (Sweden). DMC per capita stays between 19 and 23 t/cap at every Swedish scale and in every rest-of territory. Import dependency rises steadily as the territory shrinks: 28% (Sweden), 47% (SE2), 60% (SE23), 61% (SE232), 84% (Göteborg). International dependency follows (28% → 54%).
- City and hinterland differ in kind. Göteborg (19.1 t/cap) consumes less per capita than the rest of Västra Götaland (22.2), and differently: more fossil (23%) and metals (18%), less stone. The city handles domestic flows of more than twice its DMC; the hinterland extracts and refines.
- Regions can be far from their country. Bolzano (20.8 t/cap) against the rest of Italy (7.5), and Centro (12.8) against the rest of Portugal (10.3). In both cases the region extracts more per capita than the country (wood and fruit; stone) and ships part of it to the rest of the country.
- Composition is local. Non-metallic minerals are the largest group everywhere except Bolzano, where biomass leads (52%). Fossil materials concentrate where refineries and energy ports are: Italy 30%, Göteborg 23%, rest of Portugal 21%, West Sweden 15%. Elsewhere they are 4–9%.
- Results get less certain at smaller scales. The unbalanced share rises from 2% (Sweden) to 5% (regions) and 19% (Göteborg). Rest-of differences are reliable for large remainders (rest of Italy, rest of Sweden: negative cells ≤1.5% of DMC). They become fragile for small ones (rest of VGR 6.4%, Halland 14%). Small rest-of territories need runs of their own before their numbers are used.
- Downscaling hides local profiles. Coimbra (tier C, 12.1 t/cap) is a scaled copy of Centro. The Swedish municipal results show how different a local profile can be from its region's (Göteborg against VGR), so tier C values should be treated as placeholders.
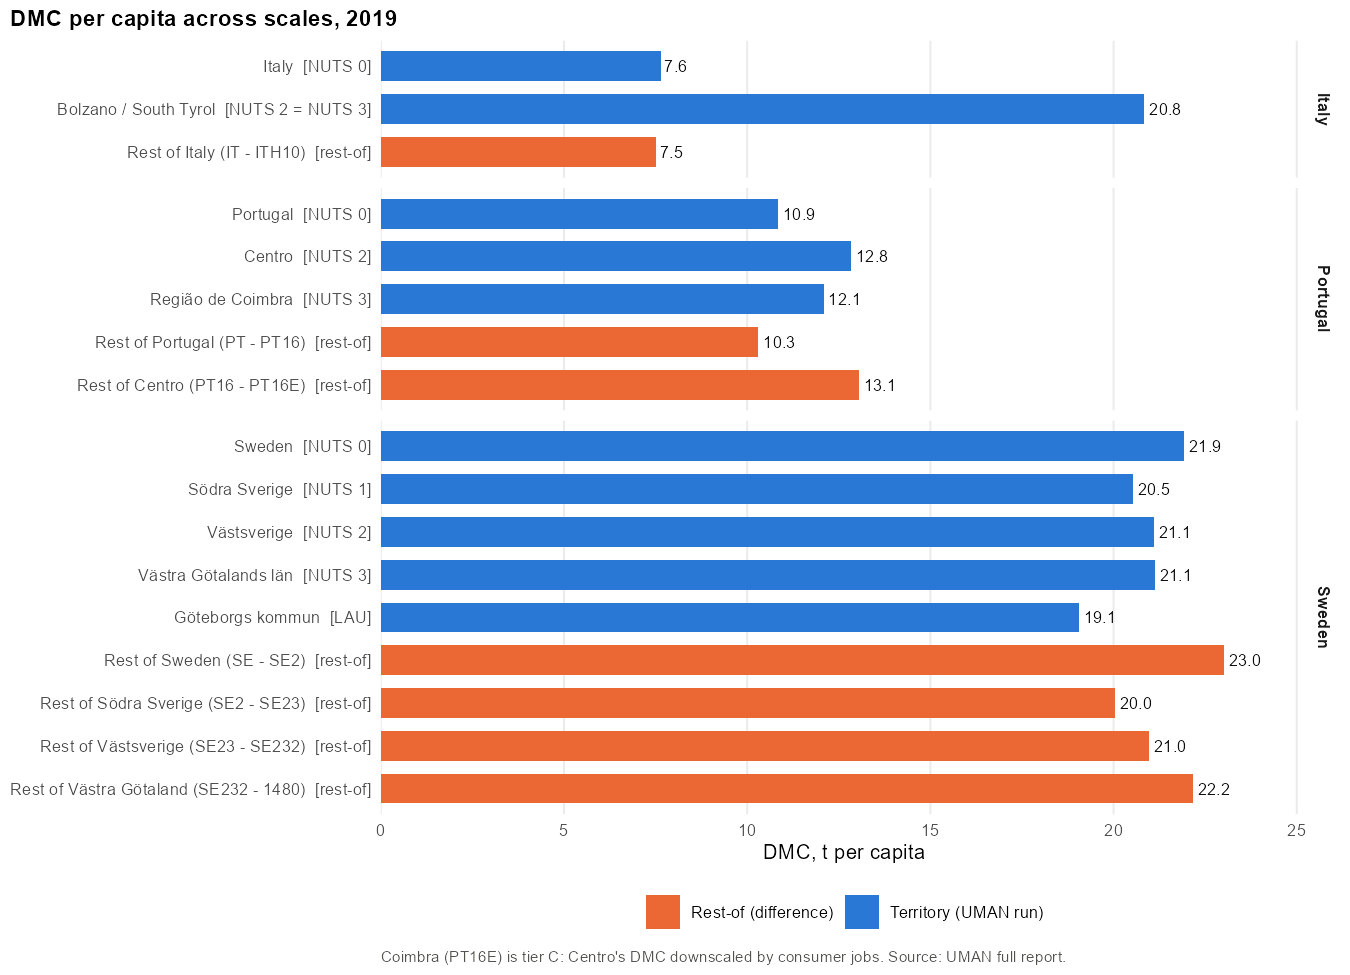
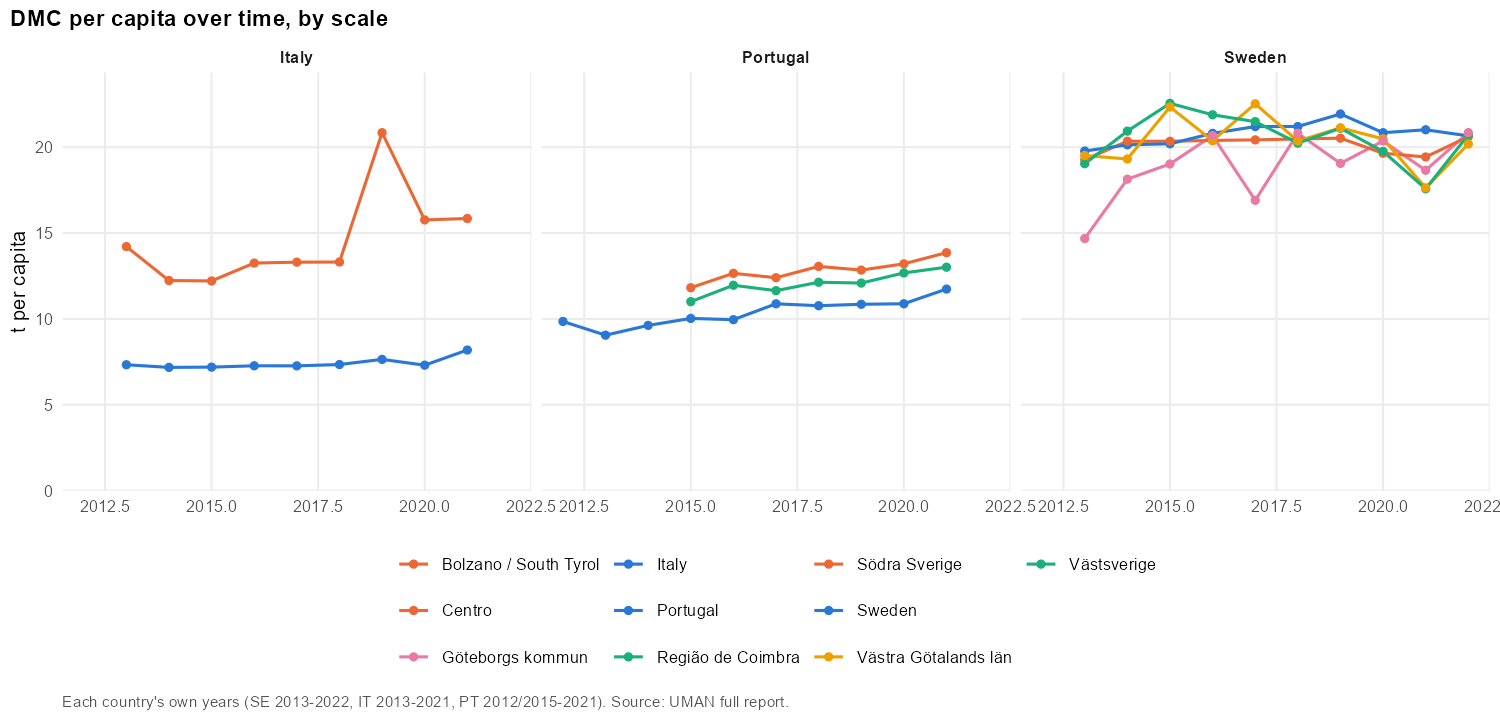
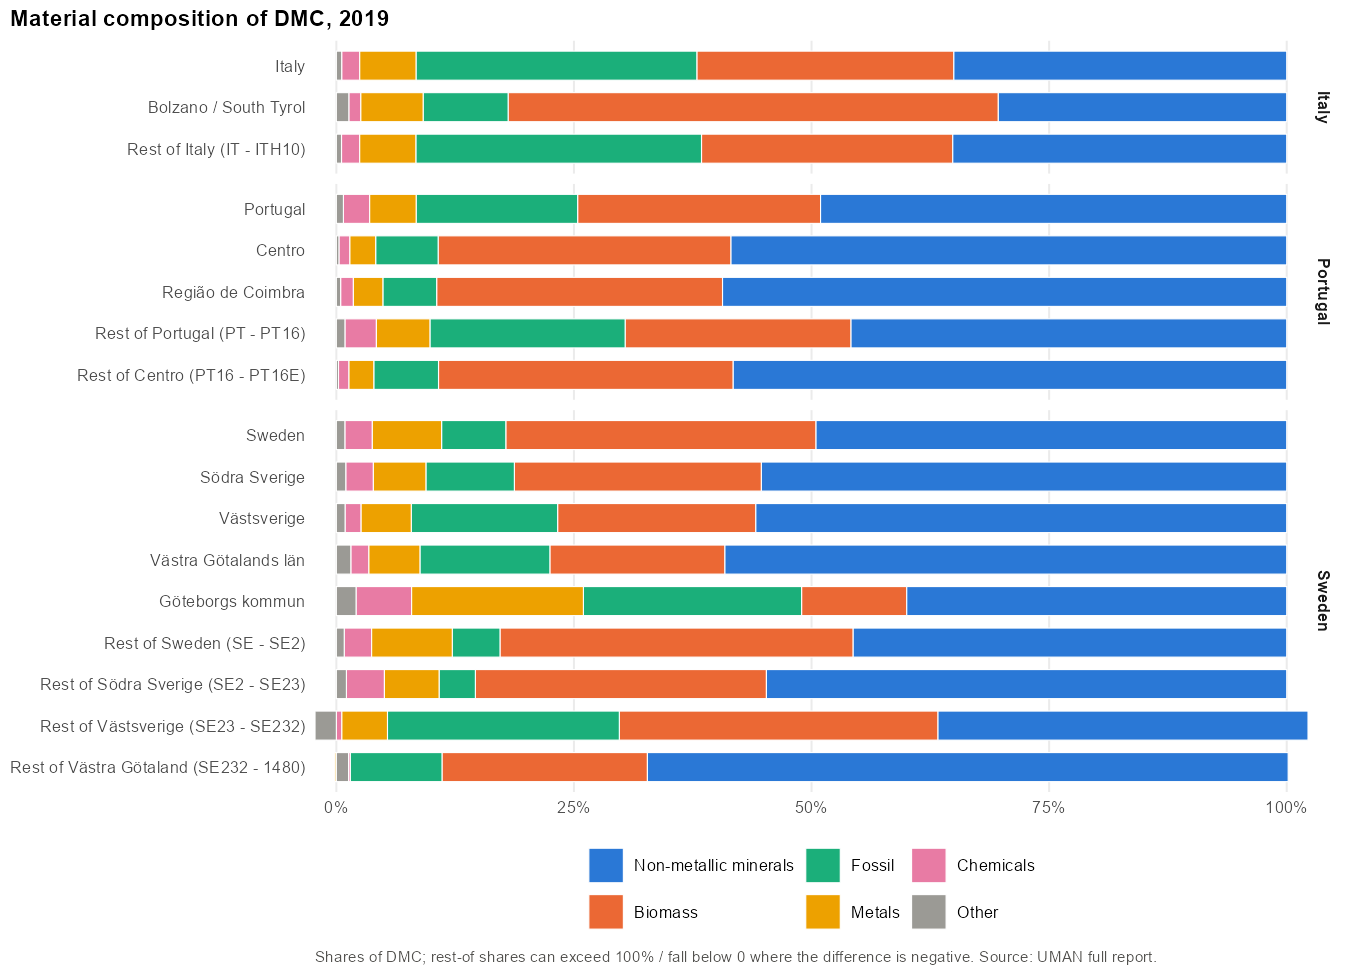
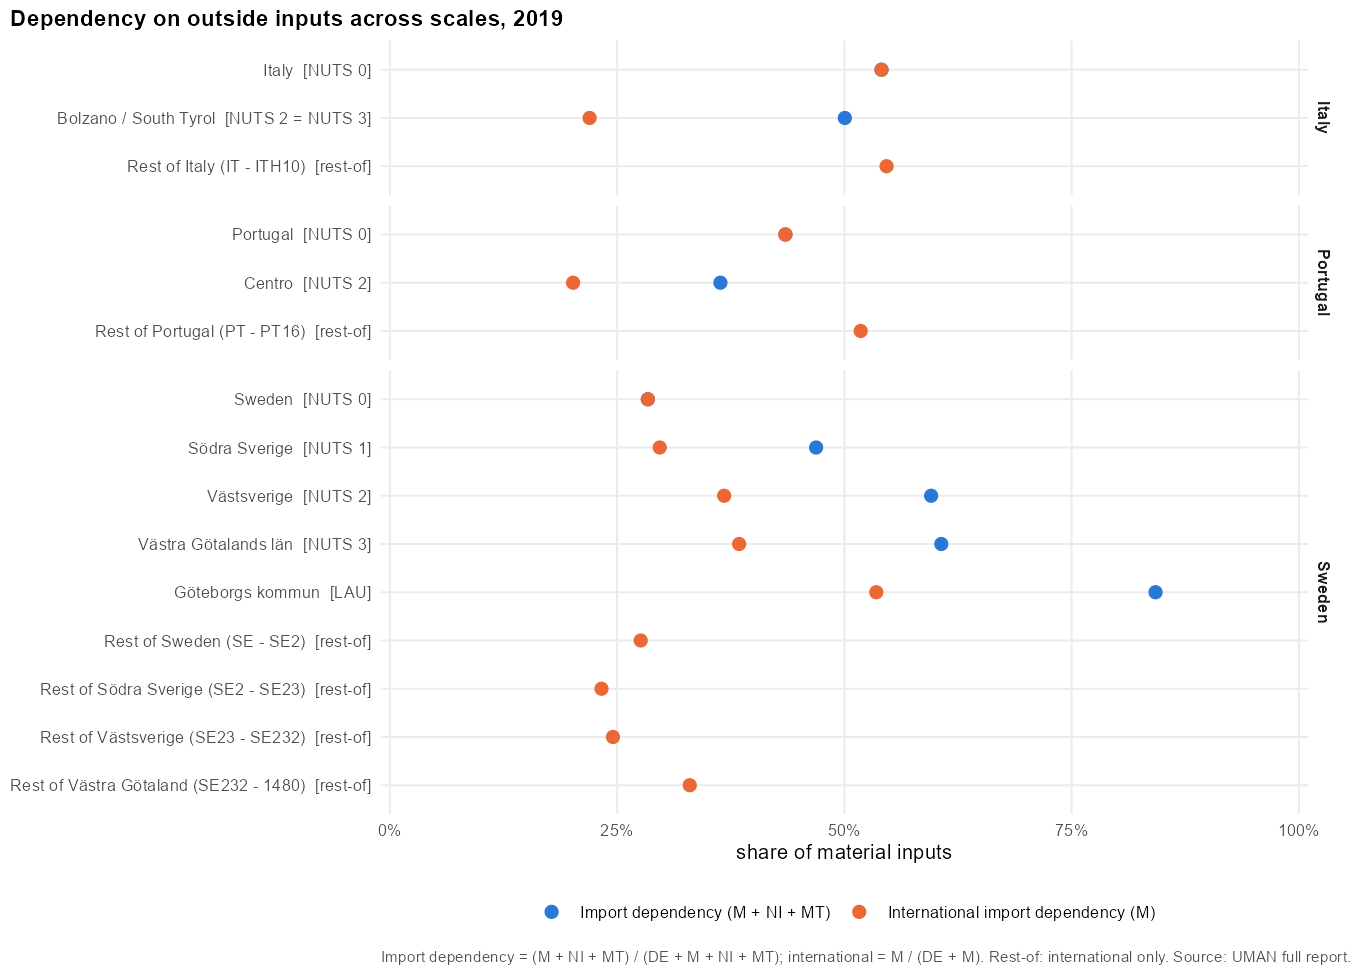
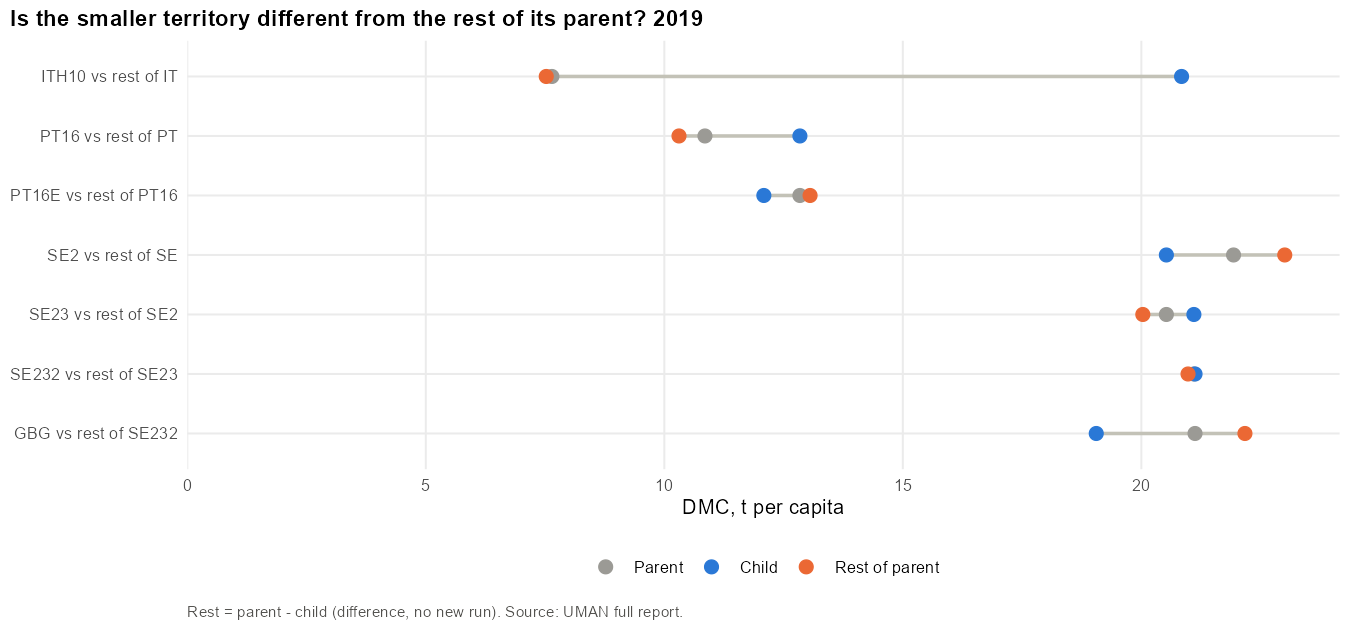
Key figures 2019 (by country and level; rest-of territories after the base territories)
| Country | Territory | Level | Tier | Population | DMC (Mt) | DMC/cap | AR/cap | Unbal. | Import dep. | Intl dep. |
|---|---|---|---|---|---|---|---|---|---|---|
| Italy | Italy | NUTS 0 | A | 59 816 673 | 457.2 | 7.6 | 7.2 | 5.2% | 54% | 54% |
| Italy | Bolzano / South Tyrol | NUTS 2 = NUTS 3 | A | 530 313 | 11.1 | 20.8 | 20.6 | 1.3% | 50% | 22% |
| Italy | Rest of Italy (IT - ITH10) | rest-of | rest (IT - ITH10) | 59 286 360 | 446.1 | 7.5 | 7.1 | 5.3% | – | 55% |
| Portugal | Portugal | NUTS 0 | A | 10 375 395 | 112.6 | 10.9 | 10.0 | 6.9% | 44% | 44% |
| Portugal | Centro | NUTS 2 | A | 2 226 188 | 28.6 | 12.8 | 11.9 | 6.0% | 36% | 20% |
| Portugal | Região de Coimbra | NUTS 3 | C | 489 761 | 5.9 | 12.1 | – | – | – | – |
| Portugal | Rest of Portugal (PT - PT16) | rest-of | rest (PT - PT16) | 8 149 207 | 84.0 | 10.3 | 9.5 | 7.0% | – | 52% |
| Portugal | Rest of Centro (PT16 - PT16E) | rest-of | rest (PT16 - PT16E) | 1 736 427 | 22.7 | 13.1 | – | – | – | – |
| Sweden | Sweden | NUTS 0 | A | 10 327 589 | 226.5 | 21.9 | 21.4 | 2.0% | 28% | 28% |
| Sweden | Södra Sverige | NUTS 1 | A | 4 467 362 | 91.7 | 20.5 | 19.3 | 4.8% | 47% | 30% |
| Sweden | Västsverige | NUTS 2 | A | 2 059 729 | 43.5 | 21.1 | 19.8 | 4.7% | 60% | 37% |
| Sweden | Västra Götalands län | NUTS 3 | A | 1 725 881 | 36.5 | 21.1 | 19.6 | 4.9% | 61% | 38% |
| Sweden | Göteborgs kommun | LAU | A | 579 281 | 11.0 | 19.1 | 12.8 | 19.3% | 84% | 54% |
| Sweden | Rest of Sweden (SE - SE2) | rest-of | rest (SE - SE2) | 5 860 227 | 134.8 | 23.0 | 23.0 | -0.1% | – | 28% |
| Sweden | Rest of Södra Sverige (SE2 - SE23) | rest-of | rest (SE2 - SE23) | 2 407 633 | 48.2 | 20.0 | 18.9 | 4.6% | – | 23% |
| Sweden | Rest of Västsverige (SE23 - SE232) | rest-of | rest (SE23 - SE232) | 333 848 | 7.0 | 21.0 | 20.3 | 2.1% | – | 25% |
| Sweden | Rest of Västra Götaland (SE232 - 1480) | rest-of | rest (SE232 - GBG) | 1 146 600 | 25.4 | 22.2 | 23.1 | -2.8% | – | 33% |
Cross-scale consistency, 2019: negative cells of the rest-of territories (Mt; child > parent for a CN code), by country and level.
| Country | Territory | DE | M | X | DMC | Neg. DMC as % of DMC |
|---|---|---|---|---|---|---|
| Italy | Rest of Italy (IT - ITH10) | -0.01 | -0.00 | -0.00 | -0.33 | 0.1% |
| Portugal | Rest of Portugal (PT - PT16) | -0.08 | -0.08 | -0.04 | -2.39 | 2.8% |
| Portugal | Rest of Centro (PT16 - PT16E) | 0.00 | 0.00 | 0.00 | -0.10 | 0.4% |
| Sweden | Rest of Sweden (SE - SE2) | -1.44 | -0.00 | -0.00 | -2.08 | 1.5% |
| Sweden | Rest of Södra Sverige (SE2 - SE23) | 0.00 | 0.00 | 0.00 | -0.99 | 2.1% |
| Sweden | Rest of Västsverige (SE23 - SE232) | 0.00 | 0.00 | -0.00 | -0.98 | 13.9% |
| Sweden | Rest of Västra Götaland (SE232 - 1480) | 0.00 | 0.00 | 0.00 | -1.62 | 6.4% |
Limitations and data gaps
- Bolzano: trade tonnes estimated from € with Italian unit values; the use structure is borrowed from Portugal; no rail on the Brenner corridor.
- Italy: ASIA employment does not cover agriculture, forestry and fishing (section A).
- Coimbra: tier C (no own accounts); 15–31% of employment imputed from confidential cells; population boundary to check.
- Sweden: DE observed only for Sweden and VGR (downscaled by jobs elsewhere, which produces small negative DE cells for the rest of Sweden); rail observed only for VGR; port transit included in NI/NO and a lower bound (Varberg SEVA1 and Trollhättan SE965 are missing from the port list); register employment jumps ~10% in 2021 (likely a definition change).
- SE2: port 'Löten' (SELOT, 0.6 Mt domestic, 2019) could not be located and is left out.
- Rest-of territories: gross domestic flows, production and the flush cannot be obtained by difference.
- Model: industry inputs are estimated from imports, so inputs sourced locally can be underestimated (D1.3).
- Years: the window differs by country (Italy 2013–2021, Portugal 2012/2015–2021, Sweden 2013–2022).
- Bolzano 2019 is inflated by the Vaia storm windthrow (+3 Mt of roundwood). Use 2018 or 2021 when a typical year is needed.
- Centro 2021: road freight tonnage jumps by about 60%, which affects domestic flows and DMC.
- Rest-of territories inherit the errors of both runs. Treat small remainders (Halland, rest of VGR) with caution.
About
Method · Italy · Portugal · Sweden · Comparison · About
Hej hej! My name is Jonathan Cohen.
This work is framed within ECLECTIC – Enabling circular economy action plans for small and medium-sized cities, a project of the Driving Urban Transitions (DUT) Partnership, funded by Formas, FCT, LMT and MUR and co-funded by the European Union (November 2023 – November 2026). ECLECTIC works with city-region living labs in Bolzano/South Tyrol (Italy), Coimbra (Portugal), Gothenburg (Sweden) and Jonava (Lithuania). The method builds on ECLECTIC deliverable D1.3, Monitoring scheme for Circular Economy action plans in cities (Cohen and Rosado, Chalmers University of Technology).
DOI: to be added
Data. The data come from Statistics Sweden (SCB) and Trafikanalys, the Italian National Institute of Statistics (ISTAT), Statistics Portugal (INE) and Eurostat. Results are model estimates; see Limitations.
Get in touch
If you have comments or suggestions, or want to collaborate on a similar project, feel free to reach out. I'm always happy to talk data, cities and tech!
| jonathan@nodal.se · cohen.jota@gmail.com | |
| Website | nodalworks.se |
| Jonathan Cohen – Urban Data | |
| ORCID | 0000-0001-5252-6504 |
| @urba.ant |